Abstract
Functional imaging studies in normal humans have shown that the supplementary motor area (SMA) and the primary motor cortex (PMC) are coactivated during various breathing tasks. It is not known whether a direct pathway from the SMA to the diaphragm exists, and if so what properties it has. Using transcranial magnetic stimulation (TMS) a site at the vertex, representing the diaphragm primary motor cortex, has been identified. TMS mapping revealed a second area 3 cm anterior to the vertex overlying the SMA, which had a rapidly conducting pathway to the diaphragm (mean latency 16.7 ± 2.4 ms). In comparison to the vertex, the anterior position was characterized by a higher diaphragm motor threshold, a greater proportional increase in motor-evoked potential (MEP) amplitude with voluntary facilitation and a shorter silent period. Stimulus–response curves did not differ significantly between the vertex and anterior positions. Using paired TMS, we also compared intracortical inhibition/facilitation (ICI/ICF) curves. In comparison to the vertex, the MEP elicited from the anterior position was not inhibited at short interstimulus intervals (1–5 ms) and was more facilitated at long interstimulus intervals (9–20 ms). The patterns of response were identical for the costal and crural diaphragms. We conclude that the two coil positions represent discrete areas that are likely to be the PMC and SMA, with the latter wielding a more excitatory effect on the diaphragm.
The supplementary motor area (SMA) was originally identified by Woosley et al. in 1952 (Woosley et al. 1952). Since then, it has been demonstrated that the SMA has some specific cytoarchitectonic features, is somatotopically organized and is interconnected to various cortical and subcortical areas, notably the primary motor cortex (PMC) and thalamic nuclei, with projections to the spinal cord (He et al. 1995; Geyer et al. 2000). It plays a major role in the preparation and execution of movements (Tanji & Shima, 1994; Shima & Tanji, 1998; Geyer et al. 2000; Munchau et al. 2002). The involvement of the SMA in the control of breathing has been supported by functional brain imaging showing that it is significantly activated during various volitional respiratory tasks (Colebatch et al. 1991; Evans et al. 1999; McKay et al. 2003). In addition, the early negative component Nf of the respiratory-related evoked potential recorded from the frontal scalp has been source-localized to the SMA bilaterally (Logie et al. 1998). This finding suggests that the SMA processes proprioceptive input from the respiratory system.
Direct confirmation that the diaphragm is represented within the SMA remains to be found, as is the nature of its representation. One might expect an SMA cortex pattern of excitability that is distinct from that of the primary motor cortex because of its differing functional role, cytoarchitecture and connectivity.
Transcranial magnetic stimulation (TMS) has been used extensively to assess the excitability of the primary motor cortex controlling various skeletal muscles (Siebner & Rothwell, 2003), including the diaphragm (Maskill et al. 1991; Similowski et al. 1996a; Zifko et al. 1996; Sharshar et al. 2003). In particular the excitability of the diaphragm PMC can be described in terms of both facilitated and unfacilitated dose–response curves, the cortical silent period and the effect of paired stimuli (Maskill et al. 1991; Lefaucheur & Lofaso, 2002; Demoule et al. 2003b; Sharshar et al. 2003).
The objective of the present study was firstly to determine whether a discrete cortical representation could be identified and if so, to compare the functionality of this area with the PMC as judged by their respective MEP stimulus–response curves, ICI/ICF curves and silent periods.
Methods
Subjects
Eight healthy subjects (5 men and 3 women, 23–38 years of age), who were members of the laboratory staff, were studied. All were free of neurological and respiratory disease. The ethics committee of the Royal Brompton and Harefield Hospital approved the study and all subjects gave their written informed consent. All experiments conformed with the Declaration of Helsinki.
Measurements
Pressure signals
Oesophageal (Poes) and gastric (Pga) pressures were measured using two air-filled catheter-mounted balloons (Ackrad Laboratories, inc., Cranford, NJ, USA). The linearity of the pressure recording system has been confirmed over the range ± 200 cmH2O, and the pressure–volume characteristics of the balloon checked using the technique of Mead (Mead et al. 1967). The catheters were positioned in a standard manner (Baydur et al. 1982) and connected to differential pressure transducers (range ±300 cmH2O; Validyne corporation, Northridge, CA, USA). Transdiaphragmatic pressure (Pdi) was derived electronically by subtraction of Poes from Pga. Poes, Pga and Pdi were displayed continuously on a computer screen visible to the operator only.
Electrophysiological signals
Surface recordings of the right diaphragm compound motor action potential (CMAP) and motor-evoked potential (MEP) were obtained using Ag–AgCl electrodes whose optimal position was determined using transcutaneous electrical stimulation of the right phrenic nerve (Verin et al. 2002). Crural signals were obtained using an oesophageal electrode catheter (Gaeltec, Skye, UK), which consisted of four platinum coils forming six sequential pair of electrodes. The optimal position was characterized by opposite polarity and similar amplitude of the CMAP recorded from two pairs of electrodes (Luo et al. 1999). When the optimal position had been obtained, the electrode catheter was securely taped to the subject's nose. Crural signals were not interpretable in one subject because of ECG artefacts and wobble during inspiratory effort. Both surface and oesophageal electrode signals were acquired into a 5-channel EMG recorder (Medelec, Synergy, Oxford Instruments, Oxford, UK) with bandpass filtering at 3Hz to 10 kHz.
Single and paired transcranial magnetic stimulation
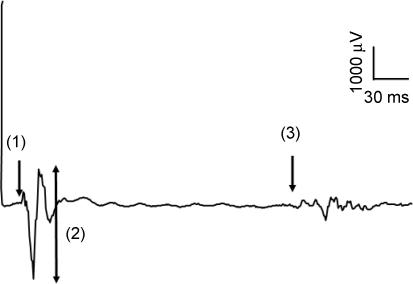
Single and paired transcranial magnetic stimulation (TMS) was performed using a Magstim 200 Mono-pulse magnetic stimulator and a 110 mm double cone coil with a distance of 5 cm between the centre of the coil and its leading edge (The Magstim Company, Whitland, UK). Throughout the studies, the coil was orientated so that the current flow in the brain was in an anterior–posterior direction and the interval between consecutive single or paired stimuli was at least 30 s. MEP100 refers to the MEP elicited by 100% of stimulator output (Fig. 1).
Figure 1. Typical diaphragm motor-evoked potential.
Diaphragm motor-evoked potential (MEP) elicited by 100% stimulation at the vertex during a submaximal inspiratory effort. Principal features are latency (arrow 1), amplitude (arrow 2) and finish of silent period (arrow 3).
Subjects were seated comfortably in an armchair, with their head supported throughout the study.
Protocols
Mapping
Mapping was completed in three steps. Firstly, the vertex (defined as the intersection of the midsagittal cranial and interaural lines) was marked with indelible ink. Intervals of 1 cm were then marked along the midsagittal line 4 cm forward and 3 cm back from the vertex. The coil was positioned on the scalp with its centre over the point to be stimulated. At each point, TMS was performed five times at 100% stimulator output at relaxed functional residual capacity (FRC) as judged by Poes and Pdi. As will be described, a subsidiary anterior peak in MEP response was identified 3 cm forward of the vertex and henceforth is termed the anterior position. Five 100% stimulations were then done at this point and at each point marked at 1, 2 and 3 cm to the left of this anterior position. MEP100-vertex and MEP100-anterior refer to the MEP elicited by 100% stimulus of the vertex and anterior position, respectively.
Secondly, for each subject, 1 cm intervals were marked along the midsagittal line 5 cm forward from the vertex in order to assess the silent period (SP) of the costal diaphragm MEP100 during a submaximal facilitatory effort, which consisted of asking the subject to generate 60% of their maximal inspiratory mouth pressure. Facilitation was achieved by generating an inspiratory effort against a closed airway from residual volume whilst wearing a nose clip. The investigator triggered TMS manually once the mouth pressure had reached a plateau for 2 s, judged visually from on-line monitoring. Five stimulations at 100% stimulator output were delivered at each point.
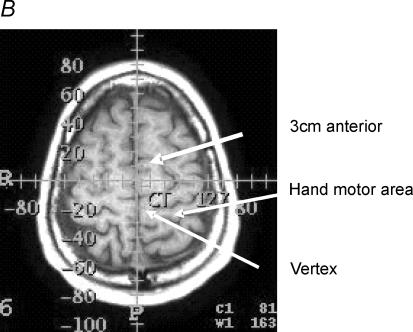
Thirdly, for each subject, magnetic resonance imaging (MRI) of the brain was performed with a marker positioned over the vertex and the anterior position. Using a three-dimensional grid with midline anterior–posterior and left–right rulers and using the right motor hand ‘omega’ area as a reference point, the motor areas located at the vertex and 3 cm anteriorly were assessed according to Talairach's system (Talairach et al. 1967).
Relaxed MEP recruitment curves – vertex and 3 cm anterior
Five stimuli were given at each of the stimulus intensities (40, 50, 60, 70, 80, 90 and 100% of stimulator output) in a random order as we have previously described (Sharshar et al. 2003). The vertex and anterior positions were stimulated in random order. The recruitment curves of the costal and crural diaphragms MEP were assessed at relaxed FRC, judged by Poes and Pdi.
Facilitated MEP amplitude and silent period – vertex and 3 cm anterior
Costal and crural diaphragms MEP100-vertex and MEP100-anterior were assessed at relaxed end-expiration (baseline) and during maximal inspiratory efforts (facilitation). For both positions, five stimuli were given in each condition (baseline and facilitation). For each subject, mean MEP100-vertex and MEP100-anterior silent periods (SPs) of the facilitated costal diaphragm were measured in milliseconds from the onset of MEP to the resumption of EMG activity. Artefacts related to the inspiratory manoeuvres precluded satisfactory assessment of the silent period of the crural diaphragm MEP.
Motor threshold and response to paired TMS at vertex and 3 cm anterior
For the costal and crural diaphragms, cortical motor threshold (MT), expressed as a percentage of stimulator output, was defined as the lowest intensity eliciting a MEP more than 50 μV in at least 5 out of 10 consecutive stimulations. Having provisionally identified a threshold, 10 consecutive stimulations at this intensity and at 5% increments of maximum stimulator output above or below this intensity were delivered to define motor threshold precisely. The motor thresholds of the costal and crural diaphragms were assessed separately at the vertex (MTvertex) and anterior position (MTanterior).
Paired stimulation was used to assess ICI/ICF curves of the relaxed diaphragm. For paired stimulations of the anterior position, the conditioning stimulus (CSanterior) and test stimulus (TSanterior) were defined as a TMS intensity of 80% and 125% of cortical MTanterior, respectively (Kujirai et al. 1993a,b; Ridding et al. 1995). A similar procedure was applied for the vertex. In cases where CS and TS were different for the costal and crural diaphragms, we chose to take the lowest CS and highest TS. For each position, five paired stimuli were given at interstimulus intervals of 1, 3, 5, 7, 9, 11, 13, 15 and 20 ms in random order. Five single stimulations at test stimulus intensity (TS) were also performed on three occasions.
Data conventions and statistical analyses
For the mapping study mean peak-to-peak amplitude of the costal diaphragm MEP100 at each position was measured in microvolts (Fig. 1) and normalized by dividing it by mean peak-to-peak amplitude (μV) of the costal MEP100-vertex. MEP100-anterior refers to the highest MEP amplitude elicited by 100% stimulation of a midline position anterior to the vertex.
To compare recruitment curves, the mean peak-to-peak amplitude (μV) of the costal diaphragm MEPvertex and MEPanterior was calculated at each stimulus intensity, then normalized by dividing it by the mean amplitude of the relaxed costal diaphragm MEP100-vertex. The same procedure was applied for the crural diaphragm.
For the facilitation study the mean peak-to-peak MEP100-vertex amplitudes of the facilitated costal and crural diaphragms were measured and normalized to that of the relaxed costal and crural diaphragms. The same calculation was applied for MEP100-anterior. The mean MEP100 SPs were measured for each midsagittal position and normalized to MEP100-vertex SP (Fig. 1).
For the paired stimulation study MEPTS-vertex and MEPTS-anterior refer to the MEP elicited by the test stimulus alone at the vertex and anterior position, respectively. In each subject and separately for the costal and crural diaphragms, mean peak-to-peak amplitude of MEPvertex at each interstimulus interval was expressed as a percentage of MEPTS-vertex. The same calculation was applied to MEPanterior.
Crural and costal diaphragms responses were analysed separately. Paired t tests, or Wilcoxon signed rank test when appropriate, were used to compare MEP100-vertex and MEP100-anterior latency, facilitated normalized MEP100-vertex and MEP100-anterior amplitude, cortical SPvertex and SPanterior, MTvertex and MTanterior, MEPTS-vertex and MEPTS-anterior amplitude. The effects of coil position on MEP amplitude and MEP100 SP were tested using repeated-measures ANOVA. The recruitment and ICI/ICF curves of the diaphragm MEPvertex and MEPanterior were compared using two-factors repeated-measures ANOVA, with intensity or interstimulus interval as the within-group factor, and scalp position as the between-group factor. Post hoc, paired-sample t tests were performed. Values in the text are expressed as mean ± s.d. A P value of < 0.05 was considered significant for all statistical analyses.
Results
Mapping the diaphragm response to transcranial magnetic stimulation
The amplitude of the relaxed diaphragm MEP100 changed significantly with coil position (ANOVA, P < 0.001), with peaks at the vertex (MEP100-vertex= 802 ± 781 μV), and 3 cm forward (MEP100-anterior= 572 ± 550 μV) (Fig. 2). This pattern was found in all but one subject in whom the anterior peak was not observed. Post hoc tests showed that the diaphragm MEPvertex amplitude was significantly higher than MEP amplitude elicited by stimulation of any other scalp position, including the anterior position (MEP100-vertex versus MEP100-anterior, P = 0.03). MEP100-anterior amplitude was significantly higher than MEP100 amplitude elicited by stimulation of adjacent midsagittal positions (both P = 0.009). MEP100-anterior amplitude significantly decreased as the coil was moved laterally (costal: P = 0.003; crural: P = 0.04). The mean latencies of the relaxed diaphragm MEP100-vertex and MEP100-anterior were not significantly different (16.4 ± 2.7 ms versus 16.7 ± 2.4 ms).
Figure 2. Relationship between the amplitude of the costal diaphragm MEP and coil position relative to the vertex.
Individual and mean responses are represented by dashed and continuous lines, respectively. All stimulations were performed at 100% of stimulator output. Values are expressed as a percentage of the response elicited at the vertex. Each square corresponds to the mean of an individual subject. Each triangle corresponds to the mean (+ s.e.m.) of eight subjects. MEP amplitude varied significantly with change in coil position (P < 0.0001). The response to stimulation was characterized by two peaks representing the primary motor cortex (vertex) and supplementary motor area (vertex + 3 cm).
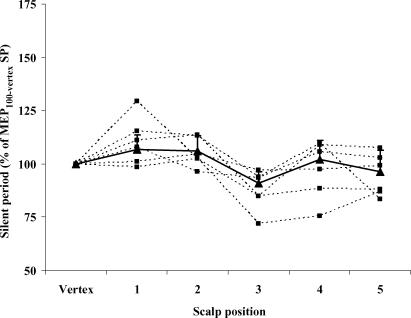
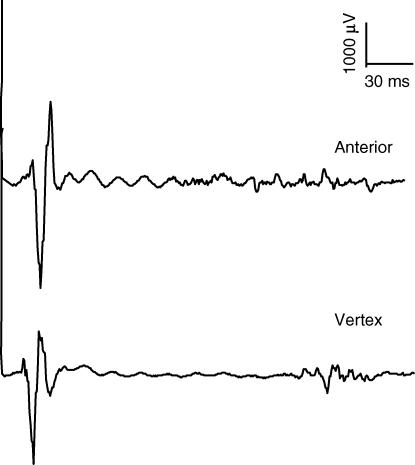
The diaphragm MEP100 SP was assessed in six subjects. There was a significant change in MEP100 SP (ANOVA, P = 0.004) with coil position, with dips at the vertex and anterior position (Fig. 3). This pattern was observed in all subjects. MEP100-anterior SP was significantly shorter than that elicited at any other midsagittal position, including the vertex, during both submaximal (199 ± 48 versus 179 ± 37 ms, P = 0.02) and maximal inspiratory effort (180 ± 52 versus 161 ± 49 ms, P = 0.03) (Fig. 4).
Figure 3. Individual relationship between the silent period (SP) of the costal diaphragm MEP and scalp position of the coil relative to the vertex.
Individual and global relationships are represented by dashed and continuous lines, respectively. All stimulations were performed at 100% of stimulator output during 60% of maximal inspiratory effort. MEP silent period in each position is expressed as a percentage of that elicited by 100% stimulation at the vertex. Each square corresponds to the mean of each subject. Each triangle corresponds to the mean (+ s.e.m.) of six subjects. MEP amplitude varied significantly with change in scalp position (P < 0.0001). The response to stimulation was characterized by two peaks representing the primary motor cortex (vertex) and supplementary motor area (vertex + 3 cm).
Figure 4. Costal diaphragm MEP100.
MEP elicited by 100% stimulation over the anterior position (upper trace) and vertex (lower trace) during a maximal inspiratory effort. The silent period, measured from the onset of MEP to resumption of EMG activity, was shorter for the anterior position (P = 0.03).
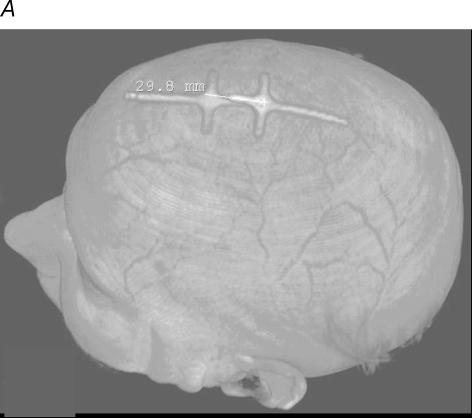
In addition, six subjects underwent MRI of the brain. In all subjects the markers at the vertex and 3 cm anterior spot appeared to overlie the PMC and SMA, respectively, as shown in Fig. 5.
Figure 5. Magnetic resonance imaging.
Anatomical location of the primary motor cortex and supplementary motor area relative to the vertex and the 3 cm anterior position in one subject. A, markers used to identify the two positions. B shows that these markers were situated at −20 and +10 mm on an anterior–posterior axis and overlay the primary motor cortex (PMC) and supplementary motor area (SMA), respectively, which were identified according to Tallairach's handbook.
Recruitment curves of the relaxed diaphragm at vertex and anterior positions
Six subjects were studied (2 women and 4 men, ages 23–38 years). In both positions and for both the costal and crural diaphragms, increasing stimulator output was associated with a significant increase in resting diaphragm MEP amplitude (all P < 0.001). MEPanterior and MEPvertex amplitude differed significantly for both the costal and crural diaphragm (P = 0.04 and P = 0.003), the former being lower at most stimulation intensities (Fig. 6). However, the shape of MEPvertex and MEPanterior recruitment curves were not different either for the costal or the crural diaphragm.
Figure 6. Relationship between stimulation intensity and amplitude of the diaphragm MEP.
The amplitude of the diaphragm MEP was elicited by stimulation of the vertex (▴) and anterior position (▪). MEP amplitude is expressed as a percentage of the MEP amplitude elicited by 100% stimulation over the vertex. Each point corresponds to the mean (+ s.e.m.) in six subjects for the costal (A) and five subjects for the crural (B) diaphragm, respectively.
Amplitude, and latency of the diaphragm MEPvertex and MEPanterior during maximum inspiratory efforts
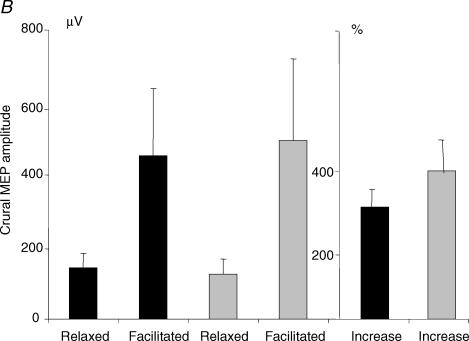
Six subjects were studied (2 women and 4 men, ages 23–38 years). The means of maximal inspiratory mouth pressure generated during vertex and anterior transcranial magnetic stimulation were identical (118 ± 27 versus 117 ± 26 cmH2O, P = 0.69). Inspiratory effort induced a significant increase in mean amplitude of the costal (456 ± 462 versus 1606 ± 1121 μV, P = 0.03) and crural (149 ± 82 versus 475 ± 396 μV, P = 0.04) MEPvertex. MEPanterior amplitude also increased significantly with inspiratory effort (costal MEPanterior: 312 ± 261 versus 1794 ± 1282 μV, P = 0.03; crural MEPanterior: 137 ± 79 versus 550 ± 465 μV, P = 0.04). The mean percentage increase in amplitude with facilitation was larger for the anterior position in both the costal (720 ± 579% versus 541 ± 521%, P = 0.03) and crural diaphragms (410 ± 176% versus 310 ± 111%, P = 0.04) (Fig. 7A and B). During maximal inspiratory efforts, MEP100-vertex and MEP100-anterior latencies were significantly different for both costal (11.3 ± 1.0 versus 12.3 ± 0.5 ms, P = 0.04) and crural (10.8 ± 0.9 ms versus 9.6 ± 1.2 ms, P = 0.04) diaphragms.
Figure 7. Effect of maximal inspiratory effort on the amplitude of the diaphragm MEP elicited by 100% stimulation.
Black columns represent the vertex, grey columns the anterior position. Relaxed and facilitated MEP100-vertex and MEP100-anterior amplitude is expressed in microvolts. Facilitated MEP100-vertex and MEP100-anterior are also expressed as percentage increase of relaxed MEP100-vertex and MEP100-anterior amplitude. Each point corresponds to the mean (+ s.e.m.) in six and five subjects for the costal (A) and crural (B) diaphragm, respectively. For the costal and crural diaphragms, there was a significant increase in amplitude of MEP100-vertex (P = 0.03 and P = 0.04) and MEP100-anterior (P = 0.03 and P = 0.04) with maximal inspiratory effort. Maximal inspiratory effort induced a significantly greater increase in MEP100-anterior amplitude than MEP100-vertex amplitude, for both parts of the diaphragm (P = 0.03 and P = 0.04).
Motor threshold and ICI/ICF curves of the relaxed diaphragm
Six subjects were studied (2 women and 4 men, ages 23–38 years). MTvertex was significantly lower than MTanterior for the costal diaphragm (78 ± 19 versus 86 ± 17% of stimulator output, P = 0.03) but the difference just failed to achieve significance for the crural diaphragm (86 ± 15 versus 91 ± 15% of stimulator output, P = 0.07).
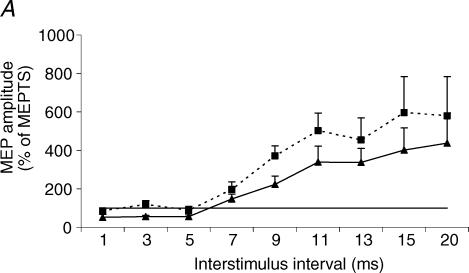
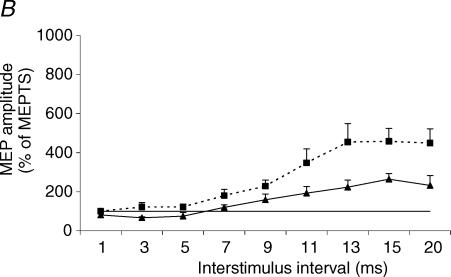
The effect of varying interstimulus interval was significant for both the costal and crural diaphragm (P < 0.0001). The effect of coil position was significant as ICI/ICF curves of the MEPvertex and MEPanterior differed significantly for both costal and crural diaphragms (P = 0.03 and P = 0.01, respectively) (Fig. 8). At short interstimulus interval, significant inhibition of MEPvertex occurred, most pronounced at 3 ms (costal MEPvertex: 55 ± 15% of TS; crural MEPvertex: 67 ± 10% of TS). By contrast, MEPanterior, recorded from either part of the diaphragm, was not inhibited at short interstimulus intervals ranging from 1 to 5 ms.
Figure 8. ICI/ICF curves of the diaphragm MEP.
Diaphragm MEP elicited by paired transcranial magnetic stimulation (TMS) of the vertex (▴) and anterior position (▪). MEP amplitude is expressed as a percentage of the response to the test stimulus alone (MEPTS). Each point corresponds to the mean (+ s.e.m.) in six and five subjects for the costal (A) and crural (B) diaphragms, respectively. At both scalp positions, there was a significant change in MEP amplitude with increase in interstimulus interval for the costal and crural diaphragms (both P < 0.0001). There was a significant difference between the vertex and anterior position ICI/ICF curves for the costal (P = 0.03) and crural (P = 0.01) diaphragm, with less inhibition and more facilitation of the costal and crural diaphragms from the anterior position.
At longer interstimulus intervals ranging from 7 to 20 ms, the response to anterior stimulation was more facilitated than at the vertex for both parts of the diaphragm. Post hoc tests showed that MEPanterior amplitude was significantly higher than MEPvertex amplitude at 3, 9 and 11 ms interstimulus interval for the costal diaphragm and at 5, 11, 13, 15 and 20 ms interstimulus interval for the crural diaphragm (Table 1 and Fig. 8).
Table 1.
Motor threshold and response to paired stimulation
| Vertex | Anterior | P value | |
|---|---|---|---|
| Costal diaphragm (n = 6) | |||
| Motor threshold (%) | 78 ± 19 | 86 ± 17 | 0.03 |
| Test stimulus (μV) | 145 ± 111 | 156 ± 43 | 0.76 |
| ISI 3 ms (% of TS) | 55.1 ± 15.3 | 118.6 ± 49.1 | 0.03 |
| ISI 9 ms (% of TS) | 222.6 ± 106.4 | 370.9 ± 127.1 | 0.003 |
| ISI 11 ms (% of TS) | 338.1 ± 205.3 | 502.5 ± 223.1 | 0.03 |
| Crural diaphragm (n = 5) | |||
| Motor threshold (%) | 86 ± 15 | 91 ± 15 | 0.07 |
| Test stimulus (μV) | 112 ± 65 | 71 ± 26 | 0.10 |
| ISI 5 ms (% of TS) | 75.1 ± 39.6 | 122.5 ± 33.0 | 0.03 |
| ISI 11 ms (% of TS) | 192.9 ± 75.7 | 347.8 ± 159.8 | 0.04 |
| ISI 15 ms (% of TS) | 264.1 ± 64.3 | 458.2 ± 148.1 | 0.02 |
Values are mean ± s.d. Abbreviations: TS, test stimulus; ISI, interstimulus interval.
Discussion
Our study demonstrates that there are two midline positions at which transcranial magnetic stimulation elicits a rapidly conducted diaphragm response. One peak was observed at the vertex, and the second 3 cm anteriorly, suggesting that they represent discrete cortical motor areas. Although the areas had some similarities, notably the shape of their relaxed diaphragm recruitment curves, there were significant differences in terms of MEP amplitude, resting motor threshold, ICI/ICF curves, the proportion of increase in MEP amplitude with maximal inspiratory effort as well as the facilitated MEP latency and silent period. In comparison with the vertex, the diaphragm MEPanterior was more facilitated during maximal inspiratory efforts and by paired TMS at facilitatory interstimulus intervals. We propose that the anterior area is likely to represent the supplementary motor area (SMA) whilst the vertex position is likely to represent the primary motor cortex (PMC).
Methodological issues
The major issue to be addressed is whether two discrete areas of the motor cortex have been stimulated or whether the anterior peak represents a field effect due to the size of the coil used. This potential phenomenon we have termed a ‘trailing edge’ effect because in the anterior position the trailing edge of the coil crosses the interauricular line. The easiest way to refute this would have been to elicit a response from the relaxed diaphragm in the anterior position with a more focal coil (Maskill et al. 1991); we were unable to do this with 45 or 70 mm figure-of-eight coils positioned over the midline. However, because the motor threshold of the anterior area is higher than that of the vertex we do not consider the absence of such a response to be evidence that the anterior position is not a genuinely distinct area. Indeed without the 110 mm double-cone coil it may be difficult to elicit a response even over the vertex (Similowski et al. 1996b). The significant decrease in the diaphragm MEP amplitude when intermediate (1 and 2 cm anterior to the vertex) scalp positions were stimulated argues against the possibility that we had stimulated the same area from different distances. More importantly, we found no peak 3 cm posterior to the vertex, which would have been expected if there were a ‘trailing edge’ effect. The observed change in MEP silent period with location of stimulating site is an additional and supportive argument. Given that silent period is proportional to stimulus intensity (Taylor et al. 1996; Priori et al. 1999), the hypothesis of a single motor area stimulated from one close and one distant point might explain why the MEP silent period was longer at the vertex than at 3 cm anterior, but cannot explain the significant increase in SP that we observed in an intermediate position.
The observed differences in the response to paired stimulation also support the presence of separate areas with distinct characteristics. However, this can only be used as a supportive argument if similar changes in ICI/ICF curves could not be induced by what would effectively be a variation in the conditioning stimulus intensity as a consequence of the distance between coil and cortex. Indeed it has been shown that changes in conditioning stimulus can influence ICI/ICF response curves (Chen et al. 1998; Abbruzzese et al. 1999; Kossev et al. 2003), as can varying test stimulus relative to threshold (Chen et al. 1998), contraction of the targeted muscle (Abbruzzese et al. 1999) and orientation of the coil (Trompetto et al. 1999). An increase in conditioning stimulus intensity from 80 to 90% of resting motor threshold reduces intracortical inhibition and enhances intracortical facilitation in various upper limb, lower limb and trunk muscles (Chen et al. 1998). At an interstimulus interval of 3 ms, a U-shaped change in inhibition has been observed with changes in the conditioning stimulus, the maximal inhibition occurring at 70% of motor threshold (Abbruzzese et al. 1999; Kossev et al. 2003). At interstimulus intervals of 12–13 ms, facilitation increased proportionally with the intensity of the conditioning stimulus (Abbruzzese et al. 1999; Kossev et al. 2003). Thus, if we had simply stimulated the PMC from a distance and hence at a ‘lower’ intensity, stimulation of the anterior scalp position should have resulted in more inhibition and less facilitation, as intensity of CS waned proportionally with distance. In fact the opposite pattern was found with the greatest diaphragm response to paired transcranial magnetic stimulation being elicited at the anterior position. Similarly, assuming an identical area, test stimulus intensity should also effectively be less for anterior than vertex stimulation. A decrease in test stimulus from 120 to 105% of resting motor threshold significantly attenuates intracortical inhibition but does not significantly affect intracortical facilitation (Chen et al. 1998) at least in the abductor pollicis. Therefore, the differences we observed in diaphragm intracortical facilitation increase related to anterior stimulation cannot be explained by a variation in test stimulus intensity arising from stimulation of the same area from different distances.
We also believe our findings cannot be related to a difference in the current flow direction either, as the coil was held in anterior–posterior direction throughout (Trompetto et al. 1999). It has to be noted that response to paired transcranial magnetic stimulation is not different from circular and figure-of-eight coils, suggesting that the depth of magnetically generated current field does not account for variation in ICI/ICF curves (Chen et al. 1998). Likewise, it is highly probable that the same principle applies with the double-cone coil, although it was not tested against other types of coil. Therefore, ICI/ICF curves of a given motor area would not be altered by coil displacement-related change in the current field.
Finally, one might suggest that change in ICI/ICF curves was related to stimulation of other thoracic muscles because their cortical motor neurones might have been preferentially targeted in the anterior coil position and might have a motor threshold different from that of the diaphragm. This is unlikely because of the consistent differences between the two positions for both costal and crural diaphragms. Similarly we confirmed that the proportional increase in MEP amplitude during maximal inspiratory effort was higher in the anterior than the vertex position, for both the costal and crural diaphragms. In passing we argue that the similarities between costal and crural diaphragm signals, which we have previously noted (Verin et al. 2004) justify the continued careful use of chest wall electrodes as described by Verin et al. for the measurement of the diaphragm response to TMS (Verin et al. 2002).
Significance of the findings
If it is accepted that a second discrete anterior area was identified, the next issue is whether the vertex and anterior positions correspond to the primary motor cortex and supplementary motor area, respectively. This view is supported by neuroimaging with stereotactic grid mapping, which showed that the PMC and SMA were the closest motor areas to the vertex and 3 cm anterior position, respectively. However, we did not directly assess whether stimulation at the vertex and 3 cm anterior site preferentially activated the PMC and SMA, as firstly magnetic stimulation may distort functional MRI images, and secondly we did not have access to positron emission tomography (PET) scanning. The relationship between TMS mapping and functional neuroimaging has been demonstrated with a correlation between the stimulation position and the anatomy of the hand area in the pre-central gyrus (Levy et al. 1991; Wassermann et al. 1996; Singh et al. 1997). However, it has been shown that maximal MEP occurred a mean of 13 mm from the area of maximal activation on neuroimaging (Wassermann et al. 1996). The relationship between TMS maps and functional anatomy has not been assessed for the diaphragm.
Foerster (1936), mapping the human motor cortex using direct electrical stimulation during neurosurgery under local anaesthesia, found that the diaphragm site was close to the vertex, anterior to the thoracic muscle site. With transcranial electrical or magnetic stimulation, the diaphragm site within the motor cortex has varied between studies, depending on the type of stimulation and the coil used. Gandevia & Rothwell (1987) reported that transcranial electrical stimulation of the vertex produced the shortest MEP latency and maximal twitch of the diaphragm during inspiration. With a circular magnetic coil, diaphragm MEP has in most studies been elicited at the vertex (Murphy et al. 1990; Similowski et al. 1996a; Zifko et al. 1996). However, formal mapping of the diaphragm motor cortical representation was not performed in those studies. This was first achieved by Maskill et al. (1991) who used a figure-of-eight coil that has the advantage of a greater focusing of the stimulation-induced current vector. They found that the diaphragm MEP amplitude was maximal when stimulation was at 2–3 cm anterior to the interauricular plane and 3 cm to one side of the midline, during an inspiratory effort. Interestingly, Maskill et al. (1991) raised the issue that SMA might have been stimulated, at least simultaneously, with PMC. However, in that (and most previous studies) simultaneous diaphragm contraction was required because circular or figure-of-eight coils were insufficiently powerful to elicit a response in the relaxed diaphragm. By contrast, using the 110 mm double-cone coil, we have found that in most subjects in the relaxed diaphragm, stimulation at the vertex induced the maximal response (Sharshar et al. 2003). In the present study, the vertex was, among other midline positions tested, also the origin of the highest MEP amplitude and shortest MEP latency of the relaxed diaphragm. Consistent with our data it has been shown that, compared to other areas of the motor cortex, the primary motor cortex has the lowest threshold to elicit a skeletal muscle response in primates (Wu et al. 2000). In the present study, resting motor threshold of the diaphragm MEP was lower at the vertex than in the anterior position. Since MEP amplitude and motor threshold are inversely correlated, it can be argued that the decrease in MEP amplitude as the coil was moved away from the vertex was associated with a concomitant increase in resting motor threshold. Thus we believe that the vertex position represents the primary motor cortex because neurosurgical studies show that the diaphragm representation in the primary motor cortex is close to the vertex in humans (Foerster, 1936) and because the vertex was considered to be so in most previous studies using transcranial electrical or magnetic stimulation to elicit a response from either the diaphragm (Gandevia & Rothwell, 1987; Murphy et al. 1990; Similowski et al. 1996a; Zifko et al. 1996; Demoule et al. 2003a,b; Sharshar et al. 2003) or other skeletal muscles. That being so it is most likely that the anterior position represents the SMA.
The SMA occupies a region in the midline, 2–3 cm rostral to the primary motor leg area. Like the primary motor cortex, the supplementary motor area is somatotopically organized with a representation of the body's periphery (Fink et al. 1997; Geyer et al. 2000; Wu et al. 2000) including trunk muscles. The primary motor cortex and supplementary motor area are interconnected and both also connect directly to the spinal cord (He et al. 1995; Geyer et al. 2000; Wu et al. 2000; Picard & Strick, 2001). A corticospinal pathway from the primary motor cortex to the phrenic motoneurones has been demonstrated in humans (Foerster, 1936; Aminoff & Sears, 1971) but a direct pathway linking the supplementary motor area to the diaphragm has not previously been identified. Nevertheless such a pathway is suggested by the presence of a short MEP latency in response to stimulation over the SMA. Moreover, the induction of trunk muscle twitch in response to microstimulations of the SMA in primates also supports the likelihood that there is a corticospinal pathway between the SMA and phrenic motoneurones (Wu et al. 2000). Functional imaging of SMA activation during breathing tasks (Colebatch et al. 1991; Evans et al. 1999; McKay et al. 2003) is insufficient to prove that such pathways exist, though it suggests that the SMA is involved in diaphragm control.
Thus it is likely that the position 3 cm anterior to the vertex corresponds to the supplementary motor area because of its known anatomical location (Geyer et al. 2000; Picard & Strick, 2001; Macdonald & Halliday, 2002) which also corresponds to that identified in most previous TMS studies on the role of SMA in non-respiratory motor control (Civardi et al. 2001; Serrien et al. 2002; Verwey et al. 2002). In addition it is likely that the diaphragm is represented in the SMA, which is known to be somatotopically organized and to project directly to the spinal cord. In fact approximately 30–50% and 10–30% of the corticospinal fibres originate, respectively, from the PMC and SMA (Geyer et al. 2000; Wu et al. 2000; Picard & Strick, 2001; Macdonald & Halliday, 2002). Conversely other pre-motor areas, which are anatomically situated anteriorly (pre-SMA) or antero-laterally (pre-motor cortex) to the SMA, do not project directly to the spinal cord (Civardi et al. 2001; Macdonald & Halliday, 2002) and would presumably not give rise to short latency MEPs.
We found that, in comparison to responses to PMC stimulation, the diaphragm MEP elicited by SMA stimulation was, at rest, significantly less inhibited and more facilitated by short and long interstimulus intervals, respectively, and, during voluntary inspiratory efforts, had a significantly shorter silent period and was significantly more facilitated. Taken together these findings suggest that SMA has an excitatory output projecting directly or indirectly to phrenic motoneurones. The differences in response to paired transcranial magnetic stimulation between SMA and PMC indicate that the excitability of inhibitory or excitatory interneurones differs between these two motor areas. This discrepancy may reflect differences in cytoarchitecture (density of inhibitory and excitatory interneurones) or projections received from cerebral areas (inhibitory/excitatory input), but this is beyond the scope of this study. We are also not able to assess whether this difference was specific to the diaphragm as responses to paired TMS of the SMA have never, to our knowledge, been reported for other skeletal muscles. Functionally our data suggest that SMA exerts a more facilitatory input on phrenic motoneurones than PMC.
Finally one should consider whether the diaphragm response to SMA stimulation was direct or mediated by the PMC, as the two areas are interconnected. The short MEPanterior latency very strongly suggests a direct connection. The role of the SMA in the control of breathing and its connectivity to PMC and spinal cord, in both health and respiratory disease, merit future study. For this purpose work in limb muscle suggests that paired or repetitive TMS could be used. For example, Civardi and coworkers (Civardi et al. 2001) reported that conditioning stimulus of the SMA influenced the PMC response to a test stimulus, according to the interstimulus interval. By using the latter technique, Münchau and coworkers (Münchau et al. 2002) have recently shown that repetitive stimulation of the pre-motor cortex alters the response of the PMC to paired TMS as well as the MEP silent period.
In conclusion, a short latency diaphragm MEP can be elicited by transcranial magnetic stimulation of an area anterior to the vertex, which is likely to represent the SMA. The neurophysiology of these two areas differs significantly, in terms both of their intracortical inhibitory/excitatory balance at rest and their facilitatory output to phrenic motoneurones during volitional inspiratory effort. Our findings suggest that SMA exerts a predominantly excitatory effect.
References
- Abbruzzese G, Assini A, Buccolieri A, Schieppati M, Trompetto C. Comparison of intracortical inhibition and facilitation in distal and proximal arm muscles in humans. J Physiol. 1999;514:895–903. doi: 10.1111/j.1469-7793.1999.895ad.x. 10.1111/j.1469-7793.1999.895ad.x. [DOI] [PMC free article] [PubMed] [Google Scholar]
- Aminoff MJ, Sears TA. Spinal integration of segmental, cortical and breathing inputs to thoracic respiratory motoneurones. J Physiol. 1971;215:557–575. doi: 10.1113/jphysiol.1971.sp009485. [DOI] [PMC free article] [PubMed] [Google Scholar]
- Baydur A, Behrakis PK, Zin WA, Jaeger M, Milic-Emili J. A simple method for assessing the validity of the oesophageal balloon technique. Am Rev Respir Dis. 1982;126:788–791. doi: 10.1164/arrd.1982.126.5.788. [DOI] [PubMed] [Google Scholar]
- Chen R, Tam A, Butefisch C, Corwell B, Ziemann U, Rothwell JC, Cohen LG. Intracortical inhibition and facilitation in different representations of the human motor cortex. J Neurophysiol. 1998;80:2870–2881. doi: 10.1152/jn.1998.80.6.2870. [DOI] [PubMed] [Google Scholar]
- Civardi C, Cantello R, Asselman P, Rothwell JC. Transcranial magnetic stimulation can be used to test connections to primary motor areas from frontal and medial cortex in humans. Neuroimage. 2001;14:1444–1453. doi: 10.1006/nimg.2001.0918. [DOI] [PubMed] [Google Scholar]
- Colebatch JG, Adams L, Murphy K, Martin AJ, Lammertsma AA, Tochon-Danguy HJ, Clark JC, Friston KJ, Guz A. Regional cerebral blood flow during volitional breathing in man. J Physiol. 1991;443:91–103. doi: 10.1113/jphysiol.1991.sp018824. [DOI] [PMC free article] [PubMed] [Google Scholar]
- Demoule A, Verin E, Locher C, Derenne JP, Similowski T. Validation of surface recordings of the diaphragm response to transcranial magnetic stimulation in humans. J Appl Physiol. 2003a;94:453–461. doi: 10.1152/japplphysiol.00581.2002. [DOI] [PubMed] [Google Scholar]
- Demoule A, Verin E, Ross E, Moxham J, Derenne JP, Polkey MI, Similowski T. Intracortical inhibition and facilitation of the response of the diaphragm to transcranial magnetic stimulation. J Clin Neurophysiol. 2003b;20:59–64. doi: 10.1097/00004691-200302000-00008. 10.1097/00004691-200302000-00008. [DOI] [PubMed] [Google Scholar]
- Evans KC, Shea SA, Saykin AJ. Functional MRI localisation of central nervous system regions associated with volitional inspiration in humans. J Physiol. 1999;520:383–392. doi: 10.1111/j.1469-7793.1999.00383.x. 10.1111/j.1469-7793.1999.00383.x. [DOI] [PMC free article] [PubMed] [Google Scholar]
- Fink GR, Frackowiak RS, Pietrzyk U, Passingham RE. Multiple non-primary motor areas in the human motor cortex. J Neurosci. 1997;77:2164–2174. doi: 10.1152/jn.1997.77.4.2164. [DOI] [PubMed] [Google Scholar]
- Foerster O. Motorische Felder und Bahnen. In: Bumke O, Foerster O, editors. Handbuch der Neurology. Berlin: Springer; 1936. pp. 1–357. [Google Scholar]
- Gandevia SC, Rothwell JC. Activation of the human diaphragm from the motor cortex. J Physiol. 1987;384:109–118. doi: 10.1113/jphysiol.1987.sp016445. [DOI] [PMC free article] [PubMed] [Google Scholar]
- Geyer S, Matteli M, Luppino G, Zilles K. Functional neuroanatomy of the primate isocortical motor system. Anat Embryol (Berl) 2000;202:443–474. doi: 10.1007/s004290000127. 10.1007/s004290000127. [DOI] [PubMed] [Google Scholar]
- He SQ, Dunn RP, Strick PL. Topographic organization of corticospinal projections from the frontal lobe: motor areas on the medial surface of the hemisphere. J Neurosci. 1995;15:3284–3306. doi: 10.1523/JNEUROSCI.15-05-03284.1995. [DOI] [PMC free article] [PubMed] [Google Scholar]
- Kossev AR, Siggelkow S, Dengler R, Rollnik JD. Intracortical inhibition and facilitation in paired-pulse transcranial magnetic stimulation: effect of conditioning stimulus intensity on sizes and latencies of motor evoked potentials. J Clin Neurophysiol. 2003;20:54–58. doi: 10.1097/00004691-200302000-00007. 10.1097/00004691-200302000-00007. [DOI] [PubMed] [Google Scholar]
- Kujirai T, Caramia M, Rothwell J, Day B, Thompson P, Ferbert A, Wroe S, Asselman P, Marsden C. Corticocortical inhibition in human motor cortex. J Physiol. 1993a;471:501–519. doi: 10.1113/jphysiol.1993.sp019912. [DOI] [PMC free article] [PubMed] [Google Scholar]
- Kujirai T, Sato M, Rothwell JC, Cohen LG. The effect of transcranial magnetic stimulation on median nerve somatosensory evoked potentials. Electroencephalogr Clin Neurophysiol. 1993b;89:227–234. doi: 10.1016/0168-5597(93)90100-4. 10.1016/0168-5597(93)90100-4. [DOI] [PubMed] [Google Scholar]
- Lefaucheur JP, Lofaso F. Diaphragmatic silent period to transcranial magnetic cortical stimulation for assessing cortical motor control of the diaphragm. Exp Brain Res. 2002;146:404–409. doi: 10.1007/s00221-002-1197-3. 10.1007/s00221-002-1197-3. [DOI] [PubMed] [Google Scholar]
- Levy WJ, Amassian VE, Schmid UD, Jungreis C. Mapping motor cortex gyral sites non-invasively by transcranial magnetic stimulation in normal subjects and patients. Electroencephalogr Clin Neurophysiol Suppl. 1991;43:135–146. [PubMed] [Google Scholar]
- Logie ST, Colrain IM, Webster KE. Source dipole analysis of the early components of RREP. Brain Topogr. 1998;11:153–164. doi: 10.1023/a:1022210723257. 10.1023/A:1022210723257. [DOI] [PubMed] [Google Scholar]
- Luo YM, Johnson LC, Polkey MI, Harris ML, Lyall RA, Green M, Moxham J. Diaphragm electromyogram measured with unilateral magnetic stimulation. Eur Respir J. 1999;13:385–390. doi: 10.1183/09031936.99.13238599. 10.1183/09031936.99.13238599. [DOI] [PubMed] [Google Scholar]
- Macdonald V, Halliday GM. Selective loss of pyramidal neurons in the pre-supplementary motor cortex in Parkinson's disease. Mov Disord. 2002;17:1166–1173. doi: 10.1002/mds.10258. 10.1002/mds.10258. [DOI] [PubMed] [Google Scholar]
- McKay LC, Evans KC, Frackowiak RS, Corfield DR. Neural correlates of voluntary breathing in humans. J Appl Physiol. 2003;95:1170–1178. doi: 10.1152/japplphysiol.00641.2002. [DOI] [PubMed] [Google Scholar]
- Maskill D, Murphy K, Mier A, Owen M, Guz A. Motor cortical representation of the diaphragm in man. J Physiol. 1991;443:105–121. doi: 10.1113/jphysiol.1991.sp018825. [DOI] [PMC free article] [PubMed] [Google Scholar]
- Mead J, Turner JM, Macklem PT, Little JB. Significance of the relationship between lung recoil and maximum expiratory flow. J Appl Physiol. 1967;22:95–108. doi: 10.1152/jappl.1967.22.1.95. [DOI] [PubMed] [Google Scholar]
- Münchau A, Bloem BR, Iribacher K, Trimble MR, Rothwell JC. Functional connectivity of human premotor and motor cortex with repetitive transcranial magnetic stimulation. J Neurosci. 2002;22:554–561. doi: 10.1523/JNEUROSCI.22-02-00554.2002. [DOI] [PMC free article] [PubMed] [Google Scholar]
- Murphy K, Mier A, Adams L, Guz A. Putative cerebral cortical involvement in the ventilatory response to inhaled CO2 in conscious man. J Physiol. 1990;420:1–18. doi: 10.1113/jphysiol.1990.sp017898. [DOI] [PMC free article] [PubMed] [Google Scholar]
- Picard N, Strick PL. Imaging the premotor areas. Curr Opin Neurobiol. 2001;11:663–672. doi: 10.1016/s0959-4388(01)00266-5. 10.1016/S0959-4388(01)00266-5. [DOI] [PubMed] [Google Scholar]
- Priori A, Oliviero A, Donati E, Callea L, Bertolasi L, Rothwell JC. Human handedness and asymmetry of the motor cortical silent period. Exp Brain Res. 1999;128:390–396. doi: 10.1007/s002210050859. 10.1007/s002210050859. [DOI] [PubMed] [Google Scholar]
- Ridding MC, Sheean G, Rothwell JC, Inzelberg R, Kujirai T. Changes in the balance between motor cortical excitation and inhibition in focal, task specific dystonia. J Neurol Neurosurg Psychiatry. 1995;59:493–498. doi: 10.1136/jnnp.59.5.493. [DOI] [PMC free article] [PubMed] [Google Scholar]
- Serrien DJ, Strens LH, Oliviero A, Brown P. Repetitive transcranial magnetic stimulation of the supplementary motor area (SMA) degrades bimanual movement control in humans. Neurosci Lett. 2002;328:89–92. doi: 10.1016/s0304-3940(02)00499-8. 10.1016/S0304-3940(02)00499-8. [DOI] [PubMed] [Google Scholar]
- Sharshar T, Ross E, Hopkinson NS, Dayer M, Nickol A, Lofaso F, Moxham J, Similowski T, Polkey MI. Effect of voluntary facilitation on the diaphragmatic response to transcranial magnetic stimulation. J Appl Physiol. 2003;95:26–34. doi: 10.1152/japplphysiol.00918.2002. [DOI] [PubMed] [Google Scholar]
- Shima K, Tanji J. Both supplementary and presupplementary motor area are crucial for the temporal organization of multiple movements. J Neurophysiol. 1998;80:3247–3260. doi: 10.1152/jn.1998.80.6.3247. [DOI] [PubMed] [Google Scholar]
- Siebner HR, Rothwell JC. Transcranial magnetic stimulation: new insights into representational cortical plasticity. Exp Brain Res. 2003;148:1–16. doi: 10.1007/s00221-002-1234-2. 10.1007/s00221-002-1234-2. [DOI] [PubMed] [Google Scholar]
- Similowski T, Duguet A, Straus C, Attali V, Boisteanu D, Derenne JP. Assessment of the voluntary activation of the diaphragm using cervical and cortical magnetic stimulation. Eur Respir J. 1996a;9:1224–1231. doi: 10.1183/09031936.96.09061224. 10.1183/09031936.96.09061224. [DOI] [PubMed] [Google Scholar]
- Similowski T, Straus C, Coic L, Derenne JP. Facilitation-independent response of the diaphragm to cortical magnetic stimulation. Am J Respir Crit Care Med. 1996b;154:1771–1777. doi: 10.1164/ajrccm.154.6.8970369. [DOI] [PubMed] [Google Scholar]
- Singh KD, Hamdy S, Aziz Q, Thompson DG. Topographic mapping of trans-cranial magnetic stimulation data on surface rendered MR images of the brain. Electroencephalogr Clin Neurophysiol. 1997;105:345–351. doi: 10.1016/s0924-980x(97)96699-6. 10.1016/S0924-980X(97)96699-6. [DOI] [PubMed] [Google Scholar]
- Talairach J, Szikla G, Tournoux P, Prosalentis A, Bordas-Ferrier M. Atlas d'Anatomie Stéréotaxique Du Téléencéphale. Paris: Masson; 1967. [Google Scholar]
- Tanji J, Shima K. Role for supplementary motor area cells in planning several movements ahead. Nature. 1994;371:413–416. doi: 10.1038/371413a0. [DOI] [PubMed] [Google Scholar]
- Taylor JL, Butler JE, Allen GM, Gandevia SC. Changes in motor cortical excitability during human muscle fatigue. J Physiol. 1996;490:519–528. doi: 10.1113/jphysiol.1996.sp021163. [DOI] [PMC free article] [PubMed] [Google Scholar]
- Trompetto C, Assini A, Buccolieri A, Marchese R, Abbruzzese G. Intracortical inhibition after paired transcranial magnetic stimulation depends on the current flow direction. Clin Neurophysiol. 1999;110:1106–1110. doi: 10.1016/s1388-2457(99)00043-7. [DOI] [PubMed] [Google Scholar]
- Verin E, Straus C, Demoule A, Mialon P, Derenne JP, Similowski T. Validation of improved recording site to measure phrenic conduction from surface electrodes in humans. J Appl Physiol. 2002;92:967–974. doi: 10.1152/japplphysiol.00652.2001. [DOI] [PubMed] [Google Scholar]
- Verin E, Ross E, Demoule A, Hopkinson N, Nickol A, Fauroux B, Moxham J, Similowski T, Polkey MI. Effects of exhaustive incremental treadmill exercise on diaphragm and quadriceps motor potentials evoked by transcranial magnetic stimulation. J Appl Physiol. 2004;96:253–259. doi: 10.1152/japplphysiol.00325.2003. [DOI] [PubMed] [Google Scholar]
- Verwey WB, Lammens R, van Honk J. On the role of the SMA in the discrete sequence production task: a TMS study. Transcranial Magnetic Stimulation. Neuropsychologia. 2002;40:1268–1276. doi: 10.1016/s0028-3932(01)00221-4. [DOI] [PubMed] [Google Scholar]
- Wassermann EM, Wang B, Zeffiro TA, Sadato N, Pascual-Leone A, Toro C, Hallett M. Locating the motor cortex on the MRI with transcranial magnetic stimulation and PET. Neuroimage. 1996;3:1–9. doi: 10.1006/nimg.1996.0001. [DOI] [PubMed] [Google Scholar]
- Woosley CN, Settlage PH, Meyer DR, Sencer W, Hamuy TP, Travis AM. Patterns of localization in precentral and ‘supplementary’ motor areas and their relation to the concept of a premotor area. Res Publ Assoc Res Nerv Ment Dis. 1952;30:238–264. [PubMed] [Google Scholar]
- Wu CW-H, Bichot NP, Kaas JH. Converging evidence from microstimulation, architecture, and connections for multiple motor areas in the frontal and cingulate cortex of prosimian primates. J Comp Neurol. 2000;423:140–177. doi: 10.1002/1096-9861(20000717)423:1<140::aid-cne12>3.0.co;2-3. [DOI] [PubMed] [Google Scholar]
- Zifko U, Remtulla H, Power K, Harker L, Bolton CF. Transcortical and cervical magnetic stimulation with recording of the diaphragm. Muscle Nerve. 1996;19:614–620. doi: 10.1002/(SICI)1097-4598(199605)19:5<614::AID-MUS9>3.0.CO;2-E. [DOI] [PubMed] [Google Scholar]


