

Abstract
Cortex and muscle show coupled oscillations in the 15–35 Hz frequency band during voluntary movements. To obtain evidence of the neuronal network responsible for this rhythmicity we investigated the effect of transcranial magnetic stimulation (TMS) and peripheral nerve stimulation on the coupling between eletcroencephalographic (EEG) activity recorded from the scalp over the motor cortex and electromyographic (EMG) activity recorded from the tibialis anterior (TA) muscle in 15 healthy human subjects. TMS over the leg area at intensities between 0.95 and 1.1 × threshold for a motor evoked potential (MEP) in the TA increased corticomuscular coherence in the 15–35 Hz frequency band. This effect lasted on average for 300 ms, but could last up to 600–800 ms in some subjects. Stimulation of motor nerves from the ankle muscles suppressed corticomuscular coherence in the 15–35 Hz frequency range between leg area EEG and TA EMG for a period up to 600–800 ms. In addition, increased coherence around 10 Hz was observed for a period up to 250 ms after the stimulation. Stimulation of motor nerves in the arm and motor nerves from the ankle muscles in the other leg had no effect. The findings indicate that TMS has direct access to the neuronal circuitry in the motor cortex, which generates the corticomuscular coherence. This effect was caused either by direct activation of corticospinal cells or by activation of local neuronal circuitries in the motor cortex. The effects of peripheral nerve stimulation suggest that an alternative rhythm generator may entrain the cortical cells into a lower 10 Hz rhythm and disrupt the 15–35 Hz rhythm.
Active muscles show rhythmic components in frequency bands around 10 Hz and 20 Hz (McAuley et al. 1997; Hansen et al. 2002). These rhythms reflect the activity of the neuronal structures involved in driving the spinal motoneurones (Farmer et al. 1993; McAuley et al. 1997; Farmer, 1998; Hansen et al. 2002; Nielsen et al. 2002) and suggest that two different input systems may dominate the rhythmic behaviour of motor units. Recent data have demonstrated that the higher frequency component is probably caused by a rhythm generating network involving, or with direct access to, the corticospinal tract cells. Neuronal activity recorded from the sensorimotor cortex is thus dominated by oscillations in the beta or 14–40 Hz frequency band (Murthy & Fetz, 1992, 1996; Conway et al. 1995; Salenius et al. 1997a). Coherence analysis has revealed that some of these oscillations are transmitted, probably via the pyramidal tract, to the active muscles and may entrain them into the same rhythmicity (Conway et al. 1995; Salenius et al. 1997a,b). Jackson et al. (2002) demonstrated that stimulation of the pyramidal tract in the monkey could cause a resetting of the cortical beta rhythmicity and argued that pyramidal tract cells were a part of the rhythm-generating network. Similar effects on the cortical beta rhythmicity have also been described in human subjects following transcranial magnetic stimulation (TMS; Paus et al. 2001) and Mills & Schubert (1995) demonstrated that TMS could increase coherence between two single motor units in the beta band.
The mechanisms involved in generation of the lower 10 Hz frequency component are unclear, but most recent studies suggest a central mechanism, possibly involving a cerebellar–thalamic–cortical circuitry (McAuley et al. 1997; Marsden et al. 2000). Most studies have been unable to demonstrate significant coherence between cortex and muscle in the alpha band and it is therefore still not clarified to what extent the motor cortex is involved in transmission of this rythmicity to the muscles (Conway et al. 1995; Salenius et al. 1997a; Brown, 2000; Raethjen et al. 2002).
The purpose of the present study was to investigate further which networks may be involved in the generation of the muscle rhythms. The experimental protocol was based on the observation that activation of a component of a rhythm-generating network will interrupt the oscillatory cycle, and thereby modify the rhythm (Perkel et al. 1964; see also Conway et al. 1987; Britton et al. 1992). Activation of excitatory and inhibitory inputs to the rhythm-generating network responsible for corticomuscular coherence would therefore be expected to reset the rhythmicity and increase or decrease the coherence.
Coherence was measured between EEG recordings from the cortical leg area and tibialis anterior EMG recordings during tonic dorsiflexion. Leg muscular and cutaneous nerve afferents were stimulated electrically and cortex was stimulated by TMS. Thus, both afferents and centrally located structures within the motor system were investigated. Changes in corticomuscular coherence following activation of these structures might provide useful insight into the networks responsible for the coherence.
Methods
General experimental arrangement
The experiments were performed on 15 healthy subjects (8 women and 7 men), aged 20–47 years. All subjects gave informed written consent to the experimental procedure, which was approved by the local ethics committee. All experiments were conducted according to the Helsinki declaration.
Subjects were seated in an armchair with their right foot attached to a foot plate. The right hip and knee were flexed to a position that was comfortable for the subject. During all experiments the subject performed a tonic dorsiflexion at approximately 20% of maximal contraction force. In most experiments, the subject watched the rectified TA EMG on an oscilloscope, in order to achieve a constant contraction level. Figure 1 gives an overview of the different stimulations.
Figure 1. Experimental arrangement.

Electroencephalographic activity (EEG) was recorded from the scalp over the leg area of the motor cortex. Electromyographic activity (EMG) was recorded by surface electrodes over the tibialis anterior muscle (TA). Coherence and cumulant density functions were calculated for paired EEG and EMG recordings during tonic dorsiflexion before and after transcranial magnetic stimulation (TMS) or peripheral nerve stimulation. Electrical stimuli were applied to the common peroneal nerve (PN), the posterior tibial nerve (PTN) the sural nerve and the median nerve (not shown).
Stimulation conditions
The following nerves were stimulated electrically during tonic dorsiflexion of the ankle: the ipsilateral common peroneal nerve (CPN); the ipsilateral tibial nerve (TN); the ipsilateral sural nerve (SN); the contralateral CPN; and the ipsilateral median nerve (MN). All stimulations consisted of a single shock with a duration of 1 ms.
CPN was stimulated through small (diameter, 0.5 cm) bipolar surface electrodes placed with a distance of 2 cm right distal to the collum fibulae. The exact position of the electrodes was adjusted so that the threshold for a palpable response in TA was lower than the corresponding threshold for the peroneal muscle group. The stimulation intensity was approximately 1.1 times the threshold for a palpable response in TA. In four experiments, the intensity was varied from just below the threshold for a visible H-reflex in the averaged TA EMG to 1.4 times threshold for a palpable response.
For stimulation of the TN a monopolar electrode was placed in the popliteal fossa. The indifferent electrode was placed just above the patella. The stimulation intensity was just above the threshold for a visible H-reflex in the soleus muscle.
SN was stimulated through the same kind of electrodes as for CPN. The electrodes were placed 2 cm apart, behind the lateral malleole. The stimulation intensity was adjusted to 2.5 times the intensity at which the subject reported a radiating sensation along the lateral side of the foot.
MN was stimulated through a bipolar electrode placed just above the cubital fossa on the medial aspect of the arm. The stimulus intensity was just above the threshold for a visible H-reflex in the wrist flexors.
In all experiments, stimulation of several nerves was examined in the same run. The different stimulations were randomized with trials without stimulation. There was at least 2 s between each stimulation. Each nerve was stimulated at least 100 times in each run.
Transcranial magnetic stimulation
Magnetic stimulation was applied over the contralateral (left) motor cortex during tonic dorsiflexion. The magnetic stimulator was a MagStim 200, and the coil was a prototype of the figure-of-eight double cone coil. In the beginning of each experiment the coil position was adjusted to find the best location for TA activation. This was in most cases 0–2 cm lateral to the vertex. In each subject several experimental runs were performed with a minimum of 100 stimulations each. Stimulus intensities ranged from just below to well above the threshold for a facilitation of the motoneurone pool. There was at least 2 s between each stimulation. At least 100 stimuli were applied in each experimental run. The stimuli were randomized with trials without stimulation and there was at least 3 s between each stimulus.
EMG recordings
EMG activity was recorded from the TA muscle during all experiments. The recording electrodes were bipolar, non-polarizable Ag–AgCl disc electrodes (1 cm2, 1 cm distance between poles). The signals were amplified (2000–5000 times), band-pass filtered (5–1000 Hz) and stored as waveforms on a computer for later analysis.
EEG recordings
In all experiments EEG activity was recorded through a pair of disposable EEG needle electrodes. One electrode was placed at the vertex and the other one 2 cm frontal to vertex. The signal was amplified (50 000 times), filtered (1–1000 Hz) and stored on a computer for later analysis.
Analysis
The EMGs were rectified. Stimulus-triggered averages of EEGs and rectified EMGs were constructed in a time window of –300 ms to +1200 ms with respect to each type of stimulation. It was checked that all peripheral stimuli were followed by a sensory evoked potential (SEP) in the averaged EEG.
The raw EEG and EMG signals were used for construction of power and coherence spectra as well as cross-correlation in the time domain. In all cases the EEG was used as the reference signal. The power spectrum of a signal gives an estimate of the magnitude of each frequency component in the signal. The coherence spectrum between two signals gives an estimate of the magnitude of correlation (or coupling) between specific frequency components in the two signals. That is, significant coherence in a given frequency area would suggest the presence of a rhythmic component at that frequency in both signals, arising from the same source or process. The mathematical and statistical calculations leading to construction of power and coherence spectra are described in detail by Halliday et al. (1995) and have been implemented in MATLAB. The present data (EEG, and EMG after being full-wave rectified) are assumed to be a realization of a zero mean time series (Halliday et al. 1998). Power spectra are estimated using a periodogram approach, where the discrete Fourier transform is constructed from short sections of data taken at a fixed offset time with respect to a trigger point (TMS or peripheral nerve stimulation). Estimates of the spectra are constructed by averaging periodograms from each of the applied stimuli. A segment length of 200 ms at fixed time intervals following the stimulations was used for the present data. To ensure that the presence of a Hoffmann reflex (latency usually ∼30 ms), an MEP (latency usually ∼35–40 ms), or the last part of the stimulation artefact in the TA EMG would not influence the coherence spectrum the earliest offset time after any stimulus was 50 ms.
We use fxx (λ) and fyy (λ) to represent the power spectra of processes x and y, respectively. The cross spectrum between x and y is denoted by fxy (λ), and is estimated in a similar manner to the auto spectra.
In the frequency domain, the correlation between the EEG and EMG signals is assessed through coherence functions (Brillinger, 1981; Halliday et al. 1995). The coherence function between the two signals is defined at frequency λ as
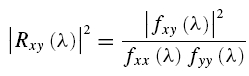 |
Coherence functions provide normative measures of linear association on a scale from 0 to 1. For the present data, the coherence provides a measure, at each Fourier frequency λ, of the fraction of the activity in the EMG signal which can be predicted by the activity in the EEG signal. In this way, the coherence is used to quantify the strength and frequency of common rhythmic components in the two signals (Conway et al. 1995).
In the time domain, estimates of the cumulant density function are used to characterize the correlation between the two signals. The cumulant density function, denoted by qxy(u), is defined as the inverse Fourier transform of the cross spectrum
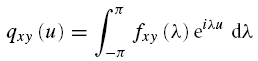 |
For two uncorrelated signals the cumulant has an expected value of zero, deviations from this indicate a correlation between the two signals at a particular time lag, u. Cumulant density functions are analogous to cross correlation functions often used to quantify spike train data, and have a similar interpretation (Halliday et al. 1995).
To summarize the correlation structure across subjects, estimates of pooled coherence and pooled cumulant density functions are used. Pooled coherence and cumulant functions provide a single measure, which summarizes the correlation structure across several data sets (Amjad et al. 1997). Pooled coherence estimates, like individual coherence estimates, provide a normative measure of linear association on a scale from 0 to 1 (Halliday & Rosenberg, 2000). Pooled cumulant density estimates provide a measure of time domain correlation across subjects. The interpretation of pooled estimates is similar to those for individual records, except any inferences relate to the population as a whole. In the pooled case, the time-dependent aspect of the analysis, using short segments at varying offset times relative to the stimulation (TMS or peripheral nerve stimulation), provides a measure of how the correlation structure across subjects changes (in an average sense) following the stimuli.
The spectra and cumulant density functions following stimulation were compared to spectra and functions constructed for a 200 ms period 300 ms prior to the stimulations.
Results
Transcranial magnetic stimulation (TMS)
The effect of TMS at an intensity of 1.1 × MEP threshold on corticomuscular coupling is shown for a single subject in Fig. 2. This subject showed coherence around 20 Hz between EEG and EMG recorded from the TA muscle during tonic dorsiflexion in the control situation without any stimulation (Fig. 2C–G; red line). In the cumulant density function significant coupling was also observed with the largest negative peak at a lag of around 25 ms (Fig. 2H–L; red line), which is only slightly shorter than the latency of the TA MEP (28 ms) evoked by TMS in this subject (Fig. 2B).
Figure 2. Effect of TMS on corticomuscular coupling in a single subject.

EEG was measured by electrodes placed over the leg area of the motor cortex (A). EMG was measured by surface electrodes placed over the TA muscle (B). The EEG and rectified TA EMG were averaged (n = 100) for a 1200 ms period starting 100 ms before the application of TMS. Coherence (C–G) and cumulant density estimates (H–L) were calculated for five 200 ms intervals starting 50 ms after TMS. For comparison the coherence and cumulant estimates for the 200 ms time window starting 300 ms prior to stimulation are shown as dashed (red) lines in each of the graphs.
In this subject TMS evoked a rhythmic modulation of activity in the averaged TA EMG activity (n = 100) following the initial MEP lasting until around 400 ms after the stimulus (Fig. 2B). Within the initial 250 ms after the stimulus, an evoked waveform with roughly similar lags was also observed in the EEG (Fig. 2A). Associated with these activity changes an increased coupling between cortex and muscle was seen (Fig. 2C–L), as evidenced by increasing coherence in the beta range for up to 650 s after the stimulus (Fig. 2C–G; black line) accompanied by increased size of the peaks in the cumulant density function (Fig. 2H–L; black line).
Increased corticomuscular coherence in the frequency band around 20 Hz was observed in nine of the 12 subjects for the initial 200 ms segment (i.e. 50–250 ms interval) following TMS at 1.1 × MEP threshold. In one subject, corticomuscular coherence around 30 Hz was observed during dorsiflexion without TMS. Following TMS, this 30 Hz coherence was depressed and replaced by coherence around 20 Hz. In two subjects the increase in coherence at 20 Hz persisted for up to 800 ms as depicted in Fig. 2. In the other subjects there was no clear increase of coherence following TMS at intervals longer than 400 ms. This is also evident from the pooled coherence from all 12 subjects shown in Fig. 3. A clear increase in the 20 Hz coherence accompanied by enhanced peaks in the cumulant density function was observed for the first 200 ms segment after the stimulus (Fig. 3C–J) as compared to the control recording 300 ms prior to the stimulus (Fig. 3A and B). However, for the subsequent 200 ms segment (250–450 ms), no clear increase in either coherence or the cumulant density function was observed (Fig. 3K and L).
Figure 3. Effect of TMS on corticomuscular coupling.

Pooled data from all 12 subjects in whom TMS was investigated. Coherence (A, C, E, G, I and K) and cumulant density estimates (B, D, F, H and L) were pooled from all subjects for the following intervals in relation to TMS: 300–100 ms before TMS (A and B), 50–250 ms after TMS (C and D), 100–300 ms after TMS (E and F), 150–350 ms after TMS (G and H), 200–400 ms after TMS (I and J) and 250–450 ms after TMS (K and L). In all subjects 100 stimuli were applied.
The effect of changing the stimulus intensity on the corticomuscular coherence was investigated in five of the subjects. Data from one of these subjects are shown in Fig. 4. In all cases coherence was calculated for the 200 ms segment starting at 50 ms after the stimulus and compared to the coherence calculated for a 200 ms segment starting 300 ms prior to the stimulus (dashed red line in Fig. 4B). At an intensity of 47% TMS induced a very small MEP followed by a weak depression of the TA EMG activity at an interval of 35 ms (Fig. 4A; 47% of stimulator output) and increased the corticomuscular coherence around 20 Hz slightly (Fig. 4B; 47% of stimulator output). With stronger stimulus intensities the MEP and the corticomuscular coherence around 20 Hz both increased in size. At intensities higher than 65% of the maximal stimulator output a second peak of coherence was induced. This peak had an onset around 10 Hz and a maximum around 15 Hz.
Figure 4. Effect of different TMS intensities on corticomuscular coupling in a single subject.

TMS was applied at increasing stimulus intensity from 47% to 75% of maximal stimulator output. The left column of plots (A) shows the average (n = 100) of the rectified TA EMG activity for a time window of 400 ms starting 100 ms prior to TMS. The time calibration bar to the right of the plots also marks the baseline for the plots. The right column of graphs (B) shows the coherence between EEG and TA EMG activity for the 200 ms time window starting 50 ms after TMS. For comparison the coherence is shown for the 200 ms window starting 300 ms prior to TMS (dashed red lines).
Essentially similar findings were observed in the other four subjects. In all of them no clear increase in coherence was observed when the intensity of TMS was below MEP threshold and in all of them a second peak of coherence around 10–15 Hz was induced when the intensity of TMS was increased to more than 1.2 × MEP threshold. In three of the subjects the coherence around 20 Hz decreased and disappeared at the intensities where the lower frequency coherence peak was induced.
Peripheral nerve stimulation
Stimulation of the peroneal nerve (CPN) in many ways had the opposite effect of TMS on the corticomuscular coherence. This is illustrated by data from a single subject in Fig. 5 and the compiled data from all nine investigated subjects in Fig. 6A. The CPN stimulation induced a small M-response and an H-reflex in the TA EMG (Fig. 5B) as well as a somatosensory evoked potential (SSEP) in the EEG (Fig. 5A). In the illustrated subject, a peak of coherence between EEG and TA EMG was observed around 20 Hz for trials without stimulation (Fig. 5C–G; dashed red line). In the cumulant density function a clear negative peak was also observed at a latency of around 25 ms (Fig. 5H–L; dashed red line). Following CPN stimulation the 20 Hz coherence was completely depressed for up to 450 ms and in place of this a peak of coherence with a maximum around 10 Hz was induced within the initial 250 ms after the stimulation (Fig. 5C–G; continuous black line). Corresponding to the 10 Hz coherence peak, a negative wave at a lag around 100 ms was observed in the cumulant density function (Fig. 5H; continuous black line).
Figure 5. Effect of CPN stimulation on corticomuscular coherence in a single subject.

A and B, show the averaged (n = 100) EEG and TA EMG activity following CPN stimulation. C–G, show the coherence and H–L the cumulant density estimate for five 200 ms time windows starting 50 ms after the CPN stimulation: C and H, 50–250 ms; D and I, 250–450 ms; E and J, 450–650 ms; F and K, 650–850 ms; G and L, 850–1050 ms after stimulation. The dashed red lines in C–L show the coherence and cumulant density function calculated for a 200 ms segment 300 ms prior to stimulation.
Figure 6. Changes in corticomuscular coherence following stimulation of different peripheral nerves.

In A stimulation was applied to the common peroneal nerve (CPN), in B to the tibial nerve (TN), in C to the contralateral CPN, in D to the median nerve (MN) and in E to the cutaneous sural nerve (SN). The coherence was calculated in each subject for 200 ms segments starting at –300 ms (first column of graphs), 50 ms (2nd column), 250 ms (third column), 450 ms (fourth column) and 650 ms (fifth column) after the stimuli. In all cases single stimuli of 1 ms duration were applied; 100 stimuli were applied. The y-axis calibration for the graphs is given in the right lower corner of the figure.
Of the nine subjects, two showed depression of 15–35 Hz coherence up to 650 ms, four up to 450 ms and two up to 250 ms. In one subject no coherence was observed prior to the stimulation. In all subjects a coherence peak around 10 Hz (range, 5–15 Hz) was induced in the initial 50–250 ms time window after the stimulation. However, the exact frequency at which this peak was observed varied between the subjects and pooling of the data was therefore not possible. Instead, data from all nine individual subjects are shown in Fig. 6A.
In experiments on four subjects, the stimulus intensity was varied (in steps of 0.1) from 0.7 to 1.4 times the threshold for a palpable response in the TA muscle. Both the depression of background coherence and the induction of 5–15 Hz coherence was seen at all stimulus intensities above the threshold for the TA H-reflex, but not below this threshold. A SSEP was evoked in the EEG at around the intensity required for evoking an H-reflex. No relationship between stimulus intensity and the duration or magnitude of the effects was found.
In two subjects, the electrodes were placed at the lateral side of the knee, without stimulating the CPN nerve. Stimulus intensity was increased well above the intensity used when stimulating the CPN. This had no effect on the EEG:EMG coherence spectrum.
The effects of stimulation of the tibial nerve (TN) on corticomuscular coherence were quite similar to the effects of CPN stimulation (Fig. 6B). In contrast, stimulation of the contralateral CPN and the median nerve (MN) had no effect on the coherence between cortical activity and the TA muscle activity (Fig. 6C and D). Stimulation of the cutaneous sural nerve at the ankle decreased the 15–35 Hz EEG:EMG coherence in six out of nine subjects (Fig. 6E), but this depression was both shorter lasting and less pronounced than after stimulation of CPN and TN. In only one of the nine subjects was a coherence peak in the 5–15 Hz band induced by SN stimulation.
Discussion
The present study has demonstrated that TMS and peripheral nerve stimulation have very different effects on corticomuscular coherence. Transcranial magnetic stimulation generally caused an increase of 15–25 Hz coherence, whereas stimulation of the muscle nerves supplying the muscle and its antagonist at intensities above that required for eliciting an H-reflex and/or a SSEP interrupted the background 15–35 Hz coherence for up to 650 ms. Furthermore, for up to 250 ms following stimulation of muscular afferents from the same extremity, a pronounced 5–15 Hz coherence was present.
Changes in coherence induced by TMS
The increase of corticomuscular coherence evoked by TMS is consistent with the observations by Paus et al. (2001), who demonstrated increased EEG activity in the beta band following TMS and by Mills & Schubert (1995) who demonstrated that coherence between two motor unit recordings increased following TMS. Our data provide a link between these two observations and show that TMS facilitates the oscillatory activity in the corticospinal tract cells, which entrain the spinal motoneurones into the same rhythmicity. In most of our subjects the effect of TMS is most easily interpreted as a resetting of the ongoing corticospinal rhythmicity (Perkel et al. 1964; Conway et al. 1987; Britton et al. 1992; Jackson et al. 2002). When the stimulus intensity was around MEP threshold, we only observed in a single subject that the ongoing rhythmicity was interrupted and replaced by coherence at a different frequency. In the other subjects the effect of TMS around MEP threshold was rather to enhance the already existing coherence, which is what would be expected if TMS had a resetting effect on the network responsible for the generation of the coherence.
However, we cannot exclude the possibility that the effect of TMS may simply be to induce 15–35 Hz oscillations in the neuronal population underlying the stimulation site independently of spontaneous activity in that or neighbouring areas. These oscillations might shortly overcome the ongoing rhythmic activity or the two rhythms might be seen at the same time. In case of major overlapping between the frequency bands of the two rhythms, the observed effect would be an increase in the spontaneous rhythmic activity.
In either case, our data demonstrate that TMS may entrain corticospinal cells into a rhythmic activity around 20 Hz, which is sufficiently strong to be reflected also in the muscular activity. This may be caused either by a direct effect of TMS on the corticospinal tract cells or a more indirect effect via local cortical cells projecting onto the corticospinal cells (Kujirai et al. 1993; Di Lazzaro et al. 1998, 2001). The fact that the effect of TMS on corticomuscular coherence was only observed when the intensity of TMS was above MEP threshold, favours the first possibility. At such intensities TMS of the leg area in all likelihood mainly activates the corticospinal tract cells directly (Nielsen et al. 1995; Di Lazzaro et al. 2001). That activation of corticospinal cells is necessary for resetting to occur would be in line with the conclusion reached by Jackson et al. (2002). They observed that electrical stimulation of the corticospinal tract in the pyramids in the monkey could reset the activity of the corticospinal cells and enhance the cortical activity in the beta frequency band. However, in our subjects the threshold of inhibitory effects on the corticospinal cells, as judged from the depression of EMG activity (Fig. 4), was very close to the MEP threshold, which makes it difficult to dissociate an effect on the local inhibitory connections from an effect directly on the corticospinal tract cells. Activation of inhibitory connections has indeed been demonstrated to be of importance for resetting of oscillatory activity in models of oscillating networks (Pauluis et al. 1999; Whittington et al. 2000). In any case our data support the conclusion by Jackson et al. (2002) that the corticospinal tract cells are a part of the network, which generates the beta rhythm recorded over the primary motor cortex.
In the one subject, in whom TMS at MEP threshold interrupted the ongoing rhythmicity, coherence was seen at a higher frequency (30 Hz) before the stimulus than in the other subjects, but after TMS the induced coherence was seen at 20 Hz as in the other subjects. This suggests that rhythmicity at 30 Hz and 20 Hz may be generated by different networks and/or network properties and that important information may be lost when pooling data from the whole beta band together. At intensities above MEP threshold, TMS disturbed coherence around 20 Hz in all subjects and induced coherence at a lower frequency (i.e. around 15–20 Hz). The mechanism behind this is puzzling, but it further confirms that multiple oscillators with frequencies in the beta band are present in the cortex and are accessible by TMS.
Coherence at 5–15 Hz induced by peripheral stimulation
Coherence at 5–15 Hz is only occasionally seen between cortex and muscle in healthy subjects during tonic contraction (Brown, 2000; Raethjen et al. 2002). In the present study none of the subjects had background coherence within this frequency band. The induction of the 5–15 Hz coherence peaks following muscular afferent stimulation was therefore an unexpected finding. It suggests that some process, providing a rhythmic input to the sources of both signals (establishing a coupling between them) has been activated, facilitated or modulated by the stimulus. Three different hypotheses about the nature of this process may be suggested.
The highly synchronized input to the TA motoneurone pool that the stimulation provides, may – by some spinal mechanism – cause a transient periodic discharge of motoneurones. The mechanism might simply be a resetting of TA motoneurones. Because most motoneurones have similar spontaneous firing frequencies (usually 6–8 Hz), this synchronization will persist for some time before it fades away, which will be detected as oscillations. In the case of CPN stimulation, the factor forcing the synchronization of motoneurone activity is likely to be the widespread excitatory postsynaptic potential in the motoneurone pool giving rise to the Hoffmann reflex in the EMG. At the cortical level, the stimulus might evoke postsynaptic events with a frequency similar to the one active at the spinal level. Dinse et al. (1997) described rhythmic firings at 8–20 Hz in rat somatosensory cortical cells following sensory stimulation and speculate that these might be a cellular substrate of the SSEP in the human EEG. If events in somatosensory cortex and the spinal motoneurone pool, both directly evoked by the stimulus, provide signal components with overlapping frequencies, both would be coupled to the stimulus time and therefore also to each other in that particular frequency band. The effect of TN stimulation could be explained by a similar mechanism at the cortical level and the synchronizing effect of a dominant inhibitory effect at the spinal motoneuronal level (i.e. reciprocal inhibition).
Following a stretch of the TA muscle, three bursts of activity in the muscle are seen at latencies of approximately 45, 70 and 95 ms (Petersen et al. 1998). The earliest and the latest of these bursts depend on Ia activation, and it has been shown that the latest reflex burst is likely to be mediated partly by a transcortical pathway (Petersen et al. 1998). It can be speculated that electrical stimulation of CPN, at intensities which preferentially activates Ia afferents, likewise induces a reflex response with a transcortical component. This would cause a transient coupling between cortex and muscle as observed in the present study. Cheney & Fetz (1984) demonstrated that a reflex response mediated partly by a transcortical pathway may be elicited by activation of Ia afferents in the same muscle, but also by Ia activation from the antagonist. This might explain why TN stimulation induces a coupling between cortex and TA very similar to the one induced by CPN stimulation.
Several studies have suggested that a central mechanism is involved in generating the 5–15 Hz periodicities in the EMG and limb acceleration, which are observed especially during slow finger movements and which are also characteristic of many forms of tremor (Vallbo & Wessberg, 1993; Wessberg & Vallbo, 1996; McAuley et al. 1997; Raethjen et al. 2002). There is good evidence to suggest that cerebellar nuclei are involved in generating this rythmicity, possibly as part of a thalamo-cortical-cerebellar rhythm-generating network (Marsden et al. 2000). A possible explanation for the induction of a 5–15 Hz peak following peripheral nerve stimulation in the present study is that sensory afferents have access to this network either through projections to the thalamus or the cerebellum. It is not possible from the present data to favour either of these mechanisms.
Cutaneous stimulation produced a 5–15 Hz coherence peak in a single subject only. A possible explanation of this is that a single stimulus lasting 1 ms as for the muscle nerve stimulation was used. Generally, trains of three or more stimuli are necessary to evoke distinct cutaneous reflex responses in the TA muscle, including the long-latency responses, which in all likelihood are caused by a transcortical reflex pathway (Nielsen et al. 1997). Similarly, the single stimulus may be insufficient to influence a possible central rhythm-generating network. In either case the observations suggest that cutaneous input differs from muscle afferent input in its ability to modulate the networks responsible for corticomuscular coherence.
Depression of 15–35 Hz coherence following peripheral stimulation
Changes in 15–35 Hz rhythms in cortical activity during and after limb movement or stimulation has been described in detail in several studies (e.g. Neuper & Pfurtscheller, 1996; Salenius et al. 1997b; Neuper & Pfurtscheller, 2001b, reviewed by Neuper & Pfurtscheller, 2001a). During movement, 15–35 Hz oscillations recorded from somatosensory cortex are reduced (event-related desynchronization, ERD) and thereafter (that is, during or after the movement) they return and are larger than before (event-related synchronization, ERS). This pattern is also seen following peripheral nerve stimulation and tactile stimulation, and even during imagination of a movement, the exact time course being dependent on the condition. Stimulation of TN has been shown to elicit an ERD (in EEG recorded at vertex) lasting on average 400 ms (Neuper & Pfurtscheller, 2001b). This is similar to the time course of the depression of the 15–35 Hz corticomuscular coherence observed in the present study following stimulation of leg muscle afferents and it suggests that the two phenomena may reflect similar mechanisms. However, it is important to keep in mind that the cortical 15–35 Hz rhythm is probably not exclusively the same as the cortical ‘part’ of the 15–35 Hz corticomuscular coherence. It might very well contain several components, of which maybe only a minor part is coherent with muscle activity. Whatever the mechanism, the depression of the ongoing corticomuscular coherence during tonic muscle contraction by peripheral nerve stimulation suggests that the decrease – or disappearance – of 15–35 Hz coherence usually observed during dynamic contractions (Feige et al. 2000) can be at least partly accounted for by the sensory feedback elicited by the limb movement.
The depression of 15–35 Hz corticomuscular coherence by peripheral nerve stimulation might also be taken to suggest that coherence in that frequency band would be enhanced in subjects in whom sensory input is lacking (deafferented subjects). This could be taken to imply that our data are at variance with a recent study by Kilner et al. (2004), which showed reduced rather than enhanced coherence around 20 Hz between two finger muscles during a grip task. However, there are many reasons why a direct comparison of the data in our study and in the study by Kilner et al. (2004) is not straightforward. The investigated tasks were very different, Kilner et al. (2004) investigated inter-muscle coherence rather than corticomuscular coherence and the chronic loss of sensory input is likely to result in adaptive changes in the central nervous system, which makes a comparison to the effect of brief activation of the sensory system in intact subjects questionable. Furthermore, as corticomuscular coherence is quite variable in a population of subjects, it is difficult to evaluate whether observations in an individual subject reflect reduced, normal or enhanced coherence. Indeed, Farmer et al. (1993) reported 15–35 Hz coherence between pairs of single motor units in a deafferented patient and we have recently found significant corticomuscular coherence in the same deafferented patient as investigated by Kilner et al. (2004) (J.B. Nielsen, B. Conway & V. Marchand-Pauvert, unpublished observations).
Concluding remarks
Our data have demonstrated that it is possible to use artificial activation of inputs to the central rhythm-generating networks to analyse the connectivity and nature of these networks. The data illustrate that partly separate networks, which are differently influenced by sensory feedback, are involved in generating corticomuscular coherence in the alpha (5–15 Hz) and beta (15–35 Hz) bands. In the study by Hansen et al. (2002) it was shown that the network responsible for coherence in the beta band caused synchronous activation of antagonistic leg motoneurones, whereas the network responsible for coherence in the alpha band caused depression of antagonist motoneurones during agonist activation. Our data suggest that sensory input may facilitate the latter network and suppress the former. This may be of relevance in the coordination of muscle activity during movement, where it has been shown that alternating bursts of agonist and antagonist activity at a frequency of 10 Hz are involved (Wessberg & Vallbo, 1996). Our data suggest that sensory feedback is not involved in generating this rhythm, but may be involved in sustaining and modulating it, which is consistent with the findings by Wessberg & Vallbo (1996). One appealing possibility is that coherence in the two frequency bands may also reflect the fact that different central networks are involved to a different extent in the course of motor learning (Jenkins et al. 1994). When a new motor task is learned, sensory feedback plays a significant role and a loop involving the cerebellum, thalamus, pre-motor cortex and primary motor cortex seems to be mainly involved. This could be equivalent to the network responsible for generating coherence in the alpha band. When the task has been learned, sensory feedback mechanisms play a less significant role and the performance relies more on feedforward control and activity in a network involving the basal ganglia, the supplementary motor area and the primary motor cortex. This network could be similar to the network responsible for generating coherence in the beta band. If this is correct, a shift towards more significant corticomuscular coherence in the beta band would be predicted in the course of motor learning. This may be tested in future experiments.
Acknowledgments
We are grateful to Bernard Conway for reading and commenting on an early version of the manuscript. The study was supported by the Danish Society of Multiple Sclerosis, the Novo Nordisk Foundation and the Danish Health Research Council.
References
- Amjad AM, Halliday DM, Rosenberg JR, Conway BA. An extended difference of coherence test for comparing and combining several independent coherence estimates: theory and application to the study of motor units and physiological tremor. J Neurosci Meth. 1997;73:69–79. doi: 10.1016/s0165-0270(96)02214-5. 10.1016/S0165-0270(96)02214-5. [DOI] [PubMed] [Google Scholar]
- Brillinger DR. Time Series – Data Analysis and Theory. 2. San Francisco: Holden Day; 1981. [Google Scholar]
- Britton TC, Thompson PD, Day BL, Rothwell JC, Findley LJ, Marsden CD. ‘Resetting’ of postural tremors at the wrist with mechanical stretches in Parkinson's disease, essential tremor, and normal subjects mimicking tremor. Ann Neurol. 1992;31:507–514. doi: 10.1002/ana.410310508. [DOI] [PubMed] [Google Scholar]
- Brown P. Cortical drives to human muscle: the Piper and related rhythms. Progr Neurobiol. 2000;60:97–108. doi: 10.1016/s0301-0082(99)00029-5. [DOI] [PubMed] [Google Scholar]
- Cheney PD, Fetz EE. Corticomotoneuronal cells contribute to long-latency stretch reflexes in the rhesus monkey. J Physiol. 1984;349:249–272. doi: 10.1113/jphysiol.1984.sp015155. [DOI] [PMC free article] [PubMed] [Google Scholar]
- Conway BA, Halliday DM, Farmer SF, Shahani U, Maas P, Weir AI, Rosenberg JR. Synchronization between motor cortex and spinal motoneuronal pool during the performance of a maintained motor task in man. J Physiol. 1995;489:917–924. doi: 10.1113/jphysiol.1995.sp021104. [DOI] [PMC free article] [PubMed] [Google Scholar]
- Conway BA, Hultborn H, Kiehn O. Proprioceptive input resets central locomotor rhythm in the spinal cat. Exp Brain Res. 1987;68:643–656. doi: 10.1007/BF00249807. [DOI] [PubMed] [Google Scholar]
- Di Lazzaro V, Oliviero A, Profice P, Meglio M, Cioni B, Tonali P, Rothwell JC. Descending spinal cord volleys evoked by transcranial magnetic and electrical stimulation of the motor cortex leg area in conscious humans. J Physiol. 2001;537:1047–1058. doi: 10.1111/j.1469-7793.2001.01047.x. [DOI] [PMC free article] [PubMed] [Google Scholar]
- Di Lazzaro V, Restuccia D, Oliviero A, Profice P, Ferrara L, Insola A, Mazzone P, Tonali P, Rothwell JC. Magnetic transcranial stimulation at intensities below active motor threshold activates intracortical inhibitory circuits. Exp Brain Res. 1998;199:265–268. doi: 10.1007/s002210050341. [DOI] [PubMed] [Google Scholar]
- Dinse HR, Kruger K, Akhaven AC, Spengler F, Schoner G, Schreiner CE. Low-frequency oscillations of visual, auditory and somatosensory cortical neurons evoked by sensory stimulation. Int J Psychophysiol. 1997;26:205–227. doi: 10.1016/s0167-8760(97)00765-4. [DOI] [PubMed] [Google Scholar]
- Farmer SF. Rhythmicity, synchronization and binding in human and primate motor systems. J Physiol. 1998;509:3–14. doi: 10.1111/j.1469-7793.1998.003bo.x. [DOI] [PMC free article] [PubMed] [Google Scholar]
- Farmer SF, Bremner FD, Halliday DM, Rosenberg JR, Stephens JA. The frequency content of common synaptic inputs to motoneurones studied during voluntary isometric contraction in man. J Physiol. 1993;470:127–155. doi: 10.1113/jphysiol.1993.sp019851. [DOI] [PMC free article] [PubMed] [Google Scholar]
- Feige B, Aertsen A, Kristeva-Feige R. Dynamic synchronization between multiple cortical motor areas and muscle activity in phasic voluntary movements. J Neurophysiol. 2000;84:2622–2629. doi: 10.1152/jn.2000.84.5.2622. [DOI] [PubMed] [Google Scholar]
- Halliday DM, Conway BA, Farmer SF, Rosenberg JR. Using electroencephalography to study functional coupling between cortical activity and electromyograms during voluntary contractions in humans. Neurosci Lett. 1998;241:5–8. doi: 10.1016/s0304-3940(97)00964-6. [DOI] [PubMed] [Google Scholar]
- Halliday DM, Rosenberg JR. On the application, estimation and interpretation of coherence and pooled coherence. J Neurosci Meth. 2000;100:173–174. doi: 10.1016/s0165-0270(00)00267-3. [DOI] [PubMed] [Google Scholar]
- Halliday DM, Rosenberg JR, Amjad AM, Breeze P, Conway BA, Farmer SF. A framework for the analysis of mixed time series/point process data – theory and application to the study of physiological tremor, single motor unit discharges and electromyograms. Progr Biophys Mol Biol. 1995;64:237–278. doi: 10.1016/s0079-6107(96)00009-0. [DOI] [PubMed] [Google Scholar]
- Hansen S, Hansen NL, Christensen LO, Petersen NT, Nielsen JB. Coupling of antagonistic ankle muscles during co-contraction in humans. Exp Brain Res. 2002;146:282–292. doi: 10.1007/s00221-002-1152-3. [DOI] [PubMed] [Google Scholar]
- Jackson A, Spinks RL, Freeman TC, Wolpert DM, Lemon RN. Rhythm generation in monkey motor cortex explored using pyramidal tract stimulation. J Physiol. 2002;541:685–699. doi: 10.1113/jphysiol.2001.015099. [DOI] [PMC free article] [PubMed] [Google Scholar]
- Jenkins IH, Brooks DJ, Nixon PD, Frackowiak RS, Passingham RE. Motor sequence learning: a study with positron emission tomography. J Neurosci. 1994;14:3775–3790. doi: 10.1523/JNEUROSCI.14-06-03775.1994. [DOI] [PMC free article] [PubMed] [Google Scholar]
- Kilner JM, Fisher RJ, Lemon RN. Coupling of oscillatory activity between muscles is strikingly reduced in a deafferented subject compared with normal controls. J Neurophysiol. 2004;92:790–796. doi: 10.1152/jn.01247.2003. [DOI] [PubMed] [Google Scholar]
- Kujirai T, Caramia MD, Rothwell JC, Day BL, Thompson PD, Ferbert A, Wroe S, Asselman P, Marsden CD. Corticocortical inhibition in human motor cortex. J Physiol. 1993;471:501–519. doi: 10.1113/jphysiol.1993.sp019912. [DOI] [PMC free article] [PubMed] [Google Scholar]
- McAuley JH, Rothwell JC, Marsden CD. Frequency peaks of tremor, muscle vibration and electromyographic activity at 10 Hz, 20 HZ and 40 Hz during human finger muscle contraction may reflect rhythmicities of central neural firing. Exp Brain Res. 1997;114:525–541. doi: 10.1007/pl00005662. [DOI] [PubMed] [Google Scholar]
- Marsden JF, Ashby P, Limousin-Dowsey P, Rothwell JC, Brown P. Coherence between cerebellar thalamus, cortex and muscle in man: cerebellar thalamus interactions. Brain. 2000;123:1459–1470. doi: 10.1093/brain/123.7.1459. [DOI] [PubMed] [Google Scholar]
- Mills KR, Schubert M. Short term synchronization of human motor units and their responses to transcranial magnetic stimulation. J Physiol. 1995;483:511–523. doi: 10.1113/jphysiol.1995.sp020602. [DOI] [PMC free article] [PubMed] [Google Scholar]
- Murthy VN, Fetz EE. Coherent 25-to-35-Hz oscillations in the sensorimoter cortex of awake behaving monkeys. Proc Natl Acad Sci USA. 1992;89:5670–5674. doi: 10.1073/pnas.89.12.5670. [DOI] [PMC free article] [PubMed] [Google Scholar]
- Murthy VN, Fetz EE. Oscillatory activity in sensorimoter cortex of awake monkeys: synchronization of local field potentials and relation to behaviour. J Neurophysiol. 1996;76:3949–3967. doi: 10.1152/jn.1996.76.6.3949. [DOI] [PubMed] [Google Scholar]
- Neuper C, Pfurtscheller G. Post-movement synchronization of beta rhythms in the EEG over the cortical foot area in man. Neurosci Lett. 1996;216:17–20. doi: 10.1016/0304-3940(96)12991-8. [DOI] [PubMed] [Google Scholar]
- Neuper C, Pfurtscheller G. Event-related dynamics of cortical rhythms; frequency-specific features and functional correlates. Int J Psychophysiol. 2001a;43:41–58. doi: 10.1016/s0167-8760(01)00178-7. [DOI] [PubMed] [Google Scholar]
- Neuper C, Pfurtscheller G. Evidence for distinct beta resonance frequencies in human EEG related to specific cortical areas. Clin Neurophysiol. 2001b;112:2084–2097. doi: 10.1016/s1388-2457(01)00661-7. [DOI] [PubMed] [Google Scholar]
- Nielsen J, Petersen N, Ballegaard M. Latency of effects evoked by electrical and magnetic brain stimulation in lower limb motoneurones in man. J Physiol. 1995;484:791–802. doi: 10.1113/jphysiol.1995.sp020704. [DOI] [PMC free article] [PubMed] [Google Scholar]
- Nielsen J, Petersen N, Fedirchuk B. Evidence suggesting a transcortical pathway from cutaneous foot afferents to tibialis anterior motoneurones in man. J Physiol. 1997;501:473–484. doi: 10.1111/j.1469-7793.1997.473bn.x. [DOI] [PMC free article] [PubMed] [Google Scholar]
- Nielsen JB, Tijssen MA, Hansen NL, Crone C, Petersen NT, Brown P, Van Dijk JG, Rothwell JC. Corticospinal transmission to leg motoneurones in human subjects with deficient glycinergic inhibition. J Physiol. 2002;544:631–640. doi: 10.1113/jphysiol.22.024091. [DOI] [PMC free article] [PubMed] [Google Scholar]
- Pauluis Q, Baker SN, Olivier E. Emergent oscillations in a realistic network: the role of inhibition and the effect of the spatiotemporal distribution of the input. J Comput Neurosci. 1999;6:289–310. [PubMed] [Google Scholar]
- Paus T, Sipila PK, Strafella AP. Synchronization of neuronal activity in the human primary motor cortex by transcranial magnetic stimulation: an EEG study. J Neurophysiol. 2001;86:1983–1990. doi: 10.1152/jn.2001.86.4.1983. [DOI] [PubMed] [Google Scholar]
- Perkel DH, Schulman JH, Bullock TH, Moore GP, Segundo JP. Pacemaker neurons: effects of regularly spaced synaptic input. Science. 1964;145:61–63. doi: 10.1126/science.145.3627.61. [DOI] [PubMed] [Google Scholar]
- Petersen N, Christensen LOD, Morita H, Sinkjær T, Nielsen J. Evidence that a transcortical pathway contributes to the stretch reflexes in the tibialis anterior muscle in man. J Physiol. 1998;512:267–276. doi: 10.1111/j.1469-7793.1998.267bf.x. [DOI] [PMC free article] [PubMed] [Google Scholar]
- Raethjen J, Lindemann M, Dumpelmann M, Wenzelburger R, Stolze H, Pfister G, Elger CE, Timmer J, Deuschl G. Corticomuscular coherence in the 6–15 Hz band: is the cortex involved in the generation of physiologic tremor? Exp Brain Res. 2002;142:32–40. doi: 10.1007/s00221-001-0914-7. [DOI] [PubMed] [Google Scholar]
- Salenius S, Portin K, Kajjola M, Salmelin R, Hari R. Cortical control of human motoneuron firing during isometric contraction. J Neurophysiol. 1997a;77:3401–3405. doi: 10.1152/jn.1997.77.6.3401. [DOI] [PubMed] [Google Scholar]
- Salenius S, Schnitzler A, Salmelin R, Jousmaki V, Hari R. Modulation of human cortical rolandic rhythms during natural sensorimotor tasks. Neuroimage. 1997b;5:221–228. doi: 10.1006/nimg.1997.0261. [DOI] [PubMed] [Google Scholar]
- Vallbo Å B, Wessberg J. Organization of motor output in slow finger movements in man. J Physiol. 1993;469:673–691. doi: 10.1113/jphysiol.1993.sp019837. [DOI] [PMC free article] [PubMed] [Google Scholar]
- Wessberg J, Vallbo Å B. Pulsatile motor output in human finger movement is not dependent on the stretch reflex. J Physiol. 1996;493:895–908. doi: 10.1113/jphysiol.1996.sp021432. [DOI] [PMC free article] [PubMed] [Google Scholar]
- Whittington MA, Traub RD, Kopell N, Ermentrout B, Buhl EH. Inhibition-based rhtythms: experimental and mathematical observations on network dynamics. Int J Psychophysiol. 2000;38:315–336. doi: 10.1016/s0167-8760(00)00173-2. [DOI] [PubMed] [Google Scholar]