

Abstract
Hyaluronan (HA) in joints conserves the lubricating synovial fluid by making trans-synovial fluid escape almost insensitive to pressure elevation (e.g. effusions, joint flexion). This phenomenon, ‘outflow buffering’, was discovered during HA infusion into the rabbit knee joint cavity. It was also found that HA is partially reflected by the joint lining (molecular sieving), and that the reflected fraction R decreases as trans-synovial filtration rate Q is increased. It was postulated therefore that outflow buffering is mediated by HA reflection. Reflection creates a HA concentration polarization layer, the osmotic pressure of which opposes fluid loss. A steady-state, cross-flow ultrafiltration model was previously used to explain the outflow buffering and negative R-vs.-Q relation. However, the steady-state, cross-perfusion assumptions restricted the model's applicability for an infused, dead-end cavity or a non-infused joint during cyclical motion. We therefore developed a new, non-steady-state model which describes the time course of dead-end, partial HA ultrafiltration. The model describes the progressive build-up of a HA concentration polarization layer at the synovial surface over time. Using experimental parameter values, the model successfully accounts for the observed negative R-vs.-Q relation and shows that the HA reflected fraction (R) also depends on HA diffusivity, membrane area expansion and the synovial HA reflection coefficient. The non-steady-state model thus explains existing experimental work, and it is a key stage in understanding synovial fluid turnover in intact, moving, human joints or osteoarthritic joints treated by HA injections.
Physiological background
Hyaluronan (HA) is an extremely large, non-sulphated polysaccharide composed of N-acetyl glucosamine–glucuronic acid disaccharides, with a hydrated molecular domain radius of > 100 nm. It occurs at exceptionally high volumetric concentrations in the synovial fluid of joints and tendon sheaths (2–4 mg ml−1), where its important role in low-load, soft tissue lubrication during movement has long been recognized (Roberts et al. 1982; Mabuchi et al. 1994). Synovial fluid is needed not only for lubrication but also to deliver nutrients to the avascular articular cartilage. A second major function of HA has emerged more recently: it prevents the vital synovial liquid from draining rapidly out of the joint cavity when pressure is raised, as it is during joint flexion and in arthritic joints (Mason et al. 2002). The fluid-conserving action of HA was discovered when rabbit knee joints were infused with HA solutions while measuring the trans-synovial volume flow. It was found that, when the intra-articular pressure P is raised, the opposition to trans-synovial fluid filtration out of the joint cavity (Q) likewise increases, and the increase in opposition is proportional to the applied pressure rise (McDonald & Levick, 1994, 1995; Coleman et al. 1999). As a result the P-vs.-Q relation is remarkably flat over a wide range of P. This is termed ‘outflow buffering’. Outflow buffering is absent if the HA is washed out. In the above studies the joint pressure was raised at 30–60 min intervals, which allowed Q to stabilize after each perturbation.
Coleman et al. (1999) postulated that outflow buffering is due to HA ultrafiltration, which causes the formation of a highly concentrated HA layer adjacent to the synovium. Such a layer will enhance the surface lubrication and will increase the opposition to water outflow by raising the HA osmotic pressure at the fluid/tissue interface. The greater the filtration pressure, the more concentrated the local concentration polarization layer and the greater the osmotic opposition to fluid escape.
The key postulate of the concentration polarization hypothesis is that the synovial lining acts as a partial ultrafilter with respect to HA. In other words, the extracellular matrix occupying the wide spaces between the synovial lining cells can partially sieve out and reflect the HA molecules during joint fluid drainage. Several experimental observations support this idea. (1) HA accumulates in the joint cavity during the trans-synovial filtration of HA solutions (Scott et al. 1998, 2000). (2) HA concentration is greatly reduced in the trans-synovial filtrate sampled from the subsynovial fluid compartment or joint lymph (Sabaratnam et al. 2003). (3) Fluorescein-labelled HA of physiological chain length (2300 kDa) hardly penetrates the synovial lining of the dog knee, whereas shorter chain HA does (Asari et al. 1998). (4) Electron microscopy indicates HA accumulation near the synovial interface (McDonald & Levick, 1994). (5) The intra-articular residence time of HA is an order of magnitude longer than that of albumin (Knox et al. 1988).
Evidence relating specifically to the formation of a concentration polarization layer came from the effect of trans-synovial filtration rate Q on the HA reflected fraction R. Reflected fraction is 1 − transmitted fraction. Transmitted fraction is the number of molecules emerging downstream of the membrane per unit time (i.e. Q × Cout, where Cout is the HA concentration downstream of the membrane) divided by the number of molecules entering the system per unit time (i.e. Q × C0, where C0 is the HA concentration in the infusate). Therefore,
The cavity of a rabbit knee joint was infused with HA solution to set up a constant Q and joint-derived lymph was collected over several hours (Sabaratnam et al. 2004b). R was calculated from the HA content of the lymph as 1 − (filtrate concentration)/(infusate concentration). It was found that the higher the filtration rate, the lower the reflected fraction. This negative relation is expected if a concentration polarization layer forms, because the increase in solute concentration at the leaky membrane surface raises the solute concentration in the filtrate (lymph), reducing R. Extrapolation of the Q-vs.-R relation indicated a synovial membrane reflection coefficient, σ, of 0.91 for HA. σ is the intrinsic membrane parameter that determines the maximum possible reflection. The determination of σ was conducted at the lowest HA concentration reported for rheumatoid arthritis (0.2 mg ml−1), and it is likely that σ will be even higher for HA at a normal intra-articular concentration of 2–4 mg ml−1 (Sabaratnam et al. 2004a).
Previous theoretical work
It is well established that the formation of a concentration polarization layer is typical of the ultrafiltration of a macromolecule through an imperfect semipermeable membrane, as in reverse osmosis and cake filtration (Shirato et al. 1965; Nettelbladt & Sundblad, 1967; Kozinski & Lightfoot, 1972; Parker & Winlove, 1984), and the phenomenon enjoys a wide application (Elias & Cleef, 1998; Bhattacharjee et al. 2001). Different theoretical models have been proposed, depending partly on geometry, stirring conditions and membrane permeability (Dainty, 1963; Kozinski & Lightfoot, 1972; Curry, 1984; Wijmans et al. 1985; Johnson et al. 1987; Tarbell et al. 1988; Jonsson & Jonsson, 1996; Peppin & Elliot, 2001). The work on joints reviewed above demanded a simple theoretical model for trans-synovial HA ultrafiltration in order to test quantitatively the feasibility of the concentration polarization hypothesis. Such a model has applications not only in biology but also in the physical sciences, where concentration polarization during commercial ultrafiltration is a common problem. Sound theoretical treatments existed already for concentration polarization at a perfect semipermeable membrane (σ = 1, e.g. Dainty, 1963) or, in the case of a leaky semipermeable membrane (σ < 1), for the dependence of reflected fraction on filtration rate from a perfectly stirred compartment (no concentration polarization, e.g. Curry, 1984). There appeared to be no formalism, however, for concentration polarization under the biological conditions of filtration from a poorly stirred compartment across a leaky membrane of σ < 1, as in a synovial joint. The issue thus arose of how to model the phenomenon, partly to test the concentration polarization hypothesis and partly, with a longer term aim, to achieve a description of synovial fluid exchange in intact, human joints where direct experimental measurements are not feasible.
In a previous attempt to model outflow buffering in joints, one of us (J.R.L.) developed a steady-state model (Coleman et al. 1999). In the steady-state model a fully developed HA concentration polarization layer, of constant thickness δ, reduces the fluid escape rate from the joint cavity by exerting a high, inward-directed osmotic pressure at the synovial surface. The steady-state model assumes that δ is fully established within the time course of the measurements and that δ is determined by the intracavity stirring that arises from the flow of infusate along the joint cavity. This model was also used later to account for the observed filtration rate dependence of HA reflection in rabbit knee joints (Sabaratnam et al. 2004b).
Few previous studies have rigorously investigated the time course of the build-up of a concentration polarization layer. Steady state was assumed in many cases, implying a fully developed concentration layer (e.g. Bhattacharjee et al. 2001; Geraldes et al. 2003). During HA ultrafiltration from an unstirred, ‘dead-end’ compartment in vitro at low filtration velocities (∼10−5 cm s−1), however, measurements showed that the steady state was not approached until ∼20–40 h (Barry et al. 1996; Zhang & Ethier, 2001). In infused joints the steady state appeared to be approached over just a few hours (Coleman et al. 1999; Sabaratnam et al. 2003), but the accuracy of assessment of the steady state in vivo was limited by the wide standard error bars associated with biological variation (see later). Coleman et al. (1999) noted that the approach to a steady state in vivo took longer at low filtration rates than at high filtration rates.
Although the 1999 steady-state model can be applied to stirred cases where δ can be taken to be a constant, it cannot be applied to more transient events, such as the changes within a joint during a flexion–extension cycle, which has a typical frequency in the order of 1 Hz. It is useful therefore to build a more general model that takes into account the developing nature of the HA concentration polarization layer with time. This is the aim of the present work. The non-steady-state model is developed in the present instance for the case of HA infusion into a joint cavity, because we have experimental data for comparison with the model predictions under these conditions. It is also intended to apply the non-steady-state model to the intact, moving joint in subsequent work.
In the new, non-steady-state model we applied Fick's law to describe the diffusive and convective movements of HA molecules in the developing concentration polarization layer. From this the model evaluates the time-dependent build-up of concentration polarization. The model was then used to calculate the effects of filtration rate on the time needed to establish a fully developed layer and on the changes in layer thickness, δ, with time in an unstirred compartment. We compared the model predictions with the HA sieving results of Sabaratnam et al. (2004b) for rooster comb HA of ∼2 × 10⁶ Da at an infusate concentration of 0.2 mg ml−1, using the same time protocols as in the rabbit experiments in vivo. We also used the model to obtain insights into the contribution of other parameters to the ultrafiltration kinetics.
Preliminary results were presented to the Physiological Society at its 2003 meeting in Cambridge (Lu et al. 2004).
The non-steady-state model
Theoretical considerations
As a simplified representation of the infused rabbit knee cavity (Coleman et al. 1999; Sabaratnam et al. 2003), we developed a one-dimensional model of HA concentration polarization, where x is the distance dimension. As shown in Fig. 1, the left side of the container, at x = 0, is the inlet from the infusion line. The right side of the container, at x = L, is closed by an imperfect semipermeable membrane, which can be synovium or any other partially reflective membrane. The water and small solutes are treated as a uniform phase which experiences no selective permeation; only one solute, HA in this application, experiences molecular rejection. The HA concentration polarization layer builds up near the membrane to a thickness δ that depends on time t, filtration rate Q and the membrane reflection coefficient σ. In the joint lymph studies of Sabaratnam et al. (2003), Q was held constant for 2–3 h after the initial set-up period. Pressure was adjusted as required to maintain a constant Q. Since the global trans-membrane filtration velocity U is Q/A, where A is the area of filtering synovium, U is assumed not to change with time in the model.
Figure 1. Schematic diagram of the theoretical model.

x is the distance dimension. L is the distance at which the imperfect semipermeable membrane is located. HA solution enters the unit at x = 0 at a given filtration velocity U and concentration C0. δ is the thickness of the concentration polarization layer. Curved line is concentration profile, schematically. Cm is concentration at the membrane interface and Cout is concentration of HA downstream of the membrane.
When the law of conservation of solute mass (here HA) is applied to any thin slice of the concentration polarization layer, the combination of convective transport into the slice and Fick's back-diffusion out of the slice leads to the well-known transport equation (Bird et al. 1960),
| (1) |
where C is the solute concentration, D is the solute diffusion coefficient and t is the time. At the inlet, i.e. x = 0, C = C0. At the membrane, i.e. x = L, most previous studies considered the steady state and therefore stated that, for unit area of membrane, the reflected solute flux, which is UCσ at sufficiently high filtration velocities, equals its back-diffusion down the concentration polarization layer, D(∂C/∂x), i.e.
| (2) |
This boundary condition is correct for a fully developed concentration polarization layer, when the diffusive transport of the solute across the membrane is negligibly small relative to its convective transport across the membrane. In such cases, the reflected solute is cleared by its back-diffusion, which prevents any further accumulation of solute at the surface of the membrane, and the concentration of the HA in the efflux, Cout = Cm(1 −σ). Under steady-state conditions dominated by convective transport across the membrane, mass conservation of the HA dictates that the concentration of the HA at the membrane, Cm = C0/(1 − σ). The boundary condition is not applicable, however, for a developing concentration polarization layer. In this situation the solute accumulates with time, because the back-diffusion concentration gradient is not yet steep enough to remove fully the reflected solute.
There has been no rigorous theoretical analysis of combined convection–diffusion across a semipermeable membrane when the surface solute concentration is changing with time (cf. steady state). A full description of trans-membrane transport in an unsteady state, taking account of the interacting diffusive and convective solute transport within the membrane pores, would be a challenging task in its own right, although the steady-state solution is well known (the Herzian equation, Curry, 1984, and Appendix). Fortunately the problem becomes much easier if the diffusive solute transport across the membrane is negligibly small relative to convectional transport, i.e. when the Péclet number for the membrane, Pé = Q(1 − σ)/APs ≥ 5, where Ps is the solute permeability of the membrane. In this restricted case a boundary condition for the solute concentration at the membrane can be formulated, as shown below, and this case applies to the rabbit HA studies. Based on rabbit knee experimental data, the synovial lining surface area A ≈ 12.0–21.0 cm2 for Q = 2–100 μl min−1 (see ‘Parameter values’, below), σ ≈ 0.95 and the permeability of the lining to HA,Ps ≈ 3.0 × 10⁻⁷ cm min−1 (Coleman et al. 1997). Thus Pé is ∼28–794 for trans-synovial flows of 2–100 μl min−1. In other words the diffusive transport of HA across the joint lining is quantitatively insignificant relative to convective flux even at trans-synovial flows as low as 1–2 μl min−1.
As shown in Fig. 2, in a thin layer of thickness Δx, contiguous with unit area of membrane, when diffusive solute transport across the membrane is negligible, mass conservation of the solute in the non-steady state gives
| (3) |
where the subscripts L and L –Δx represented the location in the model. The above equation was used as the boundary condition at x = L in this model. As a result, the partial differential equation (1) had to be solved iteratively over the length L. In the calculation a non-uniform grid was used, with more points near the membrane to define the large gradient of the solute concentration there. Equations were solved using a finite difference method, where the integration followed the trapezoidal rule. We have also considered below the case where the diffusivity of the solute D was a function of the solute concentration C. In such a case the equations became highly non-linear and the Picard treatment for the non-linearity was used in our numerical method (Reddy & Gartling, 2001).
Figure 2. Diagram showing a thin layer of thickness Δx immediately adjacent to unit area of a membrane of reflection coefficient σ (< 1) for the solute of interest.

Prior to reaching a steady state an imbalance between the amount of solute entering and leaving the layer per unit time results in a change in the solute concentration C with time. D is the diffusion coefficient of the solute experiencing reflection. The diagram illustrates the situation of physiological interest, when the transmembrane diffusive solute flux is quantitatively insignificant relative to the convective solute flux.
Model parameters
The values assigned to the parameters in the model were based on available data derived from experiments.
Reflection coefficient, σ
The potential, maximum ability of the synovial lining to reflect a given solute is denoted by its reflection coefficient σ, which can take any fraction between 0 and 1. A value of 1 denotes a perfectly impermeable membrane with respect to the solute, i.e. 100% solute reflection. The value depends primarily on the ratio of the effective radius of the solute to the pore size. Synovium is slightly permeable to HA (Brown et al. 1991; Sabaratnam et al. 2003), so σ is < 1. For HA infused at 0.2 mg ml−1 the synovial membrane σ was evaluated as 0.91, with an upper confidence limit of 0.95 (Sabaratnam et al. 2004b). At 0.2 mg ml−1, a concentration found in a severe rheumatoid effusion, the adjacent HA molecular domains do not overlap. In many normal joints, however, the HA concentration is ≥ 2 mg ml−1, and at this concentration the adjacent HA molecular domains overlap, which increases the effective solute size. Under these conditions the reflected fraction can reach 0.95 (Scott et al. 1998). In the presence of concentration polarization the reflected fraction, i.e. (1 − filtrate concentration)/(infusate concentration), underestimates σ, so we have assumed σ = 0.95–0.98 for the present modelling, in line with Coleman et al. (1999). During HA ultrafiltration σ may change and approach even closer to 1 due to membrane fouling and pore clogging (Barry et al. 1996; Peppin & Elliott, 2001).
Diffusion coefficient, D
The HA diffusion coefficient changes as a function of HA concentration (Laurent et al. 1960; Barry et al. 1996; Gribbon et al. 1999) and takes the form D = (3.93 + 4.26C) × 10−8 cm2 s−1 for HA of ∼106 Da, where C is in mg ml−1 (Wik & Comper, 1982). We used this relation for the HA diffusion coefficient in the concentration polarization layer. The bulk concentration C0 = 0.2 mg ml−1 was used because this was the infused rooster HA concentration in the experiments of Sabaratnam et al.2003, 2004b
Filtration rate, Q
In the experiments of Sabaratnam et al. (2004b) the regression line relating trans-synovial filtration rate Q (μl min−1) to P (cmH2O) was Q = 1.58P – 5.47 over the range 10 cmH2O and 10 μl min−1 to 46 cmH2O and 67 μl min−1. In the model we also explored filtration rates outside this range.
Surface area, A
Increases in joint fluid drainage rate Q are brought about by increases in intra-articular fluid pressure P, which distends the joint cavity, as shown by radiography (Levick, 1979), pressure–volume plots (Knight & Levick, 1982a) and intra-articular resin casts (Knight & Levick, 1982b). We incorporated changes in membrane area A into the model because it affects fluid velocity U (= Q/A). The area expansion is not linearly related to P because the pressure–volume relation is non-linear and cavity compliance falls as P is raised (Knight & Levick, 1982a). A definitive plot of A-vs.-P is not available, but it is known that A increases by ∼60% between 5 cmH2O and 25 cmH2O from a ∼12 cm2 baseline, and reaches ∼20.4 cm2 at 2.5 ml intra-articular fluid, corresponding to a pressure of ∼40 cmH2O (Knight & Levick, 1983; Levick & McDonald, 1989). Based on these data and on the relation Q = 1.58P − 5.47 (see previous paragraph), a simple, mono-exponential relation was fitted between A (cm2) and Q (μl min−1) to allow area interpolation,
| (4) |
where A0 is ∼12.0 cm2 of synovial lining (Levick, 1994).
Concentration polarization layer thickness, δ
The exact thickness of the HA concentration polarization layer is unknown but was estimated to be in the order of 220 μm at a filtration pressure of 5 cmH2O (Coleman et al. 1999) and ∼100 μm at higher pressures (Sabaratnam et al. 2004b). To encompass the entire thickness of the concentration polarization layer, we chose a computational domain length of 2500 μm. We checked after each calculation that this fully encompassed the polarization layer.
Model validation
Before we began using numerical solutions of the non-steady-state model to investigate the growth of the HA concentration layer, we ran the model to obtain a numerical solution for the steady-state HA concentration distribution near the synovial lining. This enabled us to validate the model, because a simple, theoretical solution is available for the steady state for comparison; see eqn (5), and Appendix for derivation. We then compared the steady-state prediction of the numerical model with the theoretical steady-state curve. It is emphasized that eqn (5) applies only to the steady state, whereas our numerical model is capable of solution for both the steady and non-steady states.
| (5) |
In the above equation, C is concentration at distance x and the intermediate parameter, α=UL/D is the ratio between the convective and diffusive velocities of HA in the concentration polarization layer, i.e. the Péclet number within the polarization layer, which dictates the concentration profile of HA. The typical value for α in our problem is ∼20 based on Q = 10 μl min−1, L= 2.5 mm and D= 1.2 × 10⁻⁸ cm2 s−1. This expression is a more general form of eqns (A6) to (A9) of Coleman et al. 1999. It is valid when the diffusive solute transport across the membrane is small relative to its convective transport across the membrane, i.e. the Péclet number for the membrane, Pé=U(1 − σ)/Ps≥ 5. As shown earlier, for the system under consideration the membrane Pé is ≥ 28 for trans-synovial flows > 2 μl min−1.
Using the numerical, unsteady state model, we calculated HA concentration profiles from eqns (1) and (3) at successive time points until a steady-state profile was reached. In Fig. 3 the fully developed HA concentration profile computed in this way is compared with the theoretical profile defined by eqn (5), in order to validate the numerical model. A stringent mathematical criterion was used to define the steady state in the numerical calculation, namely that the maximum change in HA concentration between two time iterations is less than 10−6 × C0. The time step between two successive time iterations, Δt, was 1 s throughout. The numerical calculation took approximately 30 min using a Pentium 4 computer (2.0 GHz, 512 MB). Smaller values for Δt were explored but made a negligible improvement in the results at the expense of excessive increases in the computation time.
Figure 3. Distribution of HA concentration near the membrane in the steady state.

Parameters are L = 2.5 mm, C0 = 0.2 mg ml−1, D = 4.8 × 10⁻⁸ cm2 s−1, Q = 10 μl min−1 and σ = 0.95. The figure compares the prediction of the numerical model (symbols) with the asymptotic analytical solution (continuous line, eqn (5)). The experimental estimates of the thickness of the HA polarization layer during rabbit knee joint infusion were in the order of 100–220 μm (Coleman et al. 1999; Sabaratnam et al. 2004b).
As Fig. 3 there was good agreement between the numerical and theoretical solutions. The numerical model was therefore applied to its primary task – that of investigating the time-dependent changes in the HA concentration polarization layer during a constant HA infusion into a synovial joint cavity – with the following results.
Results
(1) The temporal development of the HA concentration polarization layer is non-linear
We first evaluated the development of the concentration polarization layer over time. Starting from a uniform initial concentration profile, namely C0 = 0.2 mg ml−1 from x = 0 to x = L, a constant filtration rate was initiated at t = 0. For the model solutions in Fig. 4 the filtration rate was set at 60 μl min−1, a value used in an experimental study in vivo (see Fig. 1 of Sabaratnam et al. 2003) and σ was 0.98. The synovial surface area was 20.5 cm2 (eqn (4)) and HA diffusivity was a function of concentration as described under ‘Model parameters’.
Figure 4. Build-up of the HA concentration polarization layer with time near the membrane during HA infusion.

The profiles are plotted for 30 min time intervals, except the top curve which shows the steady-state distribution of HA reached at t = 20 h. Thickness of the HA layer increased from ∼100 μm at t = 0.5 h to ∼190 μm in the steady state. The parameter values for these solutions are Q = 60 μl min−1, C0 = 0.2 mg ml−1, σ = 0.98, A = 20.5 cm2 and HA diffusivity D = (3.93 + 4.26C) × 10−8 cm2 s−1.
Figure 4 shows the HA concentration profiles at 30 min intervals and also the steady-state profile (top curve). HA accumulated near the membrane as filtration proceeded, with the steepest concentration gradient closest to the membrane. Both the HA concentration and the thickness of the polarization layer increased with time. At the start of the filtration period the HA layer built up very quickly, but the rate of increase of HA concentration got progressively slower with time. At a filtration rate of 60 μl min−1 the steady state was almost reached after ∼5–6 h. The thickness of the HA concentration polarization layer increased from ∼100 μm at t = 0.5 h to ∼190 μm in the steady state.
The results in Fig. 4 show that the change in the HA profile with time had slowed down greatly after ∼3 h. This was in agreement with the experimental observations of Sabaratnam et al. (2004b). The latter group infused rabbit joints with HA at a constant trans-synovial filtration rate of 60 μl min−1 over several hours and measured the HA concentration in repeated samples of filtrate (lymph) at 15 min intervals, in order to test whether a quasi-steady state had been established. The lymph collections began 2–3 h after the infusion had started and continued for a further 2–3 h. Their results showed an apparent, experimentally acceptable quasi-steady state. This is in keeping with the model prediction in Fig. 4, especially when the blurring of steady-state assessment by experimental scatter is taken into account. The relatively slow time course with which the developing HA concentration polarization layer approached the true steady state in our model confirms the need for the long priming time in experiments before commencing measurements (Coleman et al. 1999; Sabaratnam et al. 2003, 2004b).
(2) The time needed to reach a steady state (tss) depends on the filtration rate
To help interpret the results of animal joint experiments carried out at different trans-synovial filtration rates, we calculated the time needed to establish a fully developed HA concentration polarization layer, i.e. the steady state (tss), over a range of filtration rates (Fig. 5). The results showed that tss is a negative function of the filtration rate Q, and that it also depends heavily on the stringency of the criterion adopted for a steady state. Two curves are shown in Fig. 5. The continuous line is derived for the maximum change in upstream HA concentration over time interval Δt (i.e. 1 s) being less than 10−4 × C0. The dashed line represents the maximum change over Δt being less than 10−6 × C0.
Figure 5. The time required to establish a fully developed HA concentration polarization layer (steady state), tss, during HA infusion at different trans-synovial filtration rates.

The model solutions are for parameter values C0 = 0.2 mg min−1, σ = 0.98. D = (3.93 + 4.26C) × 10−8 cm2 s−1 and A as defined under ‘Model parameters’. The steady-state criterion for the upper, dashed line was very rigorous (beyond the resolution of most biological experiments), namely a maximum change in HA concentration over interval Δt of < 10−6 × C0. The continuous line is for a more relaxed definition of the steady state, namely a maximum change of < 10−4 × C0 over interval Δt. For an explanation of the curves, see text.
Results from the model show that tss decreases at high filtration rates, i.e. a steady state is approached sooner at high filtration rates. This is intuitively correct, because the high velocity at which HA is swept into the layer at high filtration rates speeds up the HA concentration polarization process. The time tss for the lower stringency criterion (continuous line, Fig. 5) fell from 28 h to 4 h as the filtration rate was increased from 10 μl min−1 to 100 μl min−1, in keeping with HA ultrafiltration data (Barry et al. 1996).
At very low trans-synovial drainage rates, such as may occur in vivo in non-infused, non-arthritic joints, the low-stringency criterion for the steady state leads to a counter-intuitive result, namely that tss shortens with reduction of filtration rate (cf. with increases in filtration rate at high filtration rates). Inspection of the model showed that the reason is semantic, not biophysical, as follows. At low filtration rates the build-up of the HA concentration polarization layer from an infusion source is a very slow process, so the change in concentration over time interval Δt is very small; and the lower the filtration rate, the smaller it is. As a result the steady-state criterion (change of < 10−4 × C0 over interval Δt) is met at earlier times. This accounts for the downturn in the continuous line at Q < 10 μl min−1. This ‘artefact’ can be avoided by applying the stricter criterion for a steady state (dashed line). When the steady state criterion is 10−6 × C0 rather than 10−4 × C0, tss decreases with increasing filtration rate across the whole range of explored filtration rates, as expected. At very low physiological filtration rates, such as Q < 10 μl min−1, the tss value exceeded 100 h for the 10−6 × C0 criterion (not shown in the figure).
When the limited accuracy of HA assays, biological variability and other sources of experimental error are taken into account, it appears that the above criteria for the steady state may be more stringent than is achievable in animal experiments. From the magnitude of the standard error bars in Fig. 1 of Sabaratnam et al. (2003) (lymph concentration versus time over 3 h), the steady-state criterion in vivo may have been at best in the order of 4.4 × 10⁻⁴C0. Nevertheless the results in Fig. 5 are of practical value in the interpretation of the joint ultrafiltration experiments. The results confirm that high filtration rates speed up the development of the HA concentration polarization layer. Furthermore, the results show that significant difficulties can be encountered in experiments conducted at very low filtration rates, because the system may still be some way from a steady state at the time of measurement. The significance of this new finding in relation to animal experimental results is considered in the Discussion.
(3) The thickness (δ) of the fully developed HA concentration polarization layer depends on filtration rate
There appears to be no universally accepted definition for δ, the thickness of a concentration polarization layer (e.g. Pedley, 1983; Nicolas et al. 1995), so we defined δ as the distance between the membrane and the point at which the solute concentration is 1% higher than the bulk concentration C0. This definition can be combined with the asymptotic expression eqn (5) to calculate δ. Equation (5) describes the concentration profile of HA across the steady-state polarization layer for given σ, Q and A, provided that the HA diffusivity D is taken to be independent of HA concentration (see Appendix). The thickness of the HA layer, δ, is obtained from eqn (5) by setting C/C0 = 1.01 (i.e. our criterion for δ) and rearranging as
 |
(6) |
.
From eqn (6) the thickness of the steady state concentration polarization layer was calculated to be in the order of several hundred micrometres. The value depends on the filtration rate, as described next.
The thickness of the concentration polarization layer is inversely related to the filtration rate, as shown in Fig. 6. An increase in Q generates a thinner concentration polarization layer. This is because a rise in convective velocity drives the HA molecules more rapidly towards the membrane, counteracting the tendency of HA to diffuse away from the membrane in the upstream direction. The relation between thickness and filtration rate is non-linear, and the layer thickness increases particularly steeply as filtration rate is reduced to low values, e.g. < 10 μl min−1.
Figure 6. Thickness δ of the steady-state HA concentration polarization layer generated at different trans-synovial filtration rates for an infused concentration of 0.2 mg ml−1.

Dashed line represents thickness δ at constant parameter values: σ = 0.95, A = 12.0 cm2 and D = 4.8 × 10⁻⁸ cm2 s−1. A, effect of an increase in σ from 0.95 to 0.98. B, effect of membrane area expansion A = 12.0 + 9.0(1 – e−0.048Q) cm2. C, effect of concentration-dependent diffusivity, D = (3.93 + 4.26C) × 10−8 cm2 s−1. D, combined effect of σ = 0.98, A = 12.0 + 9.0(1 – e−0.048Q) cm2 and D = (3.93 + 4.26C) × 10−8 cm2 s−1 on the thickness of HA layer.
Figure 6 also illustrates the effect of membrane reflection coefficient, area and diffusivity on layer thickness δ. It shows four different δ-vs.-Q relations, each calculated for a different set of parameters. With the parameter σ = 0.95, and with A and D held constant (A = 12.0 cm2, D = 4.8 × 10⁻⁸ cm2 s−1), the calculated concentration polarization layer thickness was the smallest at any given filtration rate. We then calculated the effect of an increase in the membrane reflection coefficient due to membrane fouling by HA, i.e. pore obstruction (Barry et al. 1996; Peppin & Elliott, 2001). If membrane fouling raises σ to 0.98, the thickness of the HA layer increases at any given filtration rate, but the increase is minor – just a few micrometres.
Next we assessed the effect of the increased area of the expanded synovial lining as pressure is raised to drive the increases in filtration rate, using eqn (4) to calculate the increases in A. Area expansion causes a small increase in δ at any given filtration rate, but the changes are again minor. The reason for the change is that an increase in the filtration surface area reduces filtration velocity U moderately, since U = Q/A. The filtration velocity determines δ by the mechanism described earlier.
We also assessed the effects of changes in the hyaluronan diffusion coefficient D as a function of concentration C; see ‘Model parameters’. For this purpose we were unable to use the asymptotic solution, i.e. eqns (5) and (6), because this solution is derived on the assumption that D is a constant. The numerical model, however, readily incorporated changes in D as a function of C. Thickness of the layer was seen to increase by more than 30% at Q = 10 μl min−1 and by approximately 100% at Q = 70 μl min−1. The mechanism is the converse of the effect of convective velocity described above. In other words, a greater diffusive velocity allows the HA molecule to move further upstream at given filtration velocity, counteracting the convection of HA towards the membrane.
When all three contributing factors were considered, thickness of the HA concentration polarization layer δ had a magnitude of several hundred micrometres at Q > 10 μl min−1. This was of a similar order of magnitude to estimates of δ from experimental results, namely δ≈ 71–111 μm for 0.2 mg ml−1 HA at higher filtration rates (10–67 μl min−1; pressure 10–46 cmH2O) (Sabaratnam et al. 2004b) and δ≈ 220–890 μm for 3.6 mg ml−1 HA at low filtration rates (∼4 μl min−1; pressure 5–18 cmH2O) (Coleman et al. 1999).
It is relevant to understanding the physiology of an intact, closed joint (cf. a joint connected to a quasi-infinite column of infusate) to note that at very low trans-synovial filtration rates the thickness of the steady-state polarization layer approached the length of the model system, L = 2.5 mm. A related, physiologically important mathematical problem arises when the concentration polarization layer spans the whole length of a non-infused cavity. This will prove important in understanding synovial fluid filtration in an intact, non-infused joint and the problem is under current investigation.
(4) Effect of trans-synovial filtration rate on reflected fraction; the R-vs.-Q relation
An experimental study of HA ultrafiltration across the synovial cavity-to-lymph barrier in rabbit knees showed that the HA reflected fraction R, measured several hours after initiation of filtration, decreases as filtration rate Q is raised above ∼10 μl min−1 (Sabaratnam et al. 2004b). This is the opposite of the trend expected for partial ultrafiltration across a membrane with no concentration polarization layer: but as shown below it is entirely consistent with partial ultrafiltration across a membrane coated with a concentration polarization layer. Sabaratnam et al. (2004b) defined the HA reflected fraction as
where C0 and Cout are the HA concentrations entering and leaving the joint cavity. This definition was applied in our model to predict the relation between R and Q at a given time. The prediction was then compared with the experimental results.
To predict the changes in reflection with filtration rate at a fixed time point, we had first to simulate the temporal development of the HA concentration polarization layer at each filtration rate. The non-steady-state numerical model was used to simulate the laboratory experiments of Sabaratnam et al. (2004b), using the timing protocol of these experiments. In the model, as in the laboratory experiments, a 1 h priming interval at constant Q was allowed before data were extracted, after which the results were extracted every 15 min for a further 3 h, just as Sabaratnam et al. sampled lymph every 15 min for 2–3 h. The results over each 15 min interval were averaged, as in the published experimental work. The numerical procedure was repeated for a range of trans-synovial filtration rates extending below and above the experimental range. Results have not been extended below 1 μl min−1 because the model is only valid when the convective trans-membrane solute flux greatly exceeds diffusive solute flux, i.e. Pé > 5. At very low filtration rates the reflected fraction will fall, and over long observation periods R will approach zero at zero filtration rate. This is because the slow but finite trans-membrane diffusion of solute into the downside (subsynovial) compartment will ultimately bring the downstream compartment into equilibrium with the upstream compartment.
Figure 7 shows the model's predictions and, for comparison, the experimental results. The values of the model parameters were changed systematically in accordance with the physiological/biophysical evidence (see ‘Model parameters’) in order to evaluate their individual contributions to the R-vs.-Q relation. For all parameter values the model predicted a decrease in the reflected fraction with increasing trans-synovial filtration rate, in line with the direction of change observed experimentally. Examination of the model showed that the fall in reflected fraction was caused by the still developing, time-dependent nature of the concentration polarization layer at a fixed, pre-steady-state time point (Fig. 4), coupled with the fact that the time course of the concentration increase at the interface depends on the filtration rate (Fig. 5). A high filtration rate caused a more rapid development of the HA concentration layer, so that at a fixed sampling time the concentration polarization layer was closer to its final, steady-state distribution than at low filtration rates. Consequently, at a given sampling time the concentration at the interface was higher at fast filtration rates than at slow filtration rates. A high concentration at the interface leads to the formation of a filtrate of increased concentration, which in turn results in a low value for R.
Figure 7. Experimental results of Sabaratnam et al. (2004b) (circles) and non-steady-state model predictions (lines) for the effect of filtration rate on synovial HA reflected fraction.

The hyaluronan reflected fraction, R, is defined as R = 1 – (Cout/C0), where C0 and Cout are, respectively, the HA concentrations entering the cavity (0.2 mg ml−1) and leaving it. Model solutions refer to the same time intervals as the experiments, as explained in the main text. Dashed line represents model prediction of the reflected fraction of HA at constant parameter values: σ = 0.95, A = 12.0 cm2 and D = 4.8 × 10⁻⁸ cm2 s−1. A, effect of an increase in σ from 0.95 to 0.98. B, effect of membrane area expansion A = 12.0 + 9.0(1 – e−0.048Q) cm2. C, effect of concentration-dependent diffusivity, D = (3.93 + 4.26C) × 10−8 cm2 s−1. D, combined effect of σ = 0.98, A = 12.0 + 9.0(1 – e−0.048Q) cm2 and D = (3.93 + 4.26C) × 10−8 cm2 s−1 on the reflected fraction of HA.The data are best fitted when the model takes into account synovial area expansion, the concentration dependence of HA diffusivity and pore fouling. It should be noted that at very low trans-synovial filtration rates, approaching zero, diffusive transport of HA across synovium becomes significant and R→ 0, i.e. the curve will make a downturn towards R = 0 at Q = 0 (not modelled). The current model applies to filtrations rates Q≥ 1 μl min−1, where convective solute transport across the lining greatly exceeds diffusive transport.
It is important to note that, counter-intuitively, the eventual concentration at the membrane interface in the steady state will be the same at low filtration rates as at high filtration rates, though it will take very much longer to reach this point at low filtration rates (Fig. 5). For a true steady state to exist during dead-end filtration, the reflected fraction must be zero, because by the law of conservation of mass the solute flux into the system, Q×C0, must equal the output from the system, Q×Cout. The concentration at the membrane interface will continue to increase with time (quickly at high filtration rates, slowly at low ones) until solute flux equality is eventually reached. As a result, the closer the system is to the steady state, the lower the value of the reflected fraction. The decay in the HA reflected fraction as filtration rate increases is due to the fact that, over a fixed time interval such as 3 h, the HA concentration polarization layer is closer to its steady-state distribution at high filtration rates than at low filtration rates.
The four panels in Fig. 7 illustrate the individual effects of parameters on, and their combined contribution to, the reflected fraction of HA at a given filtration rate and time point. The difference between the model predictions and the experimental measurements was reduced when the following factors were taken into account: a higher reflection coefficient of the synovial lining to HA (Fig. 7A); an increase in the area of the synovial lining with pressure, which reduces the convective velocity building up the concentration polarization layer at a given filtration rate (Fig. 7B); the concentration-dependent diffusivity of HA, which increases the dissipative tendency of the concentration polarization layer (Fig. 7C). The combined contribution of all three parameters (Fig. 7D) showed good agreement between the model prediction and experimental results.
The increase in the reflected fraction of HA caused by a small rise in the synovial lining reflection coefficient σ, here from 0.95 to 0.98, is striking. This is due to the effect of σ on the time needed to approach the steady state. An increase in σ means that a higher concentration is needed at the membrane interface to achieve a steady-state mass balance, i.e. the condition QC0 = QCout. Consequently, the higher the value of σ, the further the system is from a steady state at a given time point. Figure 8 illustrates the effect of σ on tss, the time needed to reach the steady state. Increases in σ result in longer times to reach a steady state, and this effect is especially marked at σ > 0.95. For example, at Q = 60 μl min−1 a rise in σ from 0.90 to 0.93 increases tss by only ∼1 h, whereas a rise in σ from 0.95 to 0.98 increases tss by ∼16 h. Moreover, for a given rise in σ, e.g. from 0.95 to 0.98, the effect on tss is much greater at low filtration rate: at Q = 40, 60 and 80 μl min−1 the increase in tss is approximately 30, 16 and 10 h, respectively.
Figure 8. Effects of the reflection coefficient, σ, on the time required for the HA concentration polarization layer to reach steady state, tss.

The tss-vs.-σ relation was calculated for three different, constant filtration rates. The other key parameters were D = (3.93 + 4.26C) × 10−8 cm2 s−1 and A = 12.0 + 9.0(1 – e−0.048Q) cm2.
Discussion
The principal new findings were as follows. (i) The concentration polarization layer that forms in a HA solution during trans-synovial drainage is in a non-steady, developing state over physiological and experimental time intervals (hours or less). (ii) As a result, time is of hitherto underestimated importance in the interpretation of HA ultrafiltration experiments lasting under 24 h. (iii) The degree of development of the HA polarization layer at a given time is enhanced by high filtration rates (and hence pressure), although this increases the loss of lubricating HA from a joint cavity. (iv) The non-steady state can explain the experimental finding that the HA reflected fraction across the joint lining is a negative function of filtration rate.
Model characteristics in relation to experiments on synovial joints
A key result from the model was that the time required for the system to reach a steady state, tss, is generally longer than the duration of a joint flexion–extension cycle or of a physiological experiment. One problem in comparing predictions using this model with the experiments in vivo, however, is that the value of tss depends on the model's definition of ‘steady state’. Under a very stringent criterion, namely that the maximum change in HA concentration is 10−6 × C0 s−1, more than a day is needed to reach a steady state at low filtration rates. This is in keeping with the observations of Barry et al. (1996), who studied dead-end HA ultrafiltration in vitro at low filtration velocities. By contrast the duration of acute animal experiments in vivo is a few hours. Nevertheless, analysis of trans-synovial filtrate HA concentration versus time in vivo at 3–6 h after initiation of a relatively high filtration rate (60 μl min−1) in rabbit knees indicated a close approach to a steady state, since the regression slope of the Cout-vs.-time plot was not statistically significantly different from zero (Sabaratnam et al. 2003). The observed quasi-steady state may be due partly to the high filtration rate (Figs 4 and 5) and partly to relaxed criterion enforced by the substantial experimental variance; the standard deviation of the HA filtrate concentrations was 0.048 mg ml−1 or 24% of C0. With less rigorous criteria for the steady state the model tss is greatly reduced (Fig. 5), in broad agreement with the above result in vivo. The fair approximation to a steady state in the above experimental data is also helped by the fact that most of the build-up of the HA concentration polarization layer occurs during the initial few hours of the filtration (Fig. 4).
There are additional problems in relating our simple biophysical model to the more complex biological system of a synovial joint. The model is one-dimensional and the filtration rate uniform at all parts of the membrane. In a real joint cavity there are many confounding complexities: the cavity geometry is highly non-uniform and asymmetrical; the membrane is curved in three dimensions (Levick, 1979; Knight & Levick, 1982b); the membrane permeability may be non-uniform due to its structural heterogeneity (Knight & Levick, 1983), and a strictly constant filtration rate is difficult to maintain experimentally. Also, since the cavity has a characteristic length scale of centimetres, some areas of filtering synovial membrane are at a considerably greater distance from the infusion cannula than others, the cannula being essentially a point source of infusate. All these factors will complicate the build-up of the HA concentration polarization layer and contribute to differences between theoretical and experimental results. Despite all these problems the model provided a reasonably accurate description of the experimental results, as reviewed next.
Model parameters and the fit to the experimental reflection-vs.-filtration rate data
The sensitivity of the reflection-vs.-filtration rate relation to relatively modest changes in the model parameters is highlighted in Fig. 7. The model showed that it is necessary to take into account the concentration dependence of HA diffusivity, the pressure dependence of synovial area and the possible effect of pore fouling on σ to explain the experimental results.
Increases in HA diffusivity with concentration cause more back diffusion, especially close to the membrane where the concentration is highest. This prolongs the time needed for its full development, which in turn increases the rejected fraction at a given, pre-steady-state time point.
Synovial expansion is an obvious feature of joints when the intra-articular fluid pressure is increased by an effusion (Levick, 1979; Knight & Levick, 1982a,b; McDonald & Levick, 1988). Increases in the synovial lining area reduce the trans-synovial filtration velocity for a given filtration rate. This attenuates the convective transport of HA into the concentration polarization layer, thereby delaying its build-up, which in turn increases the rejected fraction of solute molecules.
The adsorption of HA onto the synovial surface and clogging of synovial pores are a likely accompaniment to the ultrafiltration process, as noted in vitro (Barry et al. 1996; Peppin & Elliott, 2001). In support of this in vivo, the outflow buffering curve for 2–4 mg ml−1 HA, i.e. the Q-vs.-P relation, is so flat that it led to the proposal of HA impaction in the membrane in addition to the upstream concentration polarization (Coleman et al. 1999). Membrane fouling is likely to increase the membrane reflection coefficient, which in turn increases the observed reflected fraction (Figs 7 and 8).
The above three effects increase the thickness of the concentration polarization layer (Fig. 6). This shifts the theoretical curve for reflection-vs.-filtration rate at a given time point upwards in Fig. 7 and results in a fair agreement between the experimental results and the model prediction. The biological significance of all three effects is that the increased reflection fraction helps a joint to retain its lubricating HA molecules during conditions of increased pressure and trans-synovial filtration rate, e.g. arthritic effusions.
Range of validity of model and future applications
Considerable care is needed when working at very low filtration rates, not only in experiments but also in a mathematical model. One difficulty noted earlier (Results, section 2) is the assessment of ‘steady state’ at low filtration rates, since the concentration profile develops very slowly at low Q values. A second problem is that the thickness of the concentration polarization layer increases disproportionately at very low filtration rates (Fig. 6), so it could occupy the whole length of the cavity of a small joint. Under these circumstances the inlet boundary condition postulated in the present model will no longer be valid. Also, at very low filtration rates the Péclet number for the membrane becomes smaller than in the present model, so the diffusive transport of HA across the synovial lining may no longer be negligible, which will have the effect of reducing the reflected fraction.
Under extreme conditions in an in vitro system, gel formation could occur when the concentration of HA in the concentration polarization layer reached a critical level. This would have dramatic effects on parameters such as the diffusion coefficient of HA and the applicability of the model in studying HA transport. It is unlikely to occur, however, in the physiological situation (Coleman et al. 1999). HA does not form a gel even at concentrations as high as 25 mg ml−1, which is the kind of level that may form in vivo and account for outflow buffering. In our study, C0 = 0.2 mg ml−1, even for a very large σ (= 0.99), the highest HA concentration in the polarization layer, Cm = C0/(1 −σ), would stay below 25 mg ml−1.
One potential application of the model is to explore trans-synovial drainage rates outside the experimental range. Experimental studies of trans-synovial sieving in vivo are not technically feasible at filtration rates much below 10 μl min−1, because this generates insufficient joint lymph. Another application is to predict trans-synovial exchange in situations where direct measurements are impractical, for example in the intact, non-infused human joint during normal flexion–extension cycles. Normal movement must involve the cyclical formation and dissipation of an incompletely developed HA polarization layer as the intra-articular pressure and filtration rate oscillate. This application is under development; it requires an extension of the present model, based on a constant filtration rate, to account for the changing filtration rate, pressure and intra-articular fluid volume during the joint cycle. A further application and test of the model will be the evaluation of the outflow buffering phenomenon (Coleman et al. 1999), for which new boundary conditions will again be required, namely a constant pressure and time-dependent Q.
Conclusions
A theoretical model was developed to describe the non-steady-state build-up of a concentration polarization layer over time during dead-end ultrafiltration across a leaky semipermeable membrane – in this instance HA ultrafiltration across the synovial lining of a joint. The aim was to elucidate the mechanism responsible for recent experimental observations in vivo, namely the negative relation between HA reflected fraction R and trans-synovial filtration rate Q, and to provide a platform for a future model of the intact, moving joint. The time needed to reach a steady state and the thickness of the fully developed HA concentration polarization layer were shown to decrease with increasing filtration rate. The negative R-vs.-Q relation arises from the developing nature of the HA concentration polarization layer in studies lasting only a few hours, because at such time points the concentration polarization layer is more highly developed at high filtration rates than low ones. When the effects of increased HA diffusivity with concentration, increased synovial surface area with joint fluid pressure, and increased HA reflection coefficient with membrane fouling were taken into account, predictions using the model were in broad agreement with the experimental results in vivo. Due to its non-steady-state nature, the model is a key stage, though not the final stage, in the journey towards a description of fluid and HA fluxes across non-infused human joints during normal cyclical joint movement which are not directly amenable to experimental investigation.
Acknowledgments
The studies were supported in part by The Wellcome Trust (J.R.L., grant 056983/Z/99).
Appendix
Steady-state concentration polarization profile in an unstirred compartment close to a partially sieving membrane
Following the notation in Fig. 1, in a steady state the convective transport of the solute towards the membrane at any distance x in the layer is fully balanced by back-diffusion (Bird et al. 1960),
| (A1) |
where U = Q/A is the filtration velocity and D is the diffusion coefficient. This is the same as eqn (1) except the left-hand side is now zero by definition of a steady state. The boundary condition at the inlet is,
| (A2) |
where C0 is the infusate solute concentration. At the membrane itself, consideration of the mass conservation of solute yields
| (A3) |
where Jm is the total solute flux across the membrane (synovium) of area A. In the steady-state flux Jm is related to the membrane reflection coefficient σ by the non-linear Herzian equation (Curry, 1984), namely
| (A4) |
where Pé = Q(1 −σ)/APs is the Péclet number for the membrane, Cm the solute concentration on the feeding side of membrane and Cout the solute concentration at the downstream side of the membrane. For Q = 2 – 100 μl min−1, the surface area of the synovial lining A is ∼12.0–21.0 cm2, σ for HA is 0.9–0.98 and synovial permeability to HA is very low, Ps≈ 3.0 × 10⁻⁷ cm min−1. Hence Pé is >10 even at a low filtration rate, e.g. Q = 2 μl min−1, and e−Pé is close to zero. Under these conditions eqn (A4) therefore reduces to
and the boundary condition eqn (A3) can be rearranged as
| (A5) |
Assuming that D is independent of the solute concentration, C, eqn (A1) has the general solution
| (A6) |
where parameters B1 and B2 are to be fixed by forcing the expression eqn (A6) to satisfy boundary conditions at x = 0 and x = L. At x = 0, eqn (A2) requires
and at x = L, eqn (A5) dictates that
Denoting α = UL/D, we can readily derive that
, and
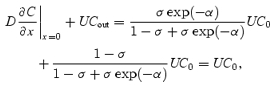
Equation (A6) therefore can be rewritten as
(main text eqn (5)). α = UL/D is a non-dimensional intermediate parameter, representing the ratio between the convectional and diffusional velocities of HA in the concentration polarization layer, i.e. the Péclet number within the polarization layer (cf. membrane), and it dictates the concentration profile of HA.
At x = L, defines Cm, as follows
| (A7) |
This is analogous to eqn (A9) in Coleman et al. (1999) for the steady-state Cm in a compartment of defined polarization layer thickness. For α≫ 1, Cm = C0/(1 −σ).
From eqn (A7), back-diffusion flux of the solute at x = 0,
| (A8) |
and the concentration of the solute downstream of the membrane, Cout=Cm(1 −σ), can be expressed as
| (A9) |
Total efflux of the solute from the system at x = 0 and x =L
 |
which is the total influx of the solute at x = 0, and the solute mass conservation is observed in steady state. For α≫ 1, back-diffusion of the solute at x = 0 approaches 0 and Cout = C0
References
- Asari A, Miyauchi S, Matsuzaka S, Ito T, Kominami E, Uchiyama Y. Molecular weight-dependent effects of hyaluronate on the arthritic synovium. Arch Histol Cytol. 1998;61:125–135. doi: 10.1679/aohc.61.125. [DOI] [PubMed] [Google Scholar]
- Barry SI, Gowman LM, Ethier CR. Obtaining the concentration-dependent diffusion coefficient from ultrafiltration experiments: application to hyaluronate. Biopolymers. 1996;39:1–11. [Google Scholar]
- Bhattacharjee S, Chen JC, Elimelech M. Coupled model of concentration polarisation and pore transport in crossflow nanofiltration. AIChE J. 2001;47:2733–2745. [Google Scholar]
- Bird RB, Stewart WE, Lightfoot EN. Transport Phenomena. New York: John Wiley & Sons; 1960. [Google Scholar]
- Brown TJ, Laurent UBG, Fraser JRE. Turnover of hyaluronan in synovial joints: elimination of labelled hyaluronan from the knee joint of the rabbit. Exp Physiol. 1991;76:125–134. doi: 10.1113/expphysiol.1991.sp003474. [DOI] [PubMed] [Google Scholar]
- Coleman PJ, Scott D, Mason RM, Levick JR. Characterization of the effect of high molecular weight hyaluronan on trans-synovial flow in rabbit knees. J Physiol. 1999;514:265–282. doi: 10.1111/j.1469-7793.1999.265af.x. [DOI] [PMC free article] [PubMed] [Google Scholar]
- Coleman PJ, Scott D, Ray J, Mason RM, Levick JR. Hyaluronan secretion into synovial cavity of rabbit knees and comparison with albumin turnover. J Physiol. 1997;503:645–657. doi: 10.1111/j.1469-7793.1997.645bg.x. [DOI] [PMC free article] [PubMed] [Google Scholar]
- Curry FE. Mechanical and thermodynamics of transcapillary exchange. In: Renkin EM, Michel CC, editors. Handbook of Physiology, section 2, The Cardiovascular System, The Microcirculation. IV. Bethesda MD USA: American Physiology Society; 1984. pp. 307–374. [Google Scholar]
- Dainty J. Water relations of plant cells. Adv Bot Res. 1963;1:279–326. [Google Scholar]
- Elias B, van Cleef J. High-shear membrane separation for process and wastewater treatment. Chem Eng. 1998;105:94. [Google Scholar]
- Geraldes V, Semiao V, Pinho MN. Hydrodynamics and concentration polarisation in NF/RO spiral wound modules with ladder-type spacers. Desalination. 2003;157:395–402. [Google Scholar]
- Gribbon P, Heng BC, Hardingham TE. The molecular basis of the solution properties of hyaluronan investigated by confocal fluorescence recovery after photobleaching. Biophys J. 1999;77:2210–2216. doi: 10.1016/S0006-3495(99)77061-X. [DOI] [PMC free article] [PubMed] [Google Scholar]
- Johnson M, Kamm R, Ethier CR, Pedley T. Scaling laws and the effects of concentration polarisation on the permeability of hyaluronic acid. Physicochem Hydrodyn. 1987;9:427–444. [Google Scholar]
- Jonsson AS, Jonsson B. Ultrafiltration of colloidal dispersions – a theoretical model of the concentration polarisation phenomena. J Colloid Interface Sci. 1996;180:504–518. [Google Scholar]
- Knight AD, Levick JR. Pressure–volume relationships above and below atmospheric pressure in the synovial cavity of the rabbit knee. J Physiol. 1982a;328:403–420. doi: 10.1113/jphysiol.1982.sp014273. [DOI] [PMC free article] [PubMed] [Google Scholar]
- Knight AD, Levick JR. Physiological compartmentation of fluid within the synovial cavity of the rabbit knee. J Physiol. 1982b;331:1–15. doi: 10.1113/jphysiol.1982.sp014361. [DOI] [PMC free article] [PubMed] [Google Scholar]
- Knight AD, Levick JR. The density and distribution of capillaries around a synovial cavity. Q J Exp Physiol. 1983;68:629–644. doi: 10.1113/expphysiol.1983.sp002753. [DOI] [PubMed] [Google Scholar]
- Knox P, Levick JR, McDonald JN. Synovial fluid – its mass, macromolecular content and pressure in major limb joints of the rabbit. Q J Exp Physiol. 1988;73:33–46. doi: 10.1113/expphysiol.1988.sp003121. [DOI] [PubMed] [Google Scholar]
- Kozinski AA, Lightfoot EN. Protein ultrafiltration: a general example of boundary layer filtration. AIChE J. 1972;18:1030–1040. [Google Scholar]
- Laurent TC, Ryan M, Pietruszkiewicz A. Fractionation of hyaluronic acid. The polydispersity of hyaluronic acid from the bovine vitreous body. Biochim Biophys Acta. 1960;42:476–485. doi: 10.1016/0006-3002(60)90826-x. [DOI] [PubMed] [Google Scholar]
- Levick JR. The influence of intra-articular hydrostatic pressure on trans-synovial fluid movement and on capsular expansion in rabbit knee joints. J Physiol. 1979;289:69–82. doi: 10.1113/jphysiol.1979.sp012725. [DOI] [PMC free article] [PubMed] [Google Scholar]
- Levick JR. An analysis of the interaction between extravascular plasma protein, interstitial flow and capillary filtration; application to synovium. Microvasc Res. 1994;47:90–125. doi: 10.1006/mvre.1994.1007. [DOI] [PubMed] [Google Scholar]
- Levick JR, McDonald JN. Synovial capillary distribution in relation to altered pressure and permeability in knees of anaesthetized rabbits. J Physiol. 1989;419:477–492. doi: 10.1113/jphysiol.1989.sp017881. [DOI] [PMC free article] [PubMed] [Google Scholar]
- Lu Y, Levick JR, Wang W. Flow dependence of hyaluronan reflection in synovial joint cavities. J Physiol. 2004;555:C71. [Google Scholar]
- Mabuchi K, Tsukamoto Y, Obara T, Yamaguchi T. The effect of additive hyaluronic acid on animal joints with experimentally reduced lubricating ability. J Biomed Mater Res. 1994;28:865–870. doi: 10.1002/jbm.820280805. [DOI] [PubMed] [Google Scholar]
- McDonald JN, Levick JR. Morphology of surface synoviocytes in situ at normal and raised joint pressures, studied by scanning electron microscopy. Ann Rheum Dis. 1988;47:232–240. doi: 10.1136/ard.47.3.232. [DOI] [PMC free article] [PubMed] [Google Scholar]
- McDonald JN, Levick JR. Hyaluronan reduces fluid escape rate from rabbit knee joint disparately from its effect on fluidity. Exp Physiol. 1994;79:103–106. doi: 10.1113/expphysiol.1994.sp003736. [DOI] [PubMed] [Google Scholar]
- McDonald JN, Levick JR. Effect of intra-articular hyaluronan on pressure–flow relation across synovium in anaesthetized rabbits. J Physiol. 1995;485:179–193. doi: 10.1113/jphysiol.1995.sp020722. [DOI] [PMC free article] [PubMed] [Google Scholar]
- Mason RM, Coleman PJ, Scott D, Levick JR. Role of hyaluronan in regulating joint fluid flow. In: Hascall VC, Kuettner KE, editors. The Many Faces of Osteoarthritis. BirkHauser-Verlag: Basel; 2002. pp. 179–187. [Google Scholar]
- Nettelbladt E, Sundblad L. On the significance of hyaluronic acid changes in the pathogenesis of joint effusions. Opusc Med. 1967;12:224–232. [Google Scholar]
- Nicolas S, Boulanouar I, Bariou B. Unstirred dead-end ultrafiltration: a method to determine diffusion coefficient or osmotic pressure for non-charged macromolecular solutions. J Memb Sci. 1995;103:19–30. [Google Scholar]
- Parker KH, Winlove CP. The macromolecular basis of the hydraulic conductivity of the arterial wall. Biorheology. 1984;21:181–196. doi: 10.3233/bir-1984-211-221. [DOI] [PubMed] [Google Scholar]
- Pedley TJ. Calculation of unstirred layer thickness in membrane transport. Quart Rev Biophys. 1983;16:115–150. doi: 10.1017/s0033583500005060. [DOI] [PubMed] [Google Scholar]
- Peppin SSL, Elliott JAW. Non-equilibrium thermodynamics of concentration polarisation. Adv Colloid Interface Sci. 2001;92:1–72. doi: 10.1016/s0001-8686(00)00029-4. [DOI] [PubMed] [Google Scholar]
- Reddy JN, Gartling DK. The Finite Element Method in Heat Transfer and Fluid Dynamics. 2. Boca Raton Florida: CRC Press; 2001. [Google Scholar]
- Roberts BJ, Unsworth A, Mian N. Models of lubrication in human hip joint. Ann Rheum Dis. 1982;41:217–224. doi: 10.1136/ard.41.3.217. [DOI] [PMC free article] [PubMed] [Google Scholar]
- Sabaratnam S, Arunan V, Coleman PJ, Mason RM, Levick JR. Molecular sieving of hyaluronan across synovial interstitial matrix is concentration dependent, 41st Spring Meeting of the British Microcirculation Society, Sheffield 2004 meeting. J Vasc Res. 2004a in press. [Google Scholar]
- Sabaratnam S, Mason RM, Levick JR. Molecular sieving of hyaluronan by synovial interstitial matrix and lymphatic capillary endothelium evaluated by lymph analysis in rabbits. Microvas Res. 2003;66:227–236. doi: 10.1016/j.mvr.2003.08.003. with Figures Erratum. [DOI] [PubMed] [Google Scholar]
- Sabaratnam S, Mason RM, Levick JR. Filtration rate dependence of hyaluronan reflection by joint-to-lymph barrier: evidence for concentration polarisation. J Physiol. 2004b;557:909–922. doi: 10.1113/jphysiol.2004.063529. [DOI] [PMC free article] [PubMed] [Google Scholar]
- Scott D, Coleman PJ, Mason RM, Levick JR. Direct evidence for partial reflection of hyaluronan molecules by the synovial lining of joints. J Physiol. 1998;508:610–623. doi: 10.1111/j.1469-7793.1998.619bq.x. [DOI] [PMC free article] [PubMed] [Google Scholar]
- Scott D, Coleman PJ, Mason RM, Levick JR. Concentration dependence of interstitial flow buffering by hyaluronan in synovial joints. Microvasc Res. 2000;59:345–353. doi: 10.1006/mvre.1999.2231. [DOI] [PubMed] [Google Scholar]
- Shirato M, Sambuichi M, Kato H. Internal flow mechanisms in filter cakes. AIChE J. 1965;15:405–409. [Google Scholar]
- Tarbell JM, Lever MJ, Caro CG. The effect of varying albumin concentration on the hydraulic conductivity of the rabbit common carotid artery. Microvasc Res. 1988;35:204–220. doi: 10.1016/0026-2862(88)90063-5. [DOI] [PubMed] [Google Scholar]
- Wijmans JG, Nakao S, van den Berg JWA, Troelstra FR, Smolders CA. Hydrodynamic resistance of concentration polarisation layers in ultrafiltration. J Memb Sci. 1985;22:117–135. [Google Scholar]
- Wik KO, Comper WD. Hyaluronate diffusion in semidilute solutions. Biopolymers. 1982;21:583–599. doi: 10.1002/bip.360210308. [DOI] [PubMed] [Google Scholar]
- Zhang W, Ethier CR. Direct pressure measurements in a hyaluronan ultrafiltration concentration polarisation layer. Colloids Surf A: Physicochem Eng Asp. 2001;180:63–73. [Google Scholar]