

Abstract
Spontaneous membrane voltage oscillations were found in 27 of 130 isolated frog saccular hair cells. Voltage oscillations had a mean peak-to-peak amplitude of 23 mV and a mean oscillatory frequency of 4.6 Hz. When compared with non-oscillatory cells, oscillatory cells had significantly greater hyperpolarization-activated and lower depolarization-activated current densities. Two components, the hyperpolarization-activated cation current, Ih, and the K+-selective inward-rectifier current, IK1, contributed to the hyperpolarization-activated current, as assessed by the use of the IK1-selective inhibitor Ba2+ and the Ih-selective inhibitor ZD-7288. Five depolarization-activated currents were present in these cells (transient IBK, sustained IBK, IDRK, IA, and ICa), and all were found to have significantly lower densities in oscillatory cells than in non-oscillatory cells (revealed by using TEA to block IBK, 4-AP to block IDRK, and prepulses at different voltages to isolate IA). Bath application of either Ba2+ or ZD-7288 suppressed spontaneous voltage oscillations, indicating that Ih and IK1 are required for generating this activity. On the contrary, TEA or Cd2+ did not inhibit this activity, suggesting that IBK and ICa do not contribute. A mathematical model has been developed to test the interpretation derived from the pharmacological and biophysical data. This model indicates that spontaneous voltage oscillations can be generated when the electrophysiological features of oscillatory cells are used. The oscillatory behaviour is principally driven by the activity of IK1 and Ih, with IA playing a modulatory role. In addition, the model indicates that the high densities of depolarization-activated currents expressed by non-oscillatory cells help to stabilize the resting membrane potential, thus preventing the spontaneous oscillations.
Hair cells of the inner ear transduce movements of their hair bundle into electrical signals. Such a process involves the opening of mechanotransduction channels, hair cell depolarization, and basolateral synaptic release, resulting in a modulation of the rate of action potential discharge of the postsynaptic, afferent nerve fibres. When stimulated with depolarizing currents, the membrane potential of several types of hair cells undergoes damped sinusoidal oscillations, usually referred to as electrical resonance. In lower vertebrates this process contributes to frequency discrimination of the sensory organ (reviewed in Fettiplace & Fuchs, 1999). This electrical response to injected current is mainly determined by the interplay between a voltage-activated Ca2+ current and voltage- or Ca2+-activated K+ currents (Hudspeth & Lewis, 1988b; Wu et al. 1995). In addition, many lower vertebrate hair cells display spontaneous fluctuations of their resting membrane potential in the absence of external stimuli (Crawford & Fettiplace, 1980; Ashmore, 1983; Ospeck et al. 2001), and this activity has sometimes been linked to periodic interval histograms in the spontaneous firing of afferent fibres (Manley, 1979; Crawford & Fettiplace, 1980; Temchin, 1988). This spontaneous activity is usually found to be poorly coherent, to have a low peak-to-peak voltage amplitude (up to 10 mV) and high frequency (in the range 11–85 Hz in a frog saccular semi-intact preparation, Ashmore, 1983). In frog basilar papilla hair cells it has been found that this incoherent and low-amplitude spontaneous activity arises from the interaction of voltage-activated Ca2+ and Ca2+-activated K+ currents (Ospeck et al. 2001), as found for the stimulus-evoked electrical resonance. Here we present a novel form of spontaneous voltage oscillations recorded from ∼20% of isolated frog saccular hair cells. This activity differs markedly from that previously described, having higher coherence and voltage amplitude, lower oscillatory frequency, and different ionic basis.
The present investigation focused on the characterization of the spontaneous voltage oscillations, and the underlaying ionic basis. Because of the dissociated cell preparation, we did not address their functional role. Frog saccular hair cells possess a variety of voltage-activated conductances. Four depolarization-activated currents (the voltage-activated Ca2+ (ICa) and K+ (IDRK) currents, and the transient (IBKT) and sustained (IBKS) BK currents) are thought to underlie their electrical resonance (Ashmore, 1983; Lewis & Hudspeth, 1983; Armstrong & Roberts, 1998; Catacuzzeno et al. 2003a,b). An additional fast transient voltage-activated K+ current (IA) has been reported, but its physiological role is questionable, due to its high degree of inactivation at the resting potential (Hudspeth & Lewis, 1988a; Catacuzzeno et al. 2003b). Two hyperpolarization-activated currents, the K+-selective, inward-rectifier (IK1) and the cation-selective (Ih) currents have also been reported, and are thought to contribute to setting the resting membrane potential (Holt & Eatock, 1995). Our electrophysiological data and modelling study show that the activity of IK1, Ih, and IA shapes the spontaneous voltage oscillations, while the other depolarization-activated currents have a stabilizing action on the membrane potential of non-oscillatory cells, thus preventing the spontaneous oscillations.
Methods
Hair cell preparation
Frogs (Rana esculenta) obtained from local suppliers were chilled and decapitated according to the Animal Experimentation guidelines of the University of Perugia. The dissociation of hair cells has been previously described (Holt et al. 2001; Catacuzzeno et al. 2003a). Briefly, the saccular epithelium was removed from the organ, and incubated for 3 min in low-Ca2+ solution containing 0.25 mg ml−1 protease VIII (P-5380, Sigma). The epithelium was then transferred to a low-calcium solution containing 0.5 mg ml−1 BSA for 15 min to stop the enzymatic reaction, and subsequently into a Petri dish where the hair cells were mechanically dissociated by gently rubbing the saccular epithelium with a fine tungsten filament. For electrophysiological recordings, hair cells were transferred to concanavalin A-coated Petri dishes to allow cell adhesion.
Electrophysiology
Voltage responses and macroscopic currents were recorded under current-clamp and voltage-clamp mode, respectively, using the perforated-patch method (Horn & Marty, 1988). Borosilicate pipettes (Hilgenberg GmbH, Malsfeld, Germany), pulled with a programmable puller (PUL-100; WPI, Sarasota, FL, USA) were used. Their resistance ranged between 3 and 6 MΩ when filled with standard pipette solution. Electrical access to the cytoplasm was obtained by adding amphotericin B to the pipette solution. Stock solutions of amphotericin B (A-4888, Sigma; 50 mg ml−1 in DMSO) were stored at −20°C for a maximum of 8 h. The working solution of amphotericin B (4 μl of stock per ml of pipette solution) was prepared approximately every 40 min, and kept at 0°C in the dark. A series resistance, Rs, of 20–30 MΩ (measured using the Membrane Test routine of the pClamp software by applying 5 mV voltage steps, 5 ms in duration, from a holding potential of −70 mV) was usually achieved within 15 min of attaining the cell-attached configuration. The following findings indicated that the only current that could potentially activate within the 5-ms step of the voltage pulse around −70 mV, the fast activating IK1, did not introduce a measurable bias in the estimation of Rs: (i) no significant difference was found in the mean Rs estimated in cells with, and in cells without IK1; (ii) in four cells where Rs was assessed before and after the simultaneous block of IK1 and Ih (using Ba2+ and ZD-7288), no significant difference was found; (iii) good capacitive compensation was always verified by assessing the magnitude of current transients at the beginning of a depolarizing step. Although at least 50% of the Rs was compensated, a significant uncompensated Rs component remained (ranging between 10 and 15 MΩ), which would introduce significant errors in the applied (command) voltage, Vcom, when large currents were recorded. Vcom was thus always corrected for errors due to Rs by subtracting I Rs (i.e. the amount of voltage drop across Rs, where I is the current being measured):
The voltage applied was also corrected for the liquid junction potential, estimated to be ∼−13 mV under our recording conditions using the method developed by Neher (1992). Currents were amplified with a List EPC-7 amplifier (List Medical Instruments, Darmstadt, Germany), and digitized with a 12 bit A/D converter (DigiData1200 interface; Axon Instruments Inc., Union City, CA, USA), or alternatively amplified and digitized with the EPC-10 amplifier (Heka Electronik, Germany). The pClamp software package (version 7.0; Axon Instruments Inc.) or the PULSE software (Heka Electronik, Germany) were used on a Compaq Pentium PC for generating the command voltage pulses, recording and archiving the currents, and preliminary analysis of the data. For on-line data collection, current signals were normally filtered at 3 kHz and sampled at 25–50 μs point−1. All recordings and procedures were performed at room temperature (18–22°C). All frog saccular hair cells studied here were first monitored under current-clamp mode, with no applied current, to assess whether they oscillated. Recording was then switched to the voltage-clamp mode to assess the biophysical and/or pharmacological properties of the voltage-activated currents. The cells used in this study had a clear cylindrical or club-shaped morphology. Cells with round-shaped morphology and grainy appearance, usually associated with unhealthy or deteriorated conditions, were discarded. The cell membrane capacitance measured 11.3 ± 2.1 pF (mean ± s.d.; n = 18; range 9.0–15.7 pF) in oscillatory cells, and 12.8 ± 3.1 pF (mean ± s.d.; n = 35; range 6.8–17.0 pF) in non-oscillatory cells. These values are not significantly different (P > 0.05).
Solutions and pharmacological agents
The low-Ca2+ solution used during the dissociation procedure contained (mm): 130 NaCl, 2.5 KCl, 0.8 CaCl2, 5 MgCl2, 5 MOPS, 2 EGTA, 3 glucose, 5 pyruvic acid, 1 Na-ascorbate. The physiological salt solution (PSS) used during recordings contained (mm): 112 Na+, 2 K+, 1.8 Ca2+, 0.7 Mg2+, 119 Cl−, 3 d-glucose, 5 MOPS. Solutions containing TEA were prepared by equimolar substitution for NaCl. The standard pipette solution contained (mm): 114 K+, 114 aspartate, 0.08 Ca2+, 4 Cl−, 2 Mg2+, 5 MOPS, 1 EGTA. The intracellular solution was chosen to be slightly hypotonic to assist the perforated-patch recording. All solutions were adjusted to a pH of 7.25. All reagents were from Sigma (St Louis, MO, USA), with the exception of ZD-7288 which was obtained from Tocris (Tocris Cookson Inc., UK).
Data analysis
The time course of the current, as well as kinetic and steady-state parameters were fitted with the indicated equations by using the Simplex algorithm incorporated in Microcal Origin 4.1. The χ2 statistic was used as an indicator of the quality of the fit (Dempster, 1993). χ2 values for the fits to the experimental data shown in the Results section correspond to levels of significance probability lower than 0.05 (the degrees of freedom (d.f.) being given by nobs – np, where nobs is the number of experimental points used in the fitting procedure, and np is the number of free parameters). Normalized power spectra and autocorrelation functions on spontaneous voltage oscillations were assessed by using built-in functions of Microcal Origin 4.1. Modelling of membrane potential changes was performed with programs implemented in C, solving eqns (A1)–(A30) by a fourth-order Runge–Kutta algorithm (Press et al. 1992) with a fixed step size of 10 μs. A 10-times reduction in the time step used for the computation did not change the simulated curves appreciably. Assessment of current densities at specified membrane potentials was done by taking into account voltage errors due to series resistance. Specifically, current estimation was made by linear interpolation between the current points at the two closest voltages on the corrected I–V relationship. Results are expressed as mean ± s.e.m., unless stated otherwise. Statistical differences between means were analysed using the t test which does not assume equal variances. Where appropriate the significance level of probability (P) for the difference between mean values is given.
Results
Current clamp recordings
Under current-clamp mode with no applied command current, about 20% of the saccular hair cells tested (27 out of 130) displayed spontaneous voltage oscillations, an example of which is shown in Fig. 1A. The peak-to-peak amplitude of these oscillations ranged from 9.1 to 33.6 mV, with a mean of 23 ± 6.3 mV (mean ± s.d.; n = 27), and the oscillatory frequency (defined as the peak frequency in the power spectrum, cf. Fig. 1B) varied from 2.3 to 11.3 Hz, with a mean of 4.6 ± 1.9 Hz (mean ± s.d.; n = 27). The oscillatory activity was usually strongly coherent, as demonstrated by the autocorrelation function shown in the inset of Fig. 1B. There was some variability in the shape of voltage oscillations. In some cells the depolarizing and hyperpolarizing phases displayed markedly different rates, whereas in other cells voltage oscillations had a more sinusoidal shape, with similar rates in both depolarizing and hyperpolarizing directions.
Figure 1. Features of spontaneous voltage oscillations in frog saccular hair cells.

A, current-clamp recording of a frog saccular hair cell showing spontaneous membrane voltage oscillations at rest. B, normalized power spectrum and autocorrelation function (inset) for the voltage recording shown in A. C, voltage traces obtained from an oscillatory cell upon injection of the indicated holding current. D, plot of the oscillatory frequency (circles) and peak-to-peak voltage amplitude (squares) versus the injected current for the cell shown in C. E, current-clamp recording of a non-oscillatory cell at rest. The trace in the lower part of the panel represents a time and voltage expansion of a portion of the recording, showing the presence of small voltage fluctuations. F, normalized power spectrum and autocorrelation function (inset) for the voltage trace shown in E.
The oscillatory activity appeared to be a property of the resting state of the cell, its peak-to-peak amplitude being maximal with no applied command current, and decreasing upon application of both positive and negative injected currents. An example of this feature is shown in Fig. 1C and D, where an oscillatory cell was subjected to different holding currents. It can be seen that oscillations could be discerned only for zero and ±10 pA holding currents, vanishing completely at more positive or negative injected currents. Figure 1C and D also show that the oscillatory frequency decreases slightly with increasing positive injected currents. This small voltage dependence, seen in all oscillatory cells tested (n = 5), is contrary to that observed for the electrical resonance recorded from the same preparation (Catacuzzeno et al. 2003a), suggesting that distinct mechanisms underpin these two forms of electrical response.
Three morphologically different cell populations have been described in the frog saccular epithelium, differing in the length to apical width (LAD) ratio (Chabbert, 1997). The electrophysiological recordings presented in this study were made on central cylindrical (LAD lower than 4.5) and central club-shaped (LAD of 4.5–8) cells, both located in the central part of the saccular macula. We found a significant correlation between the incidence of spontaneous oscillatory activity and cell shape, with 70% (14 out of 20) of the central club-shaped cells, but only about 14% (9 out of 64) of central cylindrical cells displaying spontaneous oscillations.
In most saccular hair cells lacking spontaneous voltage oscillations, fluctuations of the membrane potential of smaller amplitude and much higher frequency were present (Fig. 1E). This activity resembles the resting resonance described in frog saccular (Ashmore, 1983) and basilar papilla (Ospeck et al. 2001) hair cells, and could be readily discriminated from the spontaneous voltage oscillations, having much smaller peak-to-peak voltage amplitudes, higher characteristic frequencies and lower coherence (Fig. 1F). Despite the presence of these voltage fluctuations, we refer to these cells as non-oscillatory, to distinguish them from those displaying coherent and high-amplitude spontaneous oscillatory activity, which is the focus of this study.
Voltage-clamp recordings
To understand the ionic basis of the spontaneous voltage oscillations, we compared the characteristics of voltage-activated currents of 18 oscillatory cells with those found in 35 non-oscillatory cells (i.e. cells showing either a stable resting membrane potential, or the small voltage fluctuations shown in Fig. 1E). Both depolarization- and hyperpolarization-activated currents were found to be markedly different in amplitude and temporal shape in these two cell populations (Fig. 2). In oscillatory cells 100 ms depolarizing voltage steps from a holding potential of −70 mV evoked, after a small blip of inward current, fully sustained outward currents (Fig. 2A, upper current traces). In non-oscillatory cells this protocol evoked a partially inactivating outward current with a more complex shape (Fig. 2B, upper current traces). The amplitude of these currents differed markedly, with a mean current density at −30 mV (measured at the end of the 100 ms depolarizing step) of 32.6 ± 4.3 pA pF−1 in oscillatory cells (n = 18) and of 76.5 ± 6.1 pA pF−1in non-oscillatory cells (n = 35; Fig. 2D). These current densities are significantly different (P < 0.01). A second, marked difference in current amplitude was found for the hyperpolarization-activated currents in the two cell populations (Fig. 2A and B, lower current traces). Mean current densities recorded on stepping to −120 mV were −80.8 ± 5.3 pA pF−1in oscillatory cells (n = 18) and −30.5 ± 3.9 pA pF−1 in non-oscillatory cells (n = 35; Fig. 2D; P < 0.01). The correlation between voltage-activated current amplitudes and the oscillatory activity is illustrated in Fig. 2C, where the current density at −30 mV is plotted against the current density at −120 mV for individual cells. Oscillatory cells are clustered in the lower-right quadrant of the plot, corresponding to high hyperpolarization- and low depolarization-activated current densities. A further difference in the macroscopic currents of the two cell populations is shown in Fig. 2D. The mean I–V relationships show that the flat region around the zero-current potential is more extended in oscillatory cells compared to non-oscillatory cells, due to a higher activation threshold for depolarization-activated currents. This behaviour is highlighted in the inset of Fig. 2D, where an expansion of the mean I–V relationships around the oscillatory voltage range (indicated by the grey bar) is made. Whereas the depolarization-activated currents of non-oscillatory cells slightly activate in the depolarized region of the oscillatory range, those of oscillatory cells activate at more depolarized membrane potentials, suggesting that their contribution to the oscillatory activity is minimal.
Figure 2. Macroscopic currents of oscillatory and non-oscillatory cells.

A and B, families of current traces obtained by either depolarizing (upper current trace families) or hyperpolarizing (lower current trace families) voltage pulses from a holding potential of −70 mV, in 10 mV steps, for an oscillatory (A) and a non-oscillatory (B) cell. The voltage traces in the upper part of each panel represent the resting current-clamp behaviour of the corresponding cells. C, plot of the current density at −30 mV versus current density at −120 mV for 53 saccular hair cells. Each cell was tested for the presence of spontaneous voltage oscillations under current-clamp mode, and oscillatory and non-oscillatory cells are indicated in the plot by closed and open symbols, respectively. D, mean current density versus voltage relationship assessed from 18 oscillatory and 35 non-oscillatory cells. Inset, expansion of the mean I–V relationships in the voltage range of the oscillations. The grey bar indicates the mean minimum and maximum voltages found in the 18 oscillatory cells. Where not shown, s.e.m. values are smaller than the symbol size.
Dissection of ionic currents in oscillatory and non-oscillatory cells
Pharmacological dissection and biophysical protocols were applied in order to identify the current components responsible for the observed differences in the total current amplitude in oscillatory and non-oscillatory cells. The voltage protocols adopted for current dissection were in accordance with previous studies on the same preparation (Holt & Eatock, 1995; Armstrong & Roberts, 1998, 2001; Catacuzzeno et al. 2003a,b).
Hyperpolarization-activated currents
Two hyperpolarization-activated currents have been reported in frog saccular hair cells, IK1 and Ih (Holt & Eatock, 1995). To pharmacologically dissect these currents we either used 100 μm Ba2+, an agent shown to be highly selective for IK1 over Ih in these cells (Holt & Eatock, 1995), or 100 μm ZD-7288, a selective inhibitor of Ih in both cardiac pacemaker and neuronal preparations (BoSmith et al. 1993; Gasparini & DiFrancesco, 1997). In all oscillatory cells tested, 100 μm Ba2+ strongly inhibited the hyperpolarization-activated currents (Fig. 3A). The slowly activating inward current remaining after application of Ba2+ was irreversibly suppressed by the addition of ZD-7288 (100 μm) to the bathing solution (Fig. 3A). In the presence of both Ba2+ and ZD-7288, only a small, time independent, leakage current was recorded (see Fig. 3A and C). These results indicate that both IK1 and Ih are present in oscillatory cells. The effect of 100 μm Ba2+ on non-oscillatory cells was much more variable. The two extremes, where the Ba2+-sensitive current was virtually absent (left traces), and where it was of comparable magnitude to that found in oscillatory cells (right traces), are shown in Fig. 3B. Similarly to oscillatory cells, all non-oscillatory cells possessed a Ba2+-insensitive and ZD-7288-sensitive component of the hyperpolarization-activated current, and a leakage current (Fig. 3B). IK1 and Ih, identified using these pharmacological manipulations, were measured for several cells belonging to both populations. The mean results are presented in Fig. 3D. Significant differences were found for both Ih and IK1 in the two cell populations at −120 mV of applied potential. In particular, the Ba2+-sensitive component was markedly higher in oscillatory cells, suggesting that the principal difference in the hyperpolarization-activated current found in the two cell populations is due to different mean IK1 densities.
Figure 3. Pharmacological dissection of the hyperpolarization-activated currents in oscillatory and non-oscillatory cells.

A,B, current traces obtained with hyperpolarizing steps from −60 mV to −120 mV in an oscillatory (A) and two non-oscillatory (B) cells, in control conditions, and after bath application of 100 μm Ba2+ or 100 μm Ba2+ plus 100 μm ZD-7288, in succession. C, I–V relationship of an oscillatory cell taken under control conditions (•), in the presence of 100 μm Ba2+ (▪), and in the presence of 100 μm Ba2+ +100 μm ZD-7288 (□). D, bar histogram of the IK1 and Ih components of the inward current at −120 mV obtained from 8 oscillatory and 12 non-oscillatory cells. **P < 0.01.
Depolarization-activated currents
Frog saccular hair cells have been previously shown to possess five depolarization-activated currents: IBKS, IBKT, IDRK, IA and ICa (Hudspeth & Lewis, 1988a; Armstrong & Roberts, 1998, 2001; Catacuzzeno et al. 2003a,b). We assessed the contribution of each of these components in both oscillatory and non-oscillatory cells. IDRK was assessed using 1 mm 4-AP, previously shown to be selective for this current (Armstrong & Roberts, 1998; Catacuzzeno et al. 2003b; cf. Fig. 4A and B). IBKS and IBKT were determined from the sustained and peak TEA (6 mm)-sensitive components (at this concentration TEA has been shown to block BK but not Kv currents in these cells; Armstrong & Roberts, 1998; Catacuzzeno et al. 2003b; cf. Fig. 4A and B). ICa was estimated from the inward peak current in the presence of both TEA (6 mm) and 4-AP (1 mm; cf. Fig. 4A and B). Finally, IA was assessed as the difference between currents evoked by depolarizing pulses following a 200 ms prepulse to either −50 mV or −110 mV (cf. Fig. 4C and D and Catacuzzeno et al. 2003b). The results of these procedures are shown in Fig. 4E. It can be seen that all the depolarization-activated currents recorded from oscillatory cells are of lower magnitude than those of non-oscillatory cells, and these differences are particularly high for IDRK, IBKT and ICa. The IA density we recorded for non-oscillatory cells is significantly higher than that we have reported previously for cylindrical hair cells from the same preparation (Catacuzzeno et al. 2003b). Differences in the composition of the extracellular solution (for example the low Ca2+ concentration used in our previous study) may be the reason for such a difference.
Figure 4. Pharmacological dissection of the depolarization-activated currents in oscillatory and non-oscillatory cells.

A and B, current traces recorded from an oscillatory (A) and a non-oscillatory (B) cell, both stimulated with a depolarizing step to −30 mV from a holding potential of −70 mV, in control conditions, after bath application of 4-AP (1 mm), and TEA (6 mm) plus 4-AP (1 mm), in succession. C,D, current traces of an oscillatory (C) and a non-oscillatory (D) cell obtained by a 100 ms depolarizing pulse to −30 mV preceded by a 200 ms prepulse to either −110 mV or −50 mV. TEA (6 mm) was present throughout the experiments to block the BK current and thus reduce voltage errors related to series resistance. E, bar histogram showing the depolarization-activated current densities in oscillatory and non-oscillatory cells. Sustained BK current was assessed from the TEA-sensitive current density at 50 ms from the beginning of the depolarizing step to −30 mV from a holding potential of −70 mV. The transient BK current was assessed as the difference between the peak (at 2 ms) and sustained (at 50 ms) TEA-sensitive current density. IDRK was estimated from the 4-AP-sensitive current at −30 mV (from experiments similar to those shown in A and B). The number of cells used for each estimation is reported. **P < 0.01. Inset, mean, normalized (at −20 mV) I–V relationships for IBKS, assessed as the TEA-sensitive component at 50 ms from the beginning of the depolarizing step, in 7 oscillatory and 11 non-oscillatory cells.
The mean, normalized I–V relationships for the TEA-sensitive component in the two cell populations is displayed in the inset of Fig. 4E. It is apparent that, in addition to a lower current density, the IBKS of oscillatory cells also have a more depolarized threshold of activation. This feature explains the more depolarized activation threshold of the total voltage-activated current in oscillatory cells (cf. Fig. 2D).
Pharmacology of spontaneous voltage oscillations
The actions of inhibitors of voltage-activated ion currents were then tested in current-clamp mode, to evaluate the contribution of each conductance to spontaneous oscillatory activity. In four oscillatory cells, bath application of 100 μm Ba2+ abolished voltage oscillations, accompanied by a marked membrane potential depolarization (Fig. 5A). An inhibitory effect on the oscillatory activity was also observed following bath application of the Ih-selective inhibitor ZD-7288 (100 μm, n = 4; Fig. 5B). In presence of ZD-7288, the hair cell resting potential became bistable, with sudden jumps between hyperpolarized (∼–85 mV) and relatively depolarized (∼–50 mV) levels (Fig. 5B, right trace). However, such activity did not display any dominant frequency, typical of oscillatory activity. Bath application of 6 mm TEA, which inhibits most of the depolarization-activated K+ current in oscillatory cells (cf. Fig. 4), did not inhibit voltage oscillations (n = 5; Fig. 5C), in accordance with a threshold of BK current activation in these cells not overlapping with the oscillatory voltage range (cf. Fig. 4E). In three out of five cells tested, TEA significantly reduced the oscillatory frequency, and slightly increased the peak-to-peak amplitude (cf. Fig. 5C). This effect may be due to the small, but significant, blocking action of TEA on IK1 (data not shown; see also Goodman & Art, 1996). The possibility of a contribution of IBK to the oscillatory activity can be dismissed since in two oscillatory cells bath application of 100 μm Cd2+ (that blocks voltage-activated Ca2+ influx and the consequent activation of IBK; Armstrong & Roberts, 2001; Catacuzzeno et al. 2003a), did not significantly affect voltage oscillations (Fig. 5D). This result also suggests that ICa is not essential for the oscillatory activity. Interestingly, in about half of non-oscillatory cells (five out of nine), TEA application resulted in the appearance of membrane potential instability (Fig. 5F), suggesting that IBK has a stabilizing role on the membrane potential in these cells. In three out of five hair cells, voltage oscillations with an amplitude comparable to those seen in oscillatory cells were recorded (Fig. 5F); in the remaining two cells all-or-none action potentials were superimposed on these voltage oscillations (data not shown). Together, these results indicate that IK1 and Ih are central players in the generation of the spontaneous voltage oscillations. Due to the lack of selective inhibitors of IA, we could not pharmacologically probe the contribution of this current to the oscillatory activity. We have, however, addressed this issue using a modelling approach, as described in the Model results section, and found that this current plays a modulatory role on the amplitude and frequency of voltage oscillations.
Figure 5. Sensitivity of the oscillatory activity to inhibitors of voltage-activated currents.

A–E, effect of bath application of 100 μm Ba2+ (A), 100 μm ZD-7288 (B), 6 mm TEA (C), 100 μm Cd2+ (D) or 100 μm gentamicin (E) on the oscillatory activity. F, voltage activity at the resting membrane potential of a non-oscillatory cell in control conditions and after addition of 6 mm TEA, showing the appearance of an oscillatory activity after drug application.
Previous studies on frog saccular hair cells have described spontaneous hair bundle oscillations with frequencies comparable to those observed here for spontaneous voltage oscillations (Martin & Hudspeth, 1999; Martin et al. 2003). To test the hypothesis that an oscillatory mechanotrasduction current originating from hair bundle oscillations may contribute to the oscillatory voltage activity, we assessed the effect of gentamicin (100 μm), an agent known to inhibit bundle motility (Martin et al. 2003). Gentamicin had no action on either the frequency or the amplitude of the voltage oscillations (n = 2; Fig. 5E), suggesting that changes in the mechanotransduction current due to spontaneous bundle movements are not responsible for the voltage oscillations. Moreover, oscillatory bundle movements would not be expected in the 1.8 mm external [Ca2+] we employed (Martin et al. 2003).
Biophysical study of IK1 and Ih
The results reported above suggest that IK1 and Ih are the principal currents responsible for the generation of the spontaneous voltage oscillations. To better understand the role of these currents during voltage oscillations we assessed their biophysical properties, and built approximate kinetic models that will be used in the next section to model the voltage oscillatory activity. Although a biophysical description of both these currents in frog saccular hair cells has been previously reported (Holt & Eatock, 1995), we considered it necessary to reassess their main properties because of differences in cell isolation and recording method. The study of Holt & Eatock (1995) used hair cells isolated with the proteolytic enzyme papain, which has subsequently been demonstrated to alter the properties of several ion currents in this preparation (Armstrong & Roberts, 1998; Catacuzzeno et al. 2003a). In addition, Holt & Eatock (1995) used the whole-cell configuration, while we used the perforated patch, which will preserve the intracellular factors likely to modulate these currents (for example cAMP for Ih, or Mg2+ and polyamines for IK1; see for example, Ishihara et al. 2002; Accili et al. 2002).
IK1
IK1 was studied in both oscillatory and non-oscillatory cells in the presence of 100 μm ZD-7288 in the bathing solution to block Ih, whose activation range overlaps with that of IK1. Figure 6A shows a typical family of current traces evoked by stepping the membrane voltage, from a holding potential of −70 mV, from −170 to −60 mV. The reversal potential of the current was estimated from the intersection of the instantaneous and steady-state I–V relationships (data not shown), a procedure that eliminates the leak contribution (cf. Holt & Eatock, 1995). The mean reversal potential obtained on three hair cells was −95 ± 4 mV, close to the K+ equilibrium potential under our recording conditions (−103 mV), suggesting that IK1 is very selective for K+. Figure 6B shows the mean, normalized I–V relationship of the Ba2+-sensitive current, showing that IK1 carries a small, but significant, outward current at membrane potentials positive to the K+ equilibrium potential. The data could be well fitted by a simple two-state kinetic model with voltage slope of 11 mV and V½ of −110 mV (solid line in Fig. 6B; an ohmic instantaneous conductance was considered).
Figure 6. Biophysical study of IK1.

A, family of current traces obtained by voltage pulses from −170 to −60 mV in 10 mV steps from a holding potential of −70 mV. The bath solution contained 100 μm ZD-7288 to remove Ih. B, mean, normalized I–V relationship (taken at 100 ms from the beginning of the depolarizing steps) obtained from four cells similar to that shown in A. Data points were obtained by measuring the current amplitude at the end of the hyperpolarizing steps at different membrane potentials. Current amplitudes were leak corrected by subtracting currents obtained after addition of the IK1 blocker Ba2+ (100 μm) at the end of the experiment. The continuous line is a fit of the I–V data with the relationship IK1 = A (V + 95)/(1 + exp((V − V½)/k)), giving V½ = −110.8 mV, and k = 11 mV. Inset, mean, normalized I–V relationship showing a wider membrane potential range. C, plots showing the fit of IK1 activation (upper plot) and deactivation (lower plot) time courses with mono-exponential and bi-exponential functions, respectively. Open symbols represent experimental points and the continuous lines the fits. D, plot of the activation (closed symbols) and deactivation (open symbols) time constants versus membrane potential for IK1. Data were obtained from three different recordings similar to those shown in panel C. The continuous lines represent the fit of the experimental data with the exponential relationship τ = τ(0 mV) exp((V – V0)/VT) + KT. The best fit parameters were: fast deactivation time constant: KT = 0.04 ms, VT = −43.8 mV, V0 = −120 mV, τ(0 mV) = 0.7 ms; slow deactivation time constant: KT = 0.04 ms, VT = −28 mV, V0 = −120 mV, τ(0 mV) = 14.1 ms; activation time constant: KT = 0.17 ms, VT = 30.5 mV, V0 = −80 mV, τ(0 mV) = 7.5 ms. Inset, plot of the fractional contribution of the fast deactivation time constant (afast) versus membrane potential. The continuous line represents the fit of the experimental data with a linear relationship of the form afast = mV + q. The best fit parameters are m = 0.0042 mV−1 and q = 1.03.
The activation time course of IK1 upon hyperpolarizing steps from a holding potential of −70 mV was mono-exponential, after a small, but significant, instantaneous component (Fig. 6C, upper current traces). The time constant of activation decreased from 2.15 ± 0.75 ms at −120 mV to 0.59 ± 0.09 ms at −170 mV. This voltage dependence could be well described by an exponential relationship of the form
with best fit parameters: τ(0 mV) = 7.5 ms, V0 = −80 mV, VT = 30.5 mV, and KT = 0.17 ms (Fig. 6D, closed symbols and superimposed solid line). The deactivation time course at potentials more positive than the current reversal potential was bi-exponential (Fig. 6C, lower current trace family). Both τfast and τslow were voltage dependent, measuring 0.38 ± 0.17 ms and 4.8 ± 0.24 ms at −90 mV, and 0.23 ± 0.14 ms and 1.96 ± 0.66 ms at −65 mV, respectively (see open symbols in Fig. 6D). The deactivation time constants as functions of voltage could be well described by exponential relationships, with the following best fit parameters. τfast: KT = 0.04 ms, VT = −43.8 mV, V0 = −120 mV and τ(0 mV) = 0.7 ms; τslow: KT = 0.04 ms, VT = −28 mV, V0 = −120 mV and τ(0 mV) = 14.1 ms. The relative contribution of the fast to the slow component (afast) was also slightly voltage dependent (see inset to Fig. 6D).
Ih
Ih was studied in presence of 100 μm Ba2+ to eliminate IK1 (cf. Fig. 7A). The Ih reversal potential, obtained by extrapolation from a linear fit of the instantaneous ZD-7288-sensitive I–V relationship, had a mean value of −44.8 ± 1.2 mV (n = 3; data not shown). We found that a modified Hodgkin–Huxley (HH) model, already proposed to describe Ih in papain-isolated frog saccular hair cells (Holt & Eatock, 1995), could adequately reproduce the main features of this current. This model considers three independent activation gates, two of which need to be in the permissive state to open the channel, as summarized by the following kinetic scheme:
Figure 7. Biophysical study of Ih.

A, family of current traces obtained by hyperpolarizing voltage pulses from −140 to −60 mV in 10 mV steps from a holding potential of −60 mV. The bath solution contained 100 μm Ba2+ to remove IK1, 6 mm TEA and 1 mm 4-AP to remove the depolarization-activated currents. B, mean steady-state I–V relationship obtained from four cells similar to that shown in A, by measuring currents at the end of the hyperpolarizing steps at different membrane potentials. Current amplitudes were leak corrected by subtracting currents obtained after addition of the Ih blocker ZD-7288. The solid line represents the fit of the steady-state I–V with the relationship: Ih(SS) = gh (V – EK) [3Pinf2 (1 − Pinf) + Pinf3], with Pinf = 1/(1 + exp((V − V½)/k)). The best fit parameters were V½ = −87 mV, k = 16.7 mV. C, plots showing the fit of Ih activation (upper plot) and deactivation (lower plot) time courses with the equation: Ih = A + B (3p2 (1 − p) + p3), with p = pi + (pinf − pi) exp(−t/τ). Open symbols represent experimental points and the solid lines the fits. The activation time courses were obtained by stepping the membrane potential from −80 to −140 mV, in 10 mV steps. The deactivation time courses were obtained by preconditioning the membrane potential to −120 mV, before stepping the voltage from −90 to −65 mV, in 5 mV steps. The holding potential was −60 mV. D, plot of the activation (open symbols) and deactivation (closed symbols) time constants versus membrane potential for Ih. Data were obtained from three recordings similar to those shown in C. The solid line represents the fit of the experimental data with the relationship τ = P1 + P2 exp(−[(V − P3)/P4]2. The best fit parameters were: P1 = 63.7 ms, P2 = 135.7 ms, P3 = −91.4 mV and P4 = 21.2 mV
 |
scheme (1) |
where α and β are the rate constants for each independent gate to switch into the permissive or non-permissive state, respectively. Figure 7B shows a mean, normalized I–V relationship of the ZD-7288-sensitive current component. The solid line in Fig. 7B shows the fit of the experimental data with a relationship derived from scheme 1, considering a Boltzmann-shaped voltage dependence for each independent gate (see figure legend for details), and a ohmic instantaneous conductance. The fit gave a single-gate activation V½ of −87 mV and a slope factor (k) of 16.7 mV. The modified HH model is also sufficient to describe the activation and deactivation kinetics of Ih, as shown by the fits for a representative family of Ih (Fig. 7C, activation and deactivation). The resulting time constants showed a bell-shaped voltage dependence (Fig. 7D).
Model results
Simulation of spontaneous voltage oscillations
To assess the role of the voltage-activated currents in the spontaneous oscillatory activity, we implemented a biophysical simulation based on the results reported in this study, as well as published data. Figures 3 and 4 show that only a subset of the voltage-dependent currents found in frog saccular hair cells are potentially active within the voltage range experienced during the spontaneous oscillations, namely IK1, Ih, and IA. As for the other currents, IDRK, IBKT, and ICa were found to be of negligible amplitude in oscillatory cells, while IBKS showed an activation threshold beyond the voltage range of the oscillations (cf. Fig. 4). Based on these data, oscillatory cells were modelled by a single-compartment model in which only IK1, Ih, IA and a leakage current were included. The kinetic descriptions of these currents were either based on the experimental results reported in this paper (IK1 and Ih), or in Catacuzzeno et al. (2003b) (IA; cf. Appendix for details), and the current densities were those found experimentally in oscillatory cells (cf. Figs 3 and 4, and Table 1). As shown on Fig. 8A, left, the model predicts spontaneous voltage oscillations with peak-to-peak voltage amplitude and frequency of 28 mV and 3.4 Hz, respectively, well within the range recorded experimentally.
Table 1.
Permeability values for oscillatory and non-oscillatory cells used in the model
| Non-oscillatory cell model | Oscillatory cell model | |
|---|---|---|
| gca (nS) | 3.2 | — |
| PDRKa (l s−1)b | 6.4 × 10⁻¹⁴ | — |
| PA (l s−1) | 1.5 × 10⁻¹³ | 3 × 10⁻¹⁴ |
| gK1 (nS) | 7.3 | 28 |
| ghc (nS) | 1.5 | 2.2 |
| PBKS (l s−1) | 2 × 10⁻¹³ | — |
| PBKTd (l s−1) | 14 × 10−13 | — |
Parameter values were estimated from the pharmacological data reported in Figs 3 and 4 on oscillatory and non-oscillatory cells, respectively.
Taken as 1.2 times the 4-AP-sensitive component estimated in Fig. 4E, given that 20% of IDRK is insensitive to this blocker (Catacuzzeno et al. 2003b).
Units of permeability as in Nygren et al. (1997).
The partial current activation at the time of estimation (100 ms) was taken into account using the data of Fig. 7D.
Figure 8. Modelling the spontaneous voltage oscillations in frog saccular hair cells.

A, simulated resting voltage activity under current-clamp mode obtained with a single-compartment model containing all the major ion conductances found to be active within the oscillatory voltage range (cf. Appendix). The left voltage trace was generated using current densities similar to those found in oscillatory cells, while the right trace was obtained with current densities similar to those found in non-oscillatory cells (see Table 1). B, plots of the peak-to-peak voltage amplitude (upper plot) and oscillatory frequency (lower plot) of the simulated voltage oscillations as a function of the indicated conductance or permeability parameter, showing the effect of varying the IA, IK1 or Ih density on the oscillatory properties. In each plot all the other conductance parameters were set according to the oscillatory cell model (cf. Table 1). C, temporal plot of the activity of Ih, IK1, and IA during an oscillation. The model parameters used were as for the simulated left trace of A. D, plot of the open probability of each current included in the oscillatory model (indicated) as a function of the membrane potential experienced by the cell during the oscillatory activity. Model parameters used were the same as for the simulated left trace of A. E, simulated oscillatory activity obtained by multiplying the activation time constant of Ih (τh) by a factor ≤ 1 (indicated).
To understand the relevance of each current to the oscillatory activity, we modelled the effect of varying IK1, Ih and IA densities on the oscillatory voltage amplitude and frequency. Figure 8B shows that the oscillatory activity disappears when IK1 and Ih conductances were reduced below about 22 and 1.5 nS, respectively, indicating that these currents are essential to establish the oscillatory activity (Fig. 8B, solid and dashed lines). Voltage oscillations also disappear with excessively high IK1 or Ih densities. This is consistent with our unpublished data indicating that a relatively constant IK1/Ih ratio is required to generate and maintain oscillations. IA however, is not necessary for establishing the oscillatory activity (Fig. 8B, dotted lines), but it does contribute to the temporal shape of the voltage changes. Specifically, an increase in IA density results in higher frequency and smaller amplitude oscillations.
The model also allows visualization of the temporal changes in the activity of the voltage-gated currents (Ih, IK1 and IA; cf. Fig. 8C), and understanding of their interplay to generate voltage oscillations. At the peak depolarization (first dashed line in Fig. 8C), IK1 is at its minimum activity, whereas Ih, because of its slower kinetics (cf. Fig. 7), is still decreasing. This delayed deactivation of Ih helps to hyperpolarize the membrane potential. Membrane hyperpolarization is enhanced by a IK1-based regenerative process (K+ efflux through IK1 further hyperpolarizes the membrane potential, further increasing IK1 activity), until the peak hyperpolarization is reached (second dashed line in Fig. 8C). At the peak hyperpolarization IK1 is at its maximum activity, whereas the slower Ih is still increasing. This delayed activation of Ih, together with IK1 deactivation, acts to depolarize the membrane potential until it reaches the peak depolarization of a new oscillatory cycle. Figure 8C also shows that during the depolarization of the voltage oscillation IA is also activated, albeit to a minor degree. This small, but significant, IA permeability helps to determine the rate of voltage changes, and the peak amplitude reached by the oscillation (cf. also Fig. 8B).
The relevance of the slow kinetics of Ih in generating voltage oscillations is perhaps better described in Fig. 8D which shows the activity (Po) of the three current components as a function of the membrane voltage experienced by the cell during voltage oscillations. Because of its slow kinetics, Ih displays a marked hysteresis, with changes in activity during the hyperpolarizing and depolarizing phases of the oscillation following very different trajectories. This hysteresis gives rise to the delayed feedback mechanism required for spontaneous voltage oscillations to occur (cf. Fig. 8C). In accordance, an increase in the activation rate of Ih (obtained by multiplying its activation time constant by a factor lower than one) results in the progressive reduction of the amplitude of voltage oscillations, until it fades (Fig. 8E). This effect is specific for Ih, since a reduced model in which only Ih kinetics were considered (assuming instantaneous gating for all other currents) was still capable of generating an oscillatory activity (data not shown).
We also tested whether the properties and densities of the currents found in non-oscillatory cells were compatible with a stable resting potential. The pharmacological results reported in Figs 3 and 4 indicated that all the voltage-activated currents found in non-oscillatory cells are potentially active near the resting membrane potential. In modelling the non-oscillatory cells, we thus included all the voltage-activated currents found in frog saccular hair cells, namely IK1, Ih, IA, IBKS, IBKT, IDRK, ICa, and a leakage current. The kinetic descriptions of the additional currents were taken from the experimental results reported in this paper (IBKT and IBKS, cf. also supplemental data), or in Catacuzzeno et al. (2003b) (IDRK and ICa; cf. Appendix), and the current densities were those found experimentally in non-oscillatory cells (cf. Figs 3 and 4, and Table 1). As shown on Fig. 8A, right, a stable membrane potential was obtained, in accordance with the experimental results. It can be seen from Fig. 8A that our non-oscillatory cell model does not demonstrate the much smaller amplitude and higher-frequency voltage fluctuations sometimes seen in these cells (cf. Ashmore, 1983; Fig. 1E). This is because in our theoretical description of the electrical activity we did not introduce the stochastic opening and closing of ion channels, that is likely to be the origin of this ‘noisy’ activity (White et al. 1998; Ospeck et al. 2001; our unpublished observations). Finally, we verified that the non-oscillatory cell model, containing the full set of voltage-dependent currents described in frog saccular hair cells, was able to generate electrical resonance in response to depolarizing current steps (data not shown).
The stabilizing role of the depolarization-activated currents on the membrane potential of non-oscillatory cells
The model indicates that IK1 and Ih, when present at appropriate amplitudes, are primarily responsible for the spontaneous oscillations. Some non-oscillatory cells, however, possess hyperpolarization-activated currents with amplitude and composition similar to oscillatory cells (cf. Fig. 3). How do these cells display a stable resting membrane potential? The findings that: (i) non-oscillatory cells possess large depolarization-activated currents that are active within the oscillatory voltage range (cf. Figs 2D and 4E), and (ii) blocking IBK with TEA produces electrical instability in some non-oscillatory cells (cf. Fig. 5F), would suggest that the depolarization-activated currents might exert a stabilizing effect on the membrane potential. We tested this hypothesis by modelling the effects of varying the depolarization-activated currents in a non-oscillatory cell with hyperpolarization-activated currents capable of generating oscillatory activity (as used in the oscillatory model; see Fig. 8A). Figure 9A shows simulated voltage traces in which the amplitude of all the depolarization-activated currents was progressively increased, without altering the amplitude of the hyperpolarization-activated currents. Specifically, we set the amplitude of each depolarization-activated current to a fraction f of their mean value in non-oscillatory cells. Thus, f = 0 corresponds to a cell totally lacking depolarization-activated currents, while f = 1 corresponds to a cell possessing the mean depolarization-activated current amplitude of non-oscillatory cells (cf. Table 1). This simulation clearly shows that increasing the depolarization-activated current amplitude results in the suppression of oscillations, i.e. stabilization of the resting membrane potential. The simulation further shows that ∼75% of the mean current amplitudes of non-oscillatory cells was sufficient to completely eliminate the oscillations (Fig. 9B). This action is mainly due to the stabilizing effect of IBK, since an oscillatory activity reappeared when IBK was individually decreased in a model in which f = 1 for all the other depolarization-activated conductances (see inset of Fig. 9B).
Figure 9. Stabilizing role of the depolarization-activated currents on the membrane potential of non-oscillatory cells.

A, simulated voltage traces showing the effect of increasing the depolarization-activated currents in a non-oscillatory cell having appropriate hyperpolarization-activated current amplitudes to generate an oscillatory activity (the same used in the oscillatory cell model, cf. Table 1). All the depolarization-activated current amplitudes were set equal to a fraction f of their mean values in non-oscillatory cells (cf. Table 1, non-oscillatory cell model). B, plot of the simulated oscillatory amplitude as a function of the parameter f obtained by running a series of simulations similar to those shown in panel A. Inset, plot showing the effect of varying either IBKS + IBKT, ICa, IDRK or IA on the voltage oscillatory peak-to-peak amplitude, while leaving the other current amplitudes at their mean values in non-oscillatory cells (cf. Table 1, non-oscillatory cell model). When varying ICa, U in eqn (A26) was appropriately modified to keep the coupling between Ca2+ and BK channels unaltered.
Discussion
The main finding of this study is the presence of high-amplitude spontaneous voltage oscillations in about 20% of isolated frog saccular hair cells, having centre frequency of 2–11 Hz, and peak-to-peak voltage amplitude in the range of 9–33 mV. These spontaneous oscillations are thus tuned to frequencies lower than the preferred excitatory frequencies of afferent saccular fibres (typically from 20 to 120 Hz; reviewed in Smotherman & Narins, 2000). We also found that in the majority of non-oscillatory cells, the depolarization-activated currents, present at substantially higher density as compared to those of oscillatory cells, help to stabilize the resting membrane potential.
We found a significant correlation between the presence of voltage oscillations and cell morphology, most oscillatory cells being found to have LAD ratios typical of central club-shaped cells. This result suggests that morphologically distinct saccular hair cells possess distinct electrical behaviours, thus supporting the notion of the existence of functionally different hair cells in the submammalian vertebrate sensory epithelia (Chabbert, 1997; Guth et al. 1998).
Ionic basis of spontaneous voltage oscillations
Both the experimental and modelling studies reported in this paper indicate that spontaneous voltage oscillations require the activity of the two hyperpolarization-activated currents present in this preparation, IK1 and Ih. First, the voltage-clamp data reported in Figs 2 and 3 indicate that a strong correlation exists between the oscillatory activity and the presence of high densities of both IK1 and Ih. Second, both ZD-7288 and low Ba2+ concentrations, selective blockers of Ih and IK1, respectively, inhibit the oscillatory activity (cf. Fig. 5). Third, a mathematical model incorporating the kinetics and amplitude of IK1 and Ih of oscillatory cells faithfully reproduces the spontaneous oscillations, and a reduction of either IK1 or Ih density induces their disappearance (cf. Fig. 8). The model results depicted in Fig. 8 also indicate that IA is not required for oscillatory activity. This current, however, appeared to modulate the oscillatory properties, with higher IA densities resulting in faster and smaller voltage oscillations (cf. Fig. 8B).
An important feature for the generation of spontaneous voltage oscillations is the slow kinetics of Ih. As our experiments and simulations show (cf. Figs 7 and 8), Ih kinetics appeared to be slow as compared to the rate of membrane voltage changes during the oscillation. This results in a substantial hysteresis of Ih activity, conferring on the system a memory of the previous oscillatory cycle, a requirement for generating the oscillatory activity. This is confirmed by the model results shown in Fig. 8E, indicating that faster Ih kinetics result in the suppression of voltage oscillations. Thus, Ih has kinetic properties appropriate for the generation of spontaneous voltage oscillations. Accordingly, Ih is important in several forms of spontaneous electrical activity with frequencies of several hertz, such as the rhythmic discharge of cardiac muscle cells (reviewed in Accili et al. 2002), and the subthreshold voltage fluctuations observed in neuronal tissues (Dickson et al. 2000).
Our data further show that the depolarization-activated currents counteract the oscillatory activity. Indeed, oscillatory cells possess smaller depolarization-activated currents, which in addition activate at more depolarized membrane potentials than for non-oscillatory cells (cf. Figs 2 and 4). Moreover, pharmacological block of IBK resulted in the appearance of an electrical instability in a group of non-oscillatory cells (Fig. 5E). Our simulation of voltage oscillations showed that an increase in the depolarization-activated currents resulted in a reduction of the oscillatory voltage amplitude, until it disappears completely (cf. Fig. 9). These observations explain why some cells with hyperpolarization-activated current amplitudes consistent with generating oscillatory activity had a stable membrane potential (cf. Fig. 3B).
Comparison with previous studies
To our knowledge, spontaneous voltage oscillations of the type described in this paper have not been previously reported in frog saccular hair cells. On isolated frog saccular neuroepithelia Ashmore (1983) reported a spontaneous voltage activity displaying high-frequency (11–85 Hz) and low-amplitude (noise variances over 0.249–3.54 mV2). A similar high-frequency and low-amplitude spontaneous activity was recorded from frog basilar papilla hair cells (Ospeck et al. 2001). Both these spontaneous activities differ profoundly from that described here. Rather, they resemble the small voltage fluctuations we observed in most non-oscillatory hair cells (cf. Fig. 1E and F). Another type of voltage activity, spontaneous spikes observed either at rest or upon current injection, has been reported for several mature lower vertebrates, including frog saccular hair cells, as well as in immature mammalian hair cells (Hudspeth & Corey, 1977; Fuchs et al. 1988; Sugihara & Furukawa, 1989; Kros et al. 1998). In addition to their very different time course, these spontaneous spikes appear to differ from our oscillations in the underlying ionic basis, as they are believed to result from the interplay between a delayed rectifier K+ current and voltage-activated Na+ and/or Ca2+ current (Sugihara & Furukawa, 1989; Marcotti et al. 2003).
There may be several reasons as to why the spontaneous voltage oscillations described here have not been previously observed. Papain, which has been used in most studies as a dissociating enzyme (Lewis & Hudspeth, 1983; Hudspeth & Lewis, 1988a,b; Roberts et al. 1990; Holt & Eatock, 1995) may alter the electrophysiological properties of the hair cells (cf. Armstrong & Roberts, 1998). It is worth noting that depolarization-activated currents are much larger in hair cells dissociated with papain compared to those dissociated with protease VIII. (Catacuzzeno et al. 2003a). This large outward K+ current would stabilize the membrane voltage, and thus prevent voltage oscillations. Voltage oscillations have not, however, been reported for the semi-intact (in situ) preparation, where current-clamp recordings have also been carried out (Ashmore, 1983; Armstrong & Roberts, 1998). A possible reason could be that in situ the spontaneous voltage oscillations are prevented by the stabilizing effect on the membrane potential exerted by the mechanotransducer cationic current or the ACh-induced K+ current, both of which are likely to be absent in our preparation (cf. Holt et al. 2001). We are not inclined, however, to believe that our enzymatic dissociation procedure causes our apparently distinct results. In a previous investigation, analysing outward BK and KV currents, as well as the electrical resonance in protease VIII-dissociated hair cells, we showed that their general electrophysiological properties were very similar to those reported in the semi-intact preparation (Catacuzzeno et al. 2003a). Another possible explanation may be related to the type of hair cells. Spontaneous voltage oscillations are mostly confined to a specific cell type, the central club-shaped saccular hair cells. These cells represent a relatively small proportion of frog saccular hair cells in the intact epithelium (Chabbert, 1997), and they have possibly been overlooked in previous investigations. Moreover, the recording conditions may be crucial. Indeed, these cells appear unique in the frog saccule with regard to their Ca2+ regulation, since they have been found to express calbindin-28D instead of parvalbumin 3 as their main mobile Ca2+ buffer (Edmonds et al. 2000; Heller et al. 2002). The depolarized shift we observed in IBK activation for these cells would agree with their Ca2+ buffering power being stronger (Edmonds et al. 2000), a feature that would be lost in ruptured whole-cell recordings.
Functional significance
Except for a row of presumably immature club-like hair cells at the periphery of the macula, the frog saccule does not display any regional heterogeneity in its hair cell properties (Chabbert, 1997), unlike most other hair cell organs. The two main cell types (central club-shaped and central cylindrical) are intermingled, apparently at random. So far as we are aware there are no data available regarding the afferent or efferent innervation patterns of these two cell populations. Whereas this indicates the requirement for further physiological and morphological data for a clear functional interpretation of spontaneous oscillations, several hypotheses may be proposed.
Spontaneous voltage oscillations could represent an electrical phenotype of immature frog saccular hair cells. Lower vertebrates are known to continuously produce new hair cells (Corwin & Oberholtzer, 1997). In the toad saccule, the peripheral elongated cells are thought to be the immature ‘growing pool’ of the macula, but about 10% of the cell population in more central regions was also labelled by mitotic indicators, possibly indicating an additional intramacular hair cell turnover (Corwin, 1985). Besides their shape, oscillatory hair cells share other properties with developing hair cells. First, developing hair cells transiently display different Ca2+ buffers from mature hair cells (Dechesne et al. 1994). Moreover, during their development, inner hair cells from the mammalian cochlea show progressively larger ICa and IBK (Beutner & Moser, 2001; Kros et al. 1998), transiently display low-frequency voltage spikes (Kros et al. 1998) and receive an efferent innervation which activates the α9 ACh receptor and in turn the SK current (Glowatzki & Fuchs, 2000). The small ICa and IBK (cf. Fig. 4E), large ISK (Chabbert, 1997), unique Ca2+ buffer (Edmonds et al. 2000) and low-frequency voltage oscillations (although not identical to those found in immature mouse hair cells) found in central club-shaped hair cells are congruent with an immature stage in development.
If they release transmitter, oscillatory hair cells could cyclically modulate the firing pattern of the afferent nerve fibre contacting them. Interestingly, single-unit recordings in few frog saccular afferents exhibit regular spontaneous activity (Christenses-Dalsgaard & Jorgensen, 1988; Christensen-Dalsgaard & Narins, 1993), as also observed in other lower vertebrate hair cell organs (Manley, 1979; Crawford & Fettiplace, 1980; Temchin, 1988). We do not know, however, whether the small Ca2+ influx (due to the low ICa density and the hyperpolarized range of voltage oscillations) occurring during the depolarizing phase of the spontaneous oscillations is sufficient to trigger neurotransmitter release. Interestingly, a recent study on frog saccular hair cells reports a non-L Ca2+ channel with an activation V½ within the voltage range of our spontaneous oscillations (Rodriguez-Contreras & Yamoah, 2001).
Another possible role for the spontaneous voltage oscillations may be found in the interaction with the spontaneous voltage oscillations at similar frequency stemming from the mechanotransducer current, and the consequent reinforcement of the spontaneous hair bundle motility. The hair bundle of frog saccular hair cells undergoes spontaneous oscillatory movements at frequencies close to, although slightly higher than, those we found for spontaneous voltage oscillations (Martin & Hudspeth, 1999; Martin et al. 2003). An important step in the bundle oscillatory cycle appears to be the Ca2+ influx through mechanotransducer channels (Choe et al. 1998; Ricci et al. 2000, 2002; Martin et al. 2003; Vilfan & Duke, 2003). Spontaneous voltage oscillations could modulate bundle motility by cyclically modulating the driving force for Ca2+ influx, thus amplifying alterations in intracellular Ca2+ during the oscillatory cycle. The finding that changes in membrane potential have been shown to evoke bundle movements (Assad & Corey, 1992; Denk & Webb, 1992; Ricci et al. 2000, 2002; Bozovic & Hudspeth, 2003) supports this proposal.
Supplementary Material
Acknowledgments
This work was supported by grants from the Italian MURST. We thank Drs Anthony Ricci, Paolo Valli, and Sandy Harper for their useful comments on the manuscript.
Appendix
Modelling the oscillatory cells
Voltage oscillations were modelled by numerically solving the following current-clamp equation:
 |
where V is the membrane voltage, Cm is the cell membrane capacitance, and Iion is the total ion current passing through the membrane. In the oscillatory cell model Iion is given by
where IL is the leakage current.
The currents included in eqn (A2) were modelled as follows.
IK1 modelling
IK1 was modelled, using the experimental data from this study (Fig. 6), by a combination of two different activation gates, according to the following relationship:
 |
where gK1 is the maximal K1 conductance, mK1f and mK1s are the fast and slow gates, respectively, and afast is the contribution of the fast gate to the overall IK1 gating. afast was considered to be 0.7 (see Fig. 6D). The temporal evolution of the two gates is described by the following differential equations:
 |
 |
with
 |
 |
and
 |
where V½ and k are the IK1 half activation voltage and steepness, respectively.
Ih modelling
Ih was modelled, in accordance with the experimental data obtained from this study (Fig. 7), using a modified HH model with three independent activation gates, assuming that only two need to enter the m state to open the channel (scheme 1; Holt & Eatock, 1995). This gives:
 |
where gh is the maximal h conductance and Eh its reversal potential. mh(V, t) was assessed from
 |
with mh(V, ∞) and τh(V) given by the relationships:
 |
and
IA and IL modelling
Both these currents were modelled as in Catacuzzeno et al. (2003b).
Modelling the non-oscillatory cells
Non-oscillatory cells were modelled by numerically solving eqn (A1). In this case Iion also incorporates ICa, IBKS, IBKT and IDRK, given their sensible activation and substantial current density within the oscillatory voltage range (see Figs 2 and 4). Namely
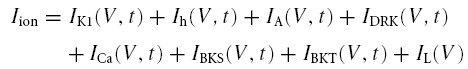 |
IK1, Ih, IA and IL were modelled as described above for the oscillatory cell model. A description of the other currents included in the non-oscillatory cell model follows.
IBKS and IBKT modelling
The following five-state linear scheme was used to model the activation of both IBKS and IBKT (Hudspeth & Lewis, 1988a)
 |
Scheme 2 |
Identical activation schemes were used for both IBKS and IBKT since a previous study showed identical activation kinetics for both currents (Armstrong & Roberts, 2001). The voltage dependence of the Ca2+-dependent transitions in scheme 2 is given by
 |
where j = 1, 2 and 3. βc is voltage independent, whereas αc voltage dependence is given by
The following series of differential equations was used to find the probability of encountering the channels in each of the five states
 |
 |
 |
 |
 |
O2 + O3 gives the total open probability for IBKS. Thus
 |
where PBKS is the maximal sustained BK current permeability, Ki and Ko are the intracellular and extracellular K+ concentrations, and F, R, and T have their usual meanings.
Ion permeation through BK channels was described using the GHK relationship, instead of the more common ohmic relationship, since this allowed a much better reproduction of the experimental, TEA-sensitive, I–V relationship (cf. Fig. 4E, see below). IBKT has an additional term (hBKT) taking into account inactivation
 |
where PBKT is the maximal transient BK current permeability. hBKT is described by the following differential equation
 |
with hBKT and τBKT (V) given by
and
 |
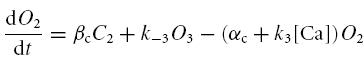
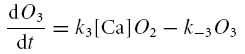
The steady-state and kinetic parameters of IBKT inactivation are estimated in the supplemental data. The Ca2+ concentration used to assess the Ca2+-dependent transition rates in scheme 2 is given by solving the following differential equation (Hudspeth & Lewis, 1988a):
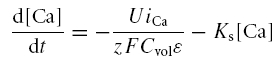 |
where z and F have their usual meanings. Cvol, ɛ, and Ks were taken from Hudspeth & Lewis (1988a). The buffering capacity of the intracellular solution (U in eqn (A26)) was determined by fitting the steady-state IBKS − V relationship of non-oscillatory cells (cf. Fig. 4E) with the above-described model at steady state, using the following relationship
 |
where
 |
 |
and
The free parameters of the fit have the following values: U = 0.005 and PBKS= 2e−13. gCa, estimated from the data reported in Fig. 4E, was 3.2 nS. All the other parameters were taken from Hudspeth & Lewis (1988a) for BK currents, and from Catacuzzeno et al. (2003b) for Ca2+ currents. The U-value was found to be lower than that used in Hudspeth & Lewis (1988a; see Table 2), in accordance with a higher intracellular buffering capability in our perforated-patch recordings (see Roberts, 1993).
Table 2.
Kinetic and steady-state parameters used to model the electrical activity of frog saccular hair cells
| IBK | IK1 | Ih | |||
|---|---|---|---|---|---|
| Parameter | Value | Parameter | Value | Parameter | Value |
| k−1 | 300 s−1 | EK | −95 mV | Eh | −45 mV |
| k−2 | 5000 s−1 | Steady-state activation | Steady-state activation | ||
| k−3 | 1500 s−1 | V½ | −110 mV | V½ | −87 mV |
| K1(0) | 6 μm | k | 11 mV | k | 16.7 mV |
| K2(0) | 45 μm | Activation kinetics | Activation kinetics | ||
| K3(0) | 20 μm | τK1f(0) | 0.7 ms | P1 | 63.7 ms |
| δ1 | 0.2 | V0f | −120 mV | P2 | 135.7 ms |
| δ2 | 0 | VTf | −43.8 mV | P3 | −91.4 mV |
| δ3 | 0.2 | KTf | 0.04 ms | P4 | 21.2 mV |
| αC(0) | 450 s−1 | τK1s(0) | 14.1 ms | ||
| VA | 33 mV | V0s | −120 mV | Casm | |
| βC | 1000 s−1 | VTs | −28 mV | U | 0.005 |
| Inactivation | KTs | 0.04 ms | ɛ | 3.4e−5 | |
| V½ | −61.6 mV | Cvo | 1.25 pl | ||
| KBKT | 3.65 mV | IL | Ks | 2800 s−1 | |
| P1 | 2.1 ms | gL | 0.1 nS | ZCa | 2.0 |
| P2 | 9.4 ms | EL | 0 mV | ||
| P3 | −66.9 mV | Cell capacitance | |||
| P4 | 17.7 mV | Cm | 10 pF | ||
IDRK and ICa modelling
Both these currents were modelled as in Catacuzzeno et al. (2003b).
Supplementary material
The online version of this paper can be accessed at:
DOI: 10.1113/jphysiol.2004.072652/
http://jp.physoc.org/cgi/content/full/jphysiol.2004.072652/DC1 and contains supplementary material entitled: Biophysical study of IBKT inactivation.
References
- Accili EA, Proenza C, Baruscotti M, DiFrancesco D. From funny current to HCN channels: 20 years of excitation. News Physiol Sci. 2002;17:32–37. doi: 10.1152/physiologyonline.2002.17.1.32. [DOI] [PubMed] [Google Scholar]
- Armstrong CE, Roberts WM. Electrical properties of frog saccular hair cells: distortion by enzymatic dissociation. J Neurosci. 1998;18:2962–2973. doi: 10.1523/JNEUROSCI.18-08-02962.1998. [DOI] [PMC free article] [PubMed] [Google Scholar]
- Armstrong CE, Roberts WM. Rapidly inactivating and non-inactivating calcium-activated potassium currents in frog saccular hair cells. J Physiol. 2001;536:49–65. doi: 10.1111/j.1469-7793.2001.00049.x. 10.1111/j.1469-7793.2001.00049.x. [DOI] [PMC free article] [PubMed] [Google Scholar]
- Ashmore JF. Frequency tuning in a frog vestibular organ. Nature. 1983;304:536–538. doi: 10.1038/304536a0. 10.1038/304536a0. [DOI] [PubMed] [Google Scholar]
- Assad JA, Corey DP. An active motor model for adaptation by vertebrate hair cells. J Neurosci. 1992;12:3291–3309. doi: 10.1523/JNEUROSCI.12-09-03291.1992. [DOI] [PMC free article] [PubMed] [Google Scholar]
- Beutner D, Moser T. The presynaptic function of mouse cochlear inner hair cells during development of hearing. J Neurosci. 2001;21:4593–4599. doi: 10.1523/JNEUROSCI.21-13-04593.2001. [DOI] [PMC free article] [PubMed] [Google Scholar]
- BoSmith RE, Briggs I, Sturgess NC. Inhibitory actions of ZENECA ZD7288 on whole-cell hyperpolarization activated inward current (If) in guinea-pig dissociated sinoatrial node cells. Br J Pharmacol. 1993;110:343–349. doi: 10.1111/j.1476-5381.1993.tb13815.x. [DOI] [PMC free article] [PubMed] [Google Scholar]
- Bozovic D, Hudspeth AJ. Hair-bundle movements elicited by transepithelial electrical stimulation of hair cells in the sacculus of the bullfrog. Proc Natl Acad Sci U S A. 2003;100:958–963. doi: 10.1073/pnas.0337433100. [DOI] [PMC free article] [PubMed] [Google Scholar]
- Catacuzzeno L, Fioretti B, Franciolini F. Voltage-gated outward K currents in frog saccular hair cells. J Neurophysiol. 2003b;90:3688–3701. doi: 10.1152/jn.00308.2003. [DOI] [PubMed] [Google Scholar]
- Catacuzzeno L, Fioretti B, Perin P, Franciolini F. Frog saccular hair cells dissociated with protease VIII exhibit inactivating BK currents, Kv currents, and low-frequency electrical resonance. Hear Res. 2003a;175:36–44. doi: 10.1016/s0378-5955(02)00707-4. [DOI] [PubMed] [Google Scholar]
- Chabbert CH. Heterogeneity of hair cells in the bullfrog sacculus. Pflugers Arch. 1997;435:82–90. doi: 10.1007/s004240050486. [DOI] [PubMed] [Google Scholar]
- Choe Y, Magnasco MO, Hudspeth AJ. A model for amplification of hair-bundle motion by cyclical binding of Ca2+ to mechanoelectrical-transduction channels. Proc Natl Acad Sci U S A. 1998;95:15321–15326. doi: 10.1073/pnas.95.26.15321. [DOI] [PMC free article] [PubMed] [Google Scholar]
- Christensen-Dalsgaard J, Narins PM. Sound and vibration sensitivity of VIIIth nerve fibers in the frogs Leptodactylus albilabris and Rana pipiens pipiens. J Comp Physiol. 1993;172:653–662. doi: 10.1007/BF00195391. [DOI] [PubMed] [Google Scholar]
- Christensen-Dalsgaard J, Jorgensen MB. The response characteristics of vibration-sensitive saccular fibers in the grassfrog, Rana temporaria. J Comp Physiol. 1988;162:633–638. doi: 10.1007/BF01342638. [DOI] [PubMed] [Google Scholar]
- Corwin JT. Perpetual production of hair cells and maturational changes in hair cell ultrastructure accompany postembryonic growth in an amphibian ear. Proc Natl Acad Sci U S A. 1985;82:3911–3915. doi: 10.1073/pnas.82.11.3911. [DOI] [PMC free article] [PubMed] [Google Scholar]
- Corwin JT, Oberholtzer JC. Fish'n chicks: model recipes for hair-cell regeneration? Neuron. 1997;19:951–954. doi: 10.1016/s0896-6273(00)80386-4. [DOI] [PubMed] [Google Scholar]
- Crawford AC, Fettiplace R. The frequency selectivity of auditory nerve fibres and hair cells in the cochlea of the turtle. J Physiol. 1980;306:79–125. doi: 10.1113/jphysiol.1980.sp013387. [DOI] [PMC free article] [PubMed] [Google Scholar]
- Dechesne CJ, Rabejac D, Desmadryl G. Development of calretinin immunoreactivity in the mouse inner ear. J Comp Neurol. 1994;346:517–529. doi: 10.1002/cne.903460405. [DOI] [PubMed] [Google Scholar]
- Dempster J. Computer Analysis of Electrophysiological Signals. London: Academic Press; 1993. [Google Scholar]
- Denk W, Webb WW. Forward and reverse transduction at the limit of sensitivity studied by correlating electrical and mechanical fluctuations in frog saccular hair cells. Hear Res. 1992;60:89–102. doi: 10.1016/0378-5955(92)90062-r. 10.1016/0378-5955(92)90062-R. [DOI] [PubMed] [Google Scholar]
- Dickson CT, Magistretti J, Shalinsky MH, Fransen E, Hasselmo ME, Alonso A. Properties and role of Ih in the pacing of subthreshold oscillations in entorhinal cortex layer II neurons. J Neurophysiol. 2000;83:2562–2579. doi: 10.1152/jn.2000.83.5.2562. [DOI] [PubMed] [Google Scholar]
- Edmonds B, Reyes R, Schwaller B, Roberts WM. Calretinin modifies presynaptic calcium signaling in frog saccular hair cells. Nat Neurosci. 2000;3:786–790. doi: 10.1038/77687. 10.1038/77687. [DOI] [PubMed] [Google Scholar]
- Fettiplace R, Fuchs PA. Mechanisms of hair cell tuning. Annu Rev Physiol. 1999;61:809–834. doi: 10.1146/annurev.physiol.61.1.809. 10.1146/annurev.physiol.61.1.809. [DOI] [PubMed] [Google Scholar]
- Fuchs PA, Nagai T, Evans MG. Electrical tuning in hair cells isolated from the chick cochlea. J Neurosci. 1988;8:2460–2467. doi: 10.1523/JNEUROSCI.08-07-02460.1988. [DOI] [PMC free article] [PubMed] [Google Scholar]
- Gasparini S, DiFrancesco D. Action of the hyperpolarization-activated current (Ih) blocker ZD 7288 in hippocampal CA1 neurons. Pflugers Arch. 1997;435:99–106. doi: 10.1007/s004240050488. 10.1007/s004240050488. [DOI] [PubMed] [Google Scholar]
- Glowatzki E, Fuchs PA. Cholinergic synaptic inhibition of inner hair cells in the neonatal mammalian cochlea. Science. 2000;288:2366–2368. doi: 10.1126/science.288.5475.2366. 10.1126/science.288.5475.2366. [DOI] [PubMed] [Google Scholar]
- Goodman MB, Art JJ. Variations in the ensemble of potassium currents underlying resonance in turtle hair cells. J Physiol. 1996;497:395–412. doi: 10.1113/jphysiol.1996.sp021776. [DOI] [PMC free article] [PubMed] [Google Scholar]
- Guth PS, Perin P, Norris CH, Valli P. The vestibular hair cells: post-transductional signal processing. Prog Neurobiol. 1998;54:193–247. doi: 10.1016/s0301-0082(97)00068-3. 10.1016/S0301-0082(97)00068-3. [DOI] [PubMed] [Google Scholar]
- Heller S, Bell AM, Denis CS, Choe Y, Hudspeth AJ. Parvalbumin 3 is an abundant Ca2+ buffer in hair cells. J Assoc Res Otolaryngol. 2002;3:488–498. doi: 10.1007/s10162-002-2050-x. 10.1007/s10162-002-2050-x. [DOI] [PMC free article] [PubMed] [Google Scholar]
- Holt JR, Eatock RA. Inwardly rectifying currents of saccular hair cells from the leopard frog. J Neurophysiol. 1995;73:1484–1502. doi: 10.1152/jn.1995.73.4.1484. [DOI] [PubMed] [Google Scholar]
- Holt JC, Lioudyno M, Athas G, Garcia MM, Perin P, Guth PS. The effect of proteolytic enzymes on the alpha9-nicotinic receptor-mediated response in isolated frog vestibular hair cells. Hear Res. 2001;152:25–42. doi: 10.1016/s0378-5955(00)00225-2. 10.1016/S0378-5955(00)00225-2. [DOI] [PubMed] [Google Scholar]
- Horn R, Marty A. Muscarinic activation of ionic currents measured by a new whole-cell recording method. J Gen Physiol. 1988;92:145–159. doi: 10.1085/jgp.92.2.145. 10.1085/jgp.92.2.145. [DOI] [PMC free article] [PubMed] [Google Scholar]
- Hudspeth AJ, Corey DP. Sensitivity, polarity, and conductance change in the response of vertebrate hair cells to controlled mechanical stimuli. Proc Natl Acad Sci U S A. 1977;74:2407–2411. doi: 10.1073/pnas.74.6.2407. [DOI] [PMC free article] [PubMed] [Google Scholar]
- Hudspeth AJ, Lewis RS. Kinetic analysis of voltage- and ion-dependent conductances in saccular hair cells of the bull-frog, Rana catesbeiana. J Physiol. 1988a;400:237–274. doi: 10.1113/jphysiol.1988.sp017119. [DOI] [PMC free article] [PubMed] [Google Scholar]
- Hudspeth AJ, Lewis RS. A model for electrical resonance and frequency tuning in saccular hair cells of the bull-frog, Rana catesbeiana. J Physiol. 1988b;400:275–297. doi: 10.1113/jphysiol.1988.sp017120. [DOI] [PMC free article] [PubMed] [Google Scholar]
- Ishihara K, Yan DH, Yamamoto S, Ehara T. Inward rectifier K+ current under physiological cytoplasmic conditions in guinea-pig cardiac ventricular cells. J Physiol. 2002;540:831–841. doi: 10.1113/jphysiol.2001.013470. [DOI] [PMC free article] [PubMed] [Google Scholar]
- Kros CJ, Ruppersberg JP, Rusch A. Expression of a potassium current in inner hair cells during development of hearing in mice. Nature. 1998;394:281–284. doi: 10.1038/28401. 10.1038/28401. [DOI] [PubMed] [Google Scholar]
- Lewis RS, Hudspeth AJ. Voltage- and ion-dependent conductances in solitary vertebrate hair cells. Nature. 1983;304:538–541. doi: 10.1038/304538a0. 10.1038/304538a0. [DOI] [PubMed] [Google Scholar]
- Manley GA. Preferred intervals in the spontaneous activity of primary auditory neurons. Naturwissenschaften. 1979;66:582–584. doi: 10.1007/BF00368823. 10.1007/BF00368823. [DOI] [PubMed] [Google Scholar]
- Marcotti W, Johnson SL, Rusch A, Kros CJ. Sodium and calcium currents shape action potentials in immature mouse inner hair cells. J Physiol. 2003;552:743–761. doi: 10.1113/jphysiol.2003.043612. 10.1113/jphysiol.2003.043612. [DOI] [PMC free article] [PubMed] [Google Scholar]
- Martin P, Bozovic D, Choe Y, Hudspeth AJ. Spontaneous oscillation by hair bundles of the bullfrog's sacculus. J Neurosci. 2003;23:4533–4548. doi: 10.1523/JNEUROSCI.23-11-04533.2003. [DOI] [PMC free article] [PubMed] [Google Scholar]
- Martin P, Hudspeth AJ. Active hair-bundle movements can amplify a hair cell's response to oscillatory mechanical stimuli. Proc Natl Acad Sci U S A. 1999;96:14306–14311. doi: 10.1073/pnas.96.25.14306. 10.1073/pnas.96.25.14306. [DOI] [PMC free article] [PubMed] [Google Scholar]
- Neher E. Correction for liquid junction potentials in patch-clamp experiments. Meth Enzymol. 1992;207:123–131. doi: 10.1016/0076-6879(92)07008-c. [DOI] [PubMed] [Google Scholar]
- Nygren A, Fiset C, Firek L, Clark JW, Lindblad DS, Clark RB, Giles WR. Mathematical model of an adult human atrial cell: the role of K+ currents in repolarization. Circ Res. 1997;82:63–81. doi: 10.1161/01.res.82.1.63. [DOI] [PubMed] [Google Scholar]
- Ospeck M, Eguiluz VM, Magnasco MO. Evidence of a Hopf bifurcation in frog hair cells. Biophys J. 2001;80:2597–2607. doi: 10.1016/S0006-3495(01)76230-3. [DOI] [PMC free article] [PubMed] [Google Scholar]
- Press WH, Teukolsky SA, Vetterling WT, Flannery BP. Numerical Recipes in C. Cambridge UK: Cambridge University Press; 1992. [Google Scholar]
- Ricci AJ, Crawford AC, Fettiplace R. Active hair bundle motion linked to fast transducer adaptation in auditory hair cells. J Neurosci. 2000;20:7131–7142. doi: 10.1523/JNEUROSCI.20-19-07131.2000. [DOI] [PMC free article] [PubMed] [Google Scholar]
- Ricci AJ, Crawford AC, Fettiplace R. Mechanisms of active hair bundle motion in auditory hair cells. J Neurosci. 2002;22:44–52. doi: 10.1523/JNEUROSCI.22-01-00044.2002. [DOI] [PMC free article] [PubMed] [Google Scholar]
- Roberts WM. Spatial calcium buffering in saccular hair cells. Nature. 1993;363:74–76. doi: 10.1038/363074a0. 10.1038/363074a0. [DOI] [PubMed] [Google Scholar]
- Roberts WM, Jacobs RA, Hudspeth AJ. Colocalization of ion channels involved in frequency selectivity and synaptic transmission at presynaptic active zones of hair cells. J Neurosci. 1990;10:3664–3684. doi: 10.1523/JNEUROSCI.10-11-03664.1990. [DOI] [PMC free article] [PubMed] [Google Scholar]
- Rodriguez-Contreras A, Yamoah EN. Direct measurement of single-channel Ca2+ currents in bullfrog hair cells reveals two distinct channel subtypes. J Physiol. 2001;534:669–689. doi: 10.1111/j.1469-7793.2001.00669.x. 10.1111/j.1469-7793.2001.00669.x. [DOI] [PMC free article] [PubMed] [Google Scholar]
- Smotherman MS, Narins PM. Hair cells, hearing and hopping: a field guide to hair cell physiology in the frog. J Exp Biol. 2000;203:2237–2246. doi: 10.1242/jeb.203.15.2237. [DOI] [PubMed] [Google Scholar]
- Sugihara I, Furukawa T. Morphological and functional aspects of two different types of hair cells in the goldfish sacculus. J Neurophysiol. 1989;62:1330–1343. doi: 10.1152/jn.1989.62.6.1330. [DOI] [PubMed] [Google Scholar]
- Temchin AN. Unusual discharge patterns of single fibers in the pigeon's auditory nerve. J Comp Physiol. 1988;163:99–115. doi: 10.1007/BF00612001. 10.1007/BF00612001. [DOI] [PubMed] [Google Scholar]
- Vilfan A, Duke T. Two adaptation processes in auditory hair cells together can provide an active amplifier. Biophys J. 2003;85:191–203. doi: 10.1016/S0006-3495(03)74465-8. [DOI] [PMC free article] [PubMed] [Google Scholar]
- White JA, Klink R, Alonso A, Kay AR. Noise from voltage-gated ion channels may influence neuronal dynamics in the entorhinal cortex. J Neurophysiol. 1998;80:262–269. doi: 10.1152/jn.1998.80.1.262. [DOI] [PubMed] [Google Scholar]
- Wu YC, Art JJ, Goodman MB, Fettiplace RA. Kinetic description of the calcium-activated potassium channel and its application to electrical tuning of hair cells. Prog Biophys Mol Biol. 1995;63:131–158. doi: 10.1016/0079-6107(95)00002-5. 10.1016/0079-6107(95)00002-5. [DOI] [PubMed] [Google Scholar]
Associated Data
This section collects any data citations, data availability statements, or supplementary materials included in this article.