Abstract
Bestrophins are a newly identified family of Cl− channels. Mutations in the founding member of the family, human bestrophin-1 (hBest1), are responsible for a form of early onset macular degeneration called Best vitelliform macular dystrophy. The link between dysfunction of hBest1 and macular degeneration remains unknown. Because retinal pigmented epithelium (RPE) cells may be subjected to varying osmotic pressure due to light-dependent changes in the ionic composition of the subretinal space and because RPE cells may undergo large volume changes during phagocytosis of shed photoreceptor discs, we investigated whether bestrophin currents were affected by cell volume. When hBest1 and mBest2 were overexpressed in HEK 293, HeLa, and ARPE-19 cells, a new Ca2+-activated Cl− current appeared. This current was very sensitive to cell volume. A 20% increase in extracellular osmolarity caused cell shrinkage and a ∼70–80% reduction in bestrophin current. Decreases in extracellular osmolarity increased the bestrophin currents slightly, but this was difficult to quantify due to simultaneous activation of endogenous volume-regulated anion channel (VRAC) current. To determine whether a similar current was present in mouse RPE cells, the effect of hyperosmotic solutions on isolated mouse RPE cells was examined. Mouse RPE cells exhibited an endogenous Cl− current that resembled the expressed hBest1 in that it was decreased by hypertonic solution. We conclude that bestrophins are volume sensitive and that they could play a novel role in cell volume regulation of RPE cells.
Best vitelliform macular dystrophy (VMD2) is a degeneration of the macular region of the retina (Petrukhin et al. 1998; Bakall et al. 1999; Caldwell et al. 1999; White et al. 2000). Best disease often develops in childhood and is associated with the accumulation of a yellow fluid between the retina and the retinal pigmented epithelium (RPE) (Gass, 1987; O'Gorman et al. 1988). The fluid accumulation in Best disease is consistent with abnormal fluid transport, which often involves Cl− channels. Recently, bestrophin, the protein product of the VMD2 gene, has been identified as a Ca2+-activated Cl− channel (Sun et al. 2002; Tsunenari et al. 2003; Qu et al. 2003, 2004). Several mutants of human bestrophin-1 (hBest1), an isoform selectively expressed in the basolateral membrane of RPE (Marmorstein et al. 2000; Bakall et al. 2003), are responsible for Best disease and dominantly inhibit the Cl− conductance associated with wild-type hBest-1 (Qu et al. 2003; Tsunenari et al. 2003).
The connection between defective hBest1 function and the accumulation of lipofuscin-like material within and beneath the RPE is unknown. However, important roles of the RPE are to sustain photoreceptor renewal by phagocytosis of shed photoreceptor outer segments (LaVail, 1983), and to control the volume and composition of the subretinal space (Gallemore et al. 1997). Both of these functions might be expected to produce changes in cell volume. RPE preparations have been shown to transport water from the retina to the choroid (Hughes et al. 1984, 1987; La Cour & Zeuthen, 1993), and to support the vectorial traffic of ions and fluid (for a review, see Gallemore et al. 1997). Besides, RPE cells possess the appropriate ion channel and transport armamentarium to respond to hyposmotic swelling or hyperosmotic shrinkage by regulatory volume changes (La Cour & Zeuthen, 1993; Kennedy, 1994; Civan et al. 1994; Adorante, 1995). Therefore, it is tempting to speculate that part of the RPE dysfunction in Best disease might involve abnormal RPE cell volume regulation, or abnormal Cl− channel responses to cell volume changes due to defective hBest1 Cl− channels. Interestingly, in diabetic retinopathy, another pathology with RPE transport defects, the regulatory cell volume response of RPE cells to shrinkage was found to be inhibited (Civan et al. 1994). In this study, we found that hyperosmotic shrinkage induced a profound inhibition of the bestrophin Cl− currents. In isolated mouse RPE cells, hyperosmotic shrinkage also suppressed part of the total Cl− current, which might indicate a contribution of bestrophins to the native RPE Cl− conductance.
Methods
Heterologous expression of hBest1 and mBest2 in mammalian cell line cDNA clones of human Bestrophin-1 (hBest1) (GENBANK NM_004183, generously provided by Dr Jeremy Nathans, Johns Hopkins University), mouse Bestrophin-2 (mBest2) (ATCC, IMAGE clone ID: 4989959, GENBANK AY450428) or human cystic fibrosis transmembrane conductance regulator (hCFTR) (GENBANK M28668, provided by Dr David Gadsby, Rockefeller University) were sequenced to verify that their sequence agreed with the published EMBL/GenBank/DDBJ sequences. Cell lines used include HEK 293 (human embryonic kidney), ARPE-19 (human retinal pigment epithelium), and HeLa (human fibroblast). All cell lines were obtained from American Type Culture Collection (ATCC, Manassas, VA, USA). hBest1, mBest2 or hCFTR were transfected into these cells using Fugene-6 transfection reagent (Roche, Indianapolis, IN). Usually, 0.1 μg mBest2, 0.9 μg hBest1 or 0.1 μg CFTR cDNA was used to transfect one 35 mm culture dish. pEGFP (Invitrogen, Carlsbad, CA, USA) was also transfected to identify transfected cells. The pEGFP plasmid alone (1 μg) was used as a transfection control. One day after transfection, cells were dissociated and replated on glass coverslips for electrophysiological recording. Transfected cells were identified by EGFP fluorescence and used for patch-clamp experiments within 3 days after transfection.
Mouse retinal pigmented epithelial cell isolation
All procedures with animals were designed to minimize pain and suffering and conformed to NIH guidelines. The animal protocols were approved by the Emory University Institutional Animal Use and Care Committee. Female mice aged 6–12 weeks were anaesthetized using isoflurane (Baxter, Deerfield, IL, USA), and decapitated. Eyes were removed and dissected under a microscope in a dissection plate containing Ringer solution. The anterior segment and vitreous were removed by a circumferential incision at the limbus. The neural retina was gently peeled to obtain clean eye cups with the retinal pigmented epithelial (RPE) layer exposed. The eye cups were then transferred into clean Ringer solution, washed gently, and then placed in 10 ml of isolation solution containing 2 mg papain (Sigma-Aldrich, St Louis, MO, USA) at 37°C for 30 min, with a gentle agitation every 5 min. At the end of this 30-min period, the eye cups were transferred into a microfuge tube containing 1 ml Ringer solution, and RPE cells were dispersed by a few taps on the tube. The cell suspension was plated on glass coverslips in culture medium and kept at 37°C for 2–10 h prior to electrophysiological recordings.
Electrophysiological recordings
Recordings were performed using the whole-cell recording configuration of the patch-clamp technique. Patch pipettes were made of borosilicate glass (Sutter Instrument Co., Novato, CA, USA), pulled by a Sutter P-2000 puller (Sutter Instrument Co.), and fire polished. Patch pipettes had resistances of 1.5–3 MΩ when filled with the standard intracellular solution (see below). The bath was grounded via a 3 m KCl agar bridge connected to a Ag/AgCl reference electrode. Solution changes were performed by perfusing the 1 ml chamber at a speed of ∼4 ml min−1. To measure the steady-state current–voltage relationship, the cells were voltage clamped from a holding potential of 0 mV with 750 ms duration pulses from −100 mV to +100 mV in 20 mV increments at 0.25 Hz. Because the currents were usually time independent, most experiments used a 1350 ms duration voltage ramp from −100 to +100 mV delivered every 8 s. The ramp was preceded by a 500 ms pulse to −100 mV, and followed by a 500 ms pulse to +100 mV. Data were acquired by an Axopatch 200B amplifier controlled by Clampex 8.2 via a Digidata 1322 A data acquisition system (Axon Instruments, Inc., Union City, CA, USA). Experiments were conducted at room temperature (20–24°C). Liquid junction potentials were corrected using the liquid junction potential calculator in Clampex 8.2.
A question that arises in these studies is how the whole-cell patch-clamp configuration influences cell volume changes. This situation was addressed by Ross et al. (1994) who predicted that whole-cell patch-clamped cells will swell indefinitely when exposed to the ‘infinite’ hyperosmotic perfusion volume of the pipette. When extracellular osmolality is decreased (like in 0.9T – see Solutions), water starts entering the cell causing swelling. This raises the water concentration in the cytosol and lowers the effective cytosolic solute concentration. It follows that the driving force for solute diffusion from the pipette into the cell will increase as the cytosol is diluted. As solutes diffuse into the cell, this leads to more water entering the cell through the membrane and more swelling. Experimentally, the volume expansion usually reaches a steady state, which allows cells to maintain a constant volume in the face of the osmotic gradient.
Imaging changes in cell volume
Cells were visualized using a 63× objective with bright field or differential interference contract optics on a Zeiss Axiovert microscope and imaged using a CoolSnap HQ cooled CCD camera (Photometrics) and Metamorph software (Universal Imaging). Images were generally acquired at a rate of 4 min−1. Cell volume was estimated by manually drawing a line around the perimeter of the cell in Metamorph, which calculated the cell area. Obviously, a two-dimensional measurement of cell volume could introduce errors, especially in cells that had flat or irregular geometry. For these measurements, we chose cells that were relatively spherical, and then lifted them slightly off the bottom of the dish. These suspended cells were usually reasonably symmetrical.
Cell surface biotinylation
All reactions were carried out at 4°C. Non-transfected HEK 293 cells and HEK 293 cells transfected with mBest2 were washed three times with PBSB, placed in hypotonic or hypertonic medium for 15 min, then placed on ice and biotinylated with 0.5 mg ml−1 Sulfo-NHS-LC Biotin (Pierce, Rockford, IL, USA) in PBSB for 40 min. The cells were washed with 1 mm Ca2+ and 1 mm Mg2+ phosphate buffered saline (PBSB), incubated in 100 mm glycine in PBSB to quench unreacted biotin, and washed three times with PBSB, scraped from the dish and pelleted by centrifugation in a clinical centrifuge for 3–5 min. The cell pellet was sonicated in Lysis buffer (150 mm NaCl, 5 mm EDTA, 50 mm Hepes pH 7.4, 1% Triton X-100, 0.5% protease inhibitor cocktail III (Calbiochem, San Diego, CA, USA), and 10 μm phenylmethylsulfonyl fluoride (PMSF) and incubated for 30 min; 250 μl of lysis buffer was used for each 100 mm dish of cells (<0.5 mg protein). The extract was clarified by centrifugation at 10 000 g for 15 min; 200 μl of extract was incubated with 50 μl of streptavidin beads (Pierce) overnight with gentle agitation. The beads were collected by centrifugation at 10 000 g for 10 min. The beads were washed four times with 0.6 ml lysis buffer + 200 mm NaCl. The bound biotinylated proteins were eluted with 200 μl 2× Laemmli buffer. Protein samples were run on 4–15% gradient polyacrylamide gels in 25 mm Tris-HCl pH 8.3, 200 mm glycine, 0.5% SDS with ∼10 μg of protein per well. The proteins were electrophoretically transferred to Hybond nitrocelluose membranes in 25 mm Tris-HCl pH 8.3, 200 mm glycine, 20% methanol. The membranes were blocked with 5% dry milk in PBS with 0.1% Tween-20 (PBS-T) overnight at 4°C or 1 h at room temperature. Depending on the experiment, the nitrocellulose probed with a polyclonal antibody raised against a hBest1 C-terminal peptide AKQNVRGQEDNK in rabbits (1/1000 dilution) followed by horseradish peroxidase conjugated goat antirabbit IgG (1/4000 dilution) (Jackson Immuno Research, West Grove, PA, USA) in PBS-T with 1% dry milk. Immunoreactive or streptavidin-reactive bands were visualized by enhanced chemiluminescence (Pierce Biosciences). The reactive bands were quantified using an Alpha Innotech Fluorochem 8000 imaging system.
Solutions
Ringer solution used for mouse RPE cells contained (mm): 135 NaCl, 5 KCl, 10 glucose, 10 Hepes, 1 MgCl2, 1.8 CaCl2, pH 7.4 with NaOH. Isolation solution used for mouse RPE cells contained (mm): 135 NMDG, 5 KCl, 10 glucose, 3 EDTA, 3 l-cysteine, 10 Hepes, 1 MgCl2, 1.8 CaCl2, pH 7.4 with HCl. ‘Low Ca2+’ patch pipette solution contained (mm): 140 CsCl, 4 MgCl2, 0.062 CaCl2, 5 EGTA acid, 10 Hepes, 3.1 Na2-ATP, 0.42 Na2-GTP, pH 7.1 adjusted with CsOH. Calculated free Ca2+ was 3.1 nm. In the ‘high Ca2+’ pipette solution, CsCl was reduced to 133 mm and total CaCl2 was increased to 3.5 mm, so that the calculated free Ca2+ was 624 nm‘normosmotic’ (1T) extracellular solution contained (mm): 103.5 NaCl, 4 NaHCO3, 0.8 NaH2PO4, 5 pyruvic acid, 20 CsCl, 2 CaCl2, 1 MgCl2, 5 glucose, 10 Hepes, 30 mm mannitol, pH 7.4 with NaOH. Osmolality was 303 mosmol kg−1 for both intra- and normosmotic extracellular solutions (Micro Osmometer, Model 3300; Advanced Instrument, Norword, MA, USA). ‘Hyposmotic’ extracellular solution (0.9T, i.e. 274 mosmol kg−1) was obtained by omitting mannitol from the 1T solution. ‘Hyperosmotic’ extracellular solutions were obtained by increasing the mannitol concentration to 90 mm (1.2T) or 140 mm (1.36T). In some experiments, ‘hyperosmotic’ 1.2T solution was obtained by adding 50 mm NaCl to the ‘hyposmotic’ 0.9T solution.
Data analysis
Currents were normalized to cell membrane capacitance, Cm. Mean values for Cm were: 10.4 ± 0.4 pF (n = 217) for HEK 293 cells; 36.2 ± 4.2 pF (n = 23) for HeLa cells; 26.7 ± 4.6 pF (n = 14) for ARPE-19 cells; 115.4 ± 4.8 pF (n = 69) for isolated mouse RPE cells. Although we did not measure the membrane capacitance systematically during the time course of an experiment, it appeared that cell capacitance did not change significantly during recording. On average Cm increased 10 ± 10% in hypertonic solution (n = 7) whereas hyposomotic solutions caused on average a 19 ± 7% increase in Cm(n = 17). In any case, we do not believe that these small changes (<2 pF) in capacitance are reliable, considering that small changes in bath level or other stray capacitance could contribute to changes in measured Cm during the experiment. Ross et al. (1994) also report that during hypotonic swelling of Jurkat T-cells, changes in membrane capacitance are quite modest.
Data are expressed as mean ± s.e.m. Changes in current amplitude induced by cell shrinkage or swelling are expressed relative to the control condition, each cell being its own control. Paired Student's t tests were used to test for statistical analysis, and a difference was considered statistically significant when P was <0.05.
Results
Expression of hBest1 and mBest2 in various cell lines
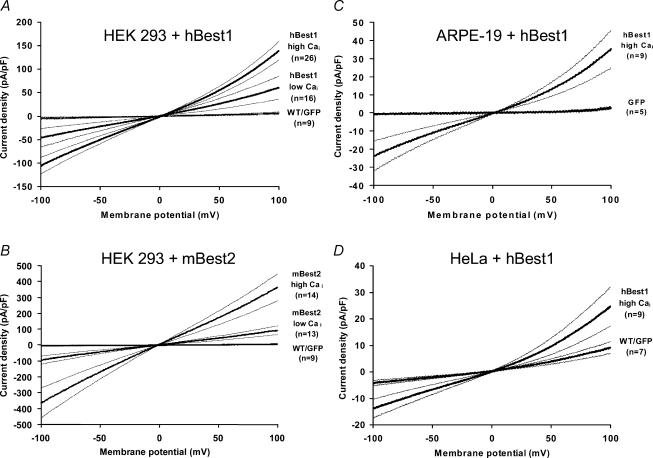
HEK 293 cells transiently transfected with hBest1 or mBest2 were subjected to whole-cell patch clamp using solutions that eliminated cation currents and set the Cl− equilibrium potential close to 0 mV. Free intracellular Ca2+ (Cai) was buffered to either 3 nm (low Cai) or 620 nm (high Cai) with EGTA. Figures 1A and B show average current–voltage (I–V) relationships obtained with slow ramp protocols (see Methods) in HEK 293 cells transfected with either EGFP alone, EGFP + hBest1 or EGFP + mBest2. In HEK 293 cells transfected with EGFP alone, currents were consistently small regardless of Cai. Current densities in EGFP-transfected HEK 293 cells at −100 mV were −2.0 ± 7.0 pA pF−1(n = 4) in low Cai and −7.7 ± 5.9 pA pF−1(n = 4) in high Cai. These values did not differ from non-transfected cells (n = 5, not shown). Because the current values in wild-type (WT) and EGFP-transfected cells were the same, these groups were usually combined (WT/GFP in Fig. 1).
Figure 1. Expression of hBest1 and mBest2 in various cell lines.
Average current–voltage (I–V) relationships (thick lines) ± s.e.m. (thin lines) obtained with slow ramp protocols (see Methods) in HEK 293 cells transfected with either EGFP alone or EGFP + hBest1 (A), EGFP alone or EGFP + mBest2 (B), in ARPE-19 cells transfected with either EGFP alone or EGFP + hBest1 (C), and in HeLa cells transfected with either EGFP alone or EGFP + hBest1 (D). For each cell, currents were normalized to cell membrane capacitance to produce current density (in pA pF−1).
In contrast, cells transfected with EGFP + hBest1 or EGFP + mBest2 exhibited a large Cl− current. As already reported in HEK 293 cells (Sun et al. 2002; Qu et al. 2004), the current had a roughly linear I–V relationship, reversed at the expected Cl− equilibrium potential and was stimulated by Cai. Under these recording conditions, both hBest1 and mBest2 produced a Cl− current even with 3 nm free Cai (respectively, −46.4 ± 19.6 pA pF−1(n = 16) and −94.3 ± 26.6 pA pF−1(n = 13) at −100 mV, but the current amplitude doubled (with hBest1) or tripled (with mBest2) when Cai was increased to 620 nm (respectively, −105.7 ± 17.5 pA pF−1(n = 26) and −364.5 ± 92.9 pA pF−1(n = 14) at −100 mV). At 620 nm, Cai was probably saturating bestrophin currents, as increasing Cai to 10 μm had no additional effect on hBest1 current amplitude (n = 5, data not shown).
As recently demonstrated for mBest2 (Qu et al. 2004), we found that transient expression of hBest1 also produced a Cl− current in two other human epithelial cell lines, ARPE-19 (Fig. 1C) and HeLa cells (Fig. 1D). These cells had a very small current when they were either not transfected or transfected with EGFP alone (−1.0 ± 0.3 pA pF−1(n = 5) for ARPE-19 cells and −4.2 ± 1.0 pA pF−1(n = 7) for HeLa cells, at −100 mV in high Cai), but the current strongly increased when transfected with hBest1 (−23.9 ± 8.3 pA pF−1(n = 9) for ARPE-19 cells and −13.9 ± 3.5 pA pF−1(n = 9) for HeLa cells). Although the Cai dependence of the hBest1-induced current was not examined in ARPE-19 and HeLa cells, the I–V relationship obtained in high Cai was very similar to that obtained in HEK 293 cells. The similarity in the hBest1-induced current in three different cell lines strengthens the likelihood that the current was encoded by hBest1, and not the result of an upregulation of an endogenous current. Also, transfection of HEK 293 and HeLa cells with the G299E mutant of hBest1, a point mutant associated with Best disease, did not induce currents: current amplitudes were not different from EGFP/WT controls (−1.9 ± 1.0 pA pF−1(n = 4) for HEK 293 cells and −3.7 ± 1.7 pA pF−1(n = 7) for HeLa cells, both at −100 mV and in high Cai).
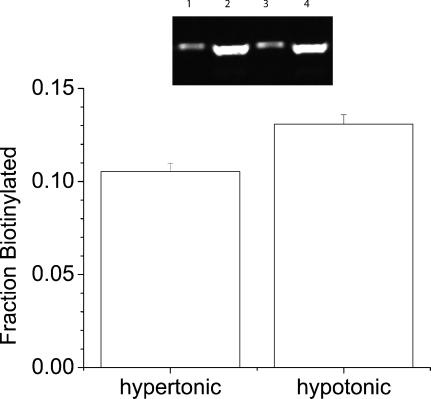
We have previously shown, using immunocytochemistry and cell surface biotinylation that mBest2 and xBest2 are expressed on the cell surface in transiently transfected cells (Qu et al. 2003; Qu et al. 2004). To determine whether hBest1 is expressed on the cell surface, we biotinylated intact cells with a membrane-impermeant biotinylation reagent (Fig. 2). Approximately 12% of the total hBest1 was found on the cell surface under these conditions. This agrees with our immunocytochemical data (unpublished) and data of Tsunenari et al. (2003), that the majority of hBest1 is located in intracellular membranes. However, the fraction of hBest1 at the cell surface does not appear to be strongly affected by the osmotic conditions (Fig. 2).
Figure 2. hBest1 is expressed on the cell surface.
Transiently transfected HEK 293 cells were biotinylated as described in Methods. Inset: Western blot. Cells were bathed in hypotonic medium (lanes 1 and 2) or hypertonic medium (lanes 3 and 4). Lanes 1 and 3 are biotinylated hBest1. Lanes 2 and 4 are nonbiotinylated. The fraction of hBest1 biotinylated by cell surface biotinylation reagent is quantified in the graph (mean of three experiments).
Effect of hyperosmotic cell shrinkage on hBest1 currents in HEK 293 cells
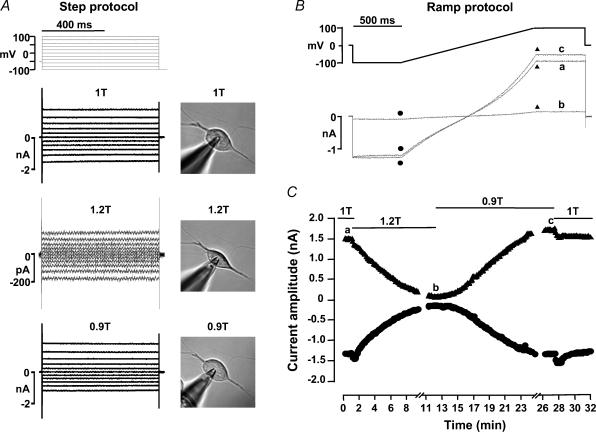
Figure 3 shows an experiment performed on a HEK 293 cell transfected with EGFP + hBest1 with high Cai in the patch pipette. Under normosmotic conditions (1T), a large, time-independent current was observed (Fig. 3A, top traces). When 60 mm mannitol was added to the extracellular solution, which increased the osmolality by 20% from 303 to 364 mosmol kg−1 (1.2T), the current was strongly inhibited (Fig. 3A, middle traces). This was accompanied by a clear shrinkage of the cell as indicated by the micrograph next to the current traces. The current inhibition was reversible upon a subsequent reduction in the osmolality from 364 to 274 mosmol kg−1 (0.9T), and this was accompanied by an increase in cell volume (Fig. 3A, bottom traces). The time course of the current response to hyperosmotic shrinkage and hyposmotic swelling was followed using a repetitive ramp protocol as described in Fig. 3B. Current amplitudes at −100 and +100 mV were continuously measured every 8 s at the beginning and end of each 1.35 s duration voltage ramp (Fig. 3C). Hyperosmotic shrinkage induced a progressive inhibition of hBest1 current at both potentials, with 50% inhibition occurring within ∼4 min. In this cell, hyperosmotic shrinkage reduced the current by 90% within 10 min (compare traces b and a in Fig. 3B). The current recovered its amplitude following a similar slow time course when the cell was exposed to 0.9T solution. A steady state was obtained at ∼15 min in hyposmotic solution, and hBest1 current was ∼10% above its initial amplitude. Finally, the cell was returned to normosmotic 1T solution, and the current returned to its initial amplitude.
Figure 3. Effect of hyperosmotic cell shrinkage on hBest1 currents in HEK 293 cells.
The patch pipette contained high Cai solution. A, individual current traces obtained in response to the step protocol indicated on top. Top traces: normosmotic, 1T. Middle traces: hyperosmotic, 1.2T. Bottom traces: hyposmotic, 0.9T. Corresponding changes in cell volume are illustrated by the micrographs. B, ramp protocol and corresponding current traces. C, time course of the current amplitudes at −100 mV (•) and +100 mV (▴) in response to hyperosmotic shrinkage and hyposmotic swelling. The cell was exposed to normosmotic (1T), hyperosmotic (1.2T), hyposmotic (0.9T) and normosmotic solutions as indicated by the solid lines in C. The individual current traces in B were obtained at times indicated by the corresponding letters in C. Cell membrane capacitance was 11.3 pF.
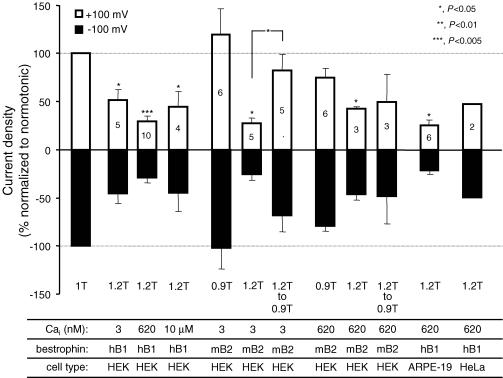
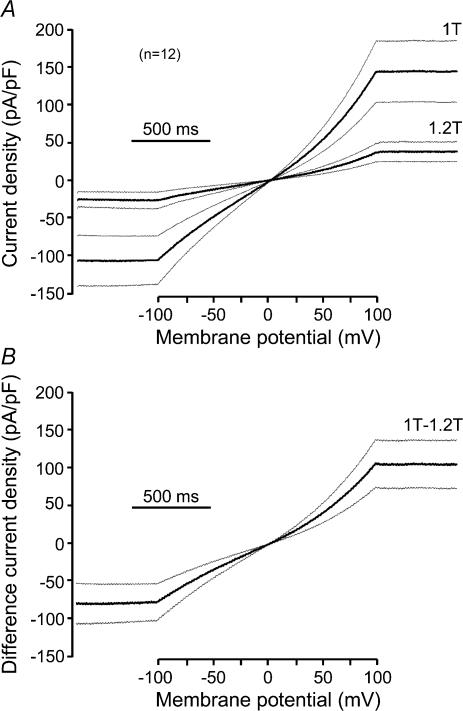
The effect of hyperosmotic shrinkage in high Cai was tested in a total of 10 HEK 293 cells expressing hBest1 + EGFP obtained from three different cultures. In four of these cells, the hyperosmotic 1.2T solution was made by increasing the NaCl concentration by 30 mm. In the other six cells, osmolality was increased by adding 60 mm mannitol. The results were the same in both conditions. On average, hBest1 current decreased by 71.2 ± 6.0% at −100 mV and 70.2 ± 5.4% at +100 mV when exposed for 6.1 ± 1.0 min to a 1.2T solution (P < 0.002, n = 10, Fig. 9). Figure 4 shows the average current traces (normalized to cell membrane capacitance) obtained in normosmotic 1T and hyperosmotic 1.2T solution during the standard ramp protocol (Fig. 4A) and the average current difference for the two conditions (Fig. 4B). Hyperosmotic solutions reduced the amplitude of the current equally at each membrane potential, so that the I–V relationships for the 1T solution, the 1.2T solution and the difference current had similar shapes. The normalized I–V curves were nearly superimposable (not shown).
Figure 9. Summary of the effects of cell volume changes on hBest1 and mBest2 currents.
Cells were exposed to normosmotic solution (1T) and bestrophin current density was recorded at −100 mV (bottom histograms) or +100 mV (top histograms). The cells were subsequently exposed to either hyperosmotic (1.2T) or hyposmotic (0.9T) solutions, and the changes in current densities were normalized to that obtained in 1T (−100% at −100 mV; +100% at +100 mV). When indicated by 0.9T to 1.2T, the cells experienced a hyposmotic challenge after the initial hyperosmotic one. Summarized are experiments performed in: HEK 293 cells transfected with hBest1 + EGFP and whole-cell voltage clamped with 3 nm, 620 nm or 10 μm Cai; HEK 293 cells transfected with mBest2 + EGFP and with 3 nm or 620 nm Cai; HeLa and ARPE-19 cells transfected with hBest1 + EGFP and with 620 nm Cai. The histograms show the means ± s.e.m. of the number of experiments indicated in the top histograms.
Figure 4. Effect of hyperosmotic cell shrinkage on hBest1 currents in HEK 293 cells.
A, average current traces (thick lines, normalized to cell membrane capacitance) and s.e.m. (thin lines) of 12 HEK 293 cells transfected with EGFP + hBest1 and exposed first to normosmotic 1T and subsequently to hyperosmotic 1.2T solutions during the standard ramp protocol. The cells were whole-cell voltage clamped with high Cai in the patch pipette. The x axis indicates the changes in membrane potential during the ramp protocol. B, average current difference (thick line) and s.e.m. (thin line) for the two conditions shown in A.
Effect of hyposmotic cell swelling on hBest1 currents in HEK 293 cells
The next series of experiments was aimed at testing whether hyposmotic solution alone had any effect on hBest1 current. As HEK 293 cells possess an endogenous swelling-activated Cl− current (ICl(swell)) or volume-regulated anion channel (VRAC) (Nilius & Droogmans, 2003; Sardini et al. 2003), we first examined the effect of 0.9T hyposmotic swelling on WT/GFP cells. When WT/GFP HEK 293 cells were exposed to hyposmotic 0.9T solution, a swelling-activated VRAC current was observed in 8 out of 16 cells, and its amplitude was small, averaging 6.2 ± 3.1 pA pF−1 at −100 mV and 5.1 ± 3.2 pA pF−1 at +100 mV. These values are smaller than those reported by other investigators, who have used more severe hyposmotic conditions. Increases of ∼20 pA pF−1 have been reported for 0.6T–0.7T solutions. A similar amplitude of VRAC current was found in HEK 293 cells transfected with the dominant negative G299E mutant of hBest1 (n = 4, not shown). As the amplitude of VRAC current was small with respect to the amplitude of hBest1 current, we anticipated that VRAC might cause little interference with the effect of hyposmotic swelling on hBest1 current. We then exposed HEK 293 cells expressing hBest1 + EGFP to a hyposmotic 0.9T solution while continuously recording the current elicited by voltage ramps. The response varied greatly from cell to cell: six out of eight cells in low Cai and 16 out of 35 cells in high Cai responded by an increase of >10% in total current. Interestingly, in the hBest1 cells that did not respond, the current density was on average >2-fold larger (P < 0.05) than the cells that did respond.
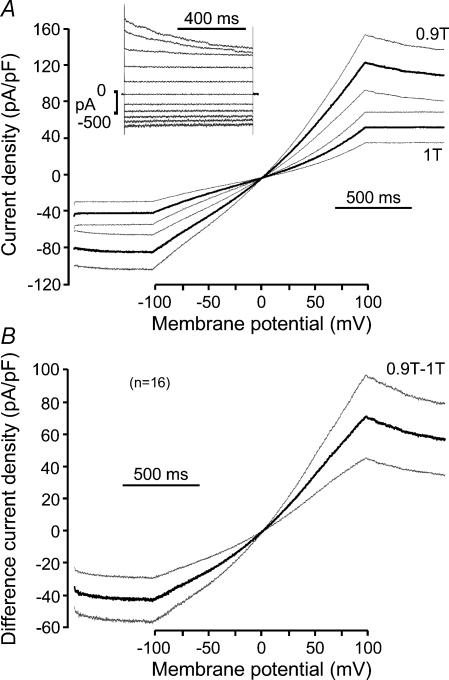
Figure 5 summarizes the results of the 16 cells responding to hyposmotic solution with high Cai. When these cells were exposed to 0.9T solution, the current progressively increased to reach a steady state at 6.1 ± 0.9 min (n = 16). Shown in Fig. 5 are the average current traces (normalized to cell membrane capacitance) obtained in normosmotic 1T and hyposmotic 0.9T solution during the standard ramp protocol (Fig. 5A) and the average current difference for the two conditions (Fig. 5B). While the average ramp I–V relationships had similar linear shapes in normosmotic and hyposmotic conditions, the currents during the 500 ms steps before and after the ramp clearly differed. Unlike the hBest1 current in 1T condition which was time independent, the currents in 0.9T showed a time-dependent inactivation at +100 mV, and recovery from inactivation at −100 mV. The individual current traces obtained during a step protocol (inset in Fig. 5A) further illustrate the time-dependent behaviour of the currents in hyposmotic solution. This current response of hBest1-transfected HEK 293 cells to hyposmotic swelling had all the characteristic features of a VRAC current (Sardini et al. 2003). However, its amplitude was 8–10-fold larger than the VRAC current in WT/GFP cells, suggesting that moderate expression of hBest1 may facilitate the development of, or contribute to, a VRAC current.
Figure 5. Effect of hyposmotic cell swelling on hBest1 currents in HEK 293 cells.
A, Average current traces (thick lines, normalized to cell membrane capacitance) and s.e.m. (thin lines) of 16 HEK 293 cells transfected with EGFP + hBest1 and exposed first to normosmotic 1T and subsequently to hyposmotic 0.9T solutions during the standard ramp protocol. The cells were whole-cell voltage clamped with high Cai in the patch pipette. The x axis indicates the changes in membrane potential during the ramp protocol. The inset shows individual current traces obtained for one of these cells in response to the step protocol described in Fig. 1A. B, average current difference (thick line) and s.e.m. (thin line) for the two conditions shown in A.
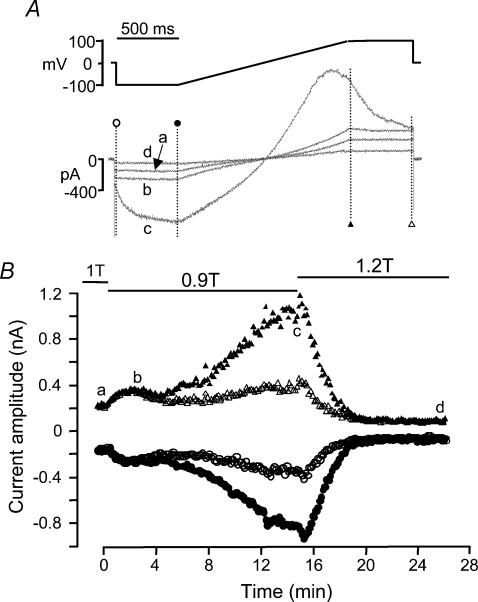
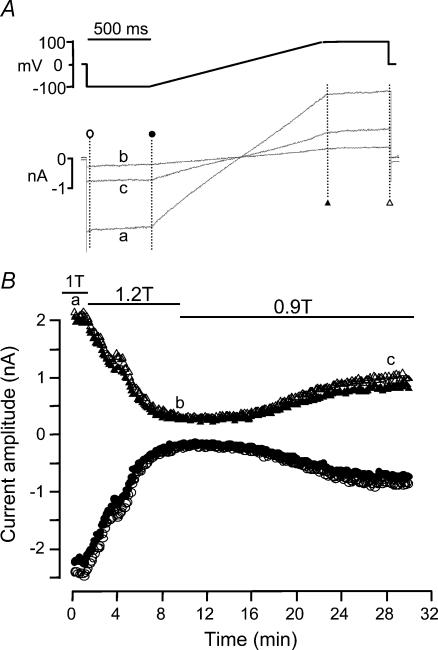
In an attempt to separate hBest1 and VRAC currents, current amplitudes were monitored at the beginning and end of the 500 ms steps to −100 mV and +100 mV, which preceded and followed each ramp protocol. A difference between the amplitudes at the onset and at the end of the pulse indicates a time-dependent component in the total current. Because the hBest1 current is time independent, this measurement allows us to separate, at least qualitatively, hBest1 and VRAC currents. Figure 6 shows a typical experiment performed on an HEK 293 cell transfected with EGFP + hBest1 with low Cai in the patch pipette. At the beginning of the experiment, when the cell was in normosmotic solution (trace a), a typical hBest1 current was observed, with no time dependence at either −100 or +100 mV. Exposing the cell to a hyposmotic 0.9T solution induced a biphasic increase in the current amplitude. During the first ∼2 min, the current increased to ∼60% above control, but remained essentially time independent (trace b), suggesting that this increase was due to a rise in hBest1 current. The current remained essentially stable at this level for an additional ∼2 min and then resumed increasing. During this second phase of increase, the current developed time-dependent activation and inactivation (trace c). This time dependence indicates that activation of VRAC was responsible for this second and more robust increase in current. After hyposmotic swelling, the cell was exposed to a 1.2T hyperosmotic solution, and the stimulatory effect disappeared as well as the time dependence (trace d). After ∼6 min in 1.2T solution, only a time-independent current remained, whose amplitude at −100 and +100 mV was only ∼40% of that in 1T, indicating inhibition of hBest1 current.
Figure 6. Effect of hyposmotic cell swelling on hBest1 currents in HEK 293 cells.
The patch pipette contained low Cai. A, ramp protocol and current traces at times indicated by the corresponding letters in B. B, time course of the current amplitudes at −100 mV (circles) and +100 mV (triangles) to hyperosmotic shrinkage and hyposmotic swelling at times indicated by the corresponding symbols in A. The cell was first exposed to normosmotic (1T) solution, and then to hyposmotic (0.9T) and hyperosmotic (1.2T) solutions as indicated by the solid lines. Cell membrane capacitance was 22.0 pF.
The effects of hyposmotic swelling on hBest1 (time-independent) and VRAC (time-dependent) currents were clearly separated in a total of seven cells (five in low Cai and two in high Cai). In these cells, hyposmotic swelling led to a stimulation of hBest1 current which varied from 30 to 70%. However, due to the uncertainty in the relative contribution of each current and the poor pharmacology of Cl− channels, no attempt was made to further quantify these effects.
Relationship of hBest1 current amplitude to cell volume
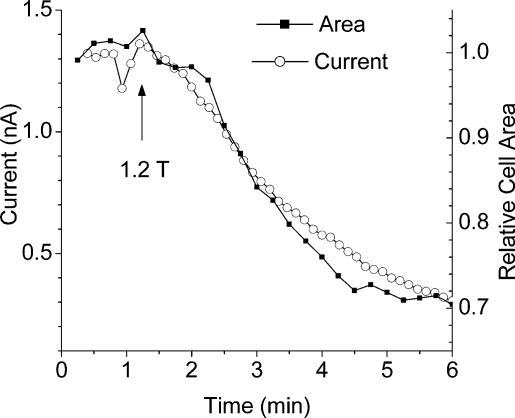
Figure 3 shows that hyperosmotic solutions produce both cell shrinkage and a decrease in hBest1 current. To determine whether the change in cell volume and hBest1 current occurred with the same time course, we imaged cells at 15 s intervals during a voltage-clamp experiment. In the experiment in Fig. 7, cell volume and hBest1 changed with virtually identical time courses. In the three cells we examined in detail, the current decreased with a τ = 1.6 ± 0.2 min and the cell volume changed with a τ = 1.5 ± 0.2 min
Figure 7. Time course of change in cell volume and hBest1 current.
Patch pipette contained high Cai. The cell was exposed to hyperosmotic (1.2T) solution at the arrow. Cell area was measured from high-resolution images and current amplitudes from voltage-clamp ramps.
Effect of osmolality on mBest2 currents in HEK 293 cells
The above results indicate that the hBest1 current is sensitive to osmolality, and its expression promotes VRAC activation by cell swelling. To examine whether these effects were specific to hBest1, we repeated the same type of experiments in HEK 293 cells transfected with mBest2. Figure 8 shows a typical experiment performed in high Cai. Under normosmotic condition (1T), a large, essentially time-independent mBest2 current was observed (Fig. 8A, trace a). Exposure of the cell to 1.2T hyperosmotic solution strongly inhibited this current by ∼80% within 8 min (trace b). Upon application of a hyposmotic solution, the current slowly increased again, and about 40% of the inhibition recovered within ∼10 min (trace c). Interestingly, hyposmotic swelling did not elicit any time-dependent VRAC current, as the current amplitudes at the beginning and end of the 500 ms steps to −100 mV and +100 mV were very similar throughout the entire 30 min experiment (Fig. 8B). In a total of 20 mBest2-expressing HEK 293 cells tested (11 in low Cai and 9 in high Cai), hyposmotic swelling, tested either alone (12 cells) or after hyperosmotic shrinkage (8 cells) never induced a time-dependent current. Hyposmotic swelling had no effect on the time-independent (mBest2) current in high Cai (n = 6, Fig. 9) but increased the current in three out of six cells in low Cai by 40–60%. After hyperosmotic shrinkage, hyposmotic swelling increased mBest2 current back to ∼70% of its initial amplitude in a normosmotic condition in low Cai (n = 5, Fig. 9), but had no effect in high Cai (n = 3, Fig. 9). These results indicate that, like hBest1, mBest2 is sensitive to cell volume. However, unlike hBest1, expression of mBest2 did not promote VRAC activation by cell swelling.
Figure 8. Effect of osmolality on mBest2 currents in HEK 293 cells.
The patch pipette contained high Cai. A, ramp protocol used and individual current traces obtained at times indicated by the corresponding letters in B. B, time course of current amplitudes at −100 mV (circles) and +100 mV (triangles) in response to hyperosmotic shrinkage and hyposmotic swelling at times indicated by the corresponding symbols in A. The cell was first exposed to normosmotic (1T) solution, and then to hyperosmotic (1.2T) and hyposmotic (0.9T) solutions as indicated by the solid lines. Cell membrane capacitance was 17.6 pF.
The fact that Cl− currents in HEK 293 cells expressing hBest1 or mBest2 are sensitive to cell volume changes suggests that bestrophin currents are volume sensitive. However, another possibility is that bestrophin expression upregulates an endogenous current or alters the trafficking of an endogenous channel to the plasma membrane, which would show a volume sensitivity. To test this hypothesis, hBest1 was expressed in two other cell lines. We assumed that if the volume sensitivity of the hBest1 current was the same in different cell lines, this would strengthen the likelihood that it is the current encoded by hBest1 and not an endogenous current which is volume sensitive. As shown above (Fig. 1), expression of hBest1 in HeLa cells produced a hBest1 current that was similar to the one in HEK 293 cells. Currents in HeLa cells were also sensitive to hyperosmotic shrinkage (not shown).
Figure 9 summarizes our results. Hyperosmotic shrinkage consistently inhibited by 50–70% hBest1 current in HEK 293, ARPE-19 and HeLa cells, and mBest2 current in HEK 293. In HEK 293 cells where most experiments were performed, we examined whether intracellular Ca2+ played a role, but found no significant difference in the degree of inhibition by hyperosmotic shrinkage of mBest2 and hBest1 currents at 3 nm, 620 nm or 10 μm Cai. As shown above, the effect of hyposmotic swelling on hBest1 current was difficult to quantify because of the interference of VRAC current. In contrast, in mBest2-expressing cells, where VRAC was not activated, hyposmotic swelling increased mBest2 current in 50% of the cells in low Cai, although on average the effect was not significant. When hyposmotic swelling followed hyperosmotic shrinkage, mBest2 current recovered most of its initial amplitude in low Cai but not in high Cai.
Effect of hyperosmotic shrinkage on CFTR current
To evaluate the degree of specificity of the effects of volume changes on bestrophin currents, we examined the effect of hyperosmotic shrinkage on another Cl− current unrelated to bestrophin family. For this, HEK 293 cells were transfected with the human cystic fibrosis transmembrane conductance regulator (hCFTR) cDNA and whole-cell patch-clamped in high Cai. The hCFTR current was activated by 50 μm forskolin, a direct activator of adenylyl cyclase, and 1 mm 3-isobutyl-1-methylxanthine (IBMX), a broad spectrum phosphodiesterase inhibitor. Under these conditions, Cl− current density was −428.8 ± 140.5 pA pF−1 at −100 mV and 496.4 ± 164.9 pA pF−1 at +100 mV (n = 10). Although the current density was comparable to that observed in mBest2-transfected cells (see Fig. 1), hyperosmotic shrinkage (1.2T) had no effect on hCFTR current. Indeed, application of a 1.2T solution during 7.0 ± 2.1 min resulted in a −9.1 ± 3.9% and −1.9 ± 5.4% change in hCFTR current amplitude at −100 and +100 mV, respectively (n = 6). These results indicate that the volume sensitivity of the bestrophin currents is not simply the consequence of the high transmembrane Cl− fluxes that these channels carry, but is rather due to some specific effect on the channel itself.
Effect of cell volume changes on Cl− current in mouse RPE cells
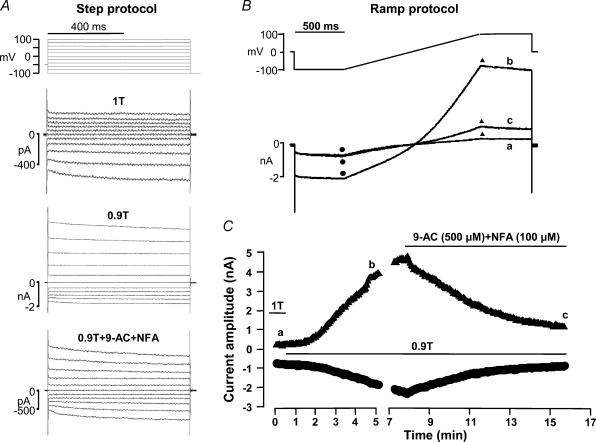
As no animal model of Best disease is available yet, we cannot examine how a mutation in bestrophin 1 affects the function of native RPE cells. However, the above results indicate that bestrophin currents are highly sensitive to hyperosmotic shrinkage. This led us to investigate whether Cl− currents in native RPE cells also possess such feature. Freshly isolated mouse RPE cells were subjected to whole-cell patch clamp using identical solutions and voltage protocols to those used in the experiments on HEK 293 cells. In the experiment shown in Fig. 9, a mouse RPE cell was first exposed to normosmotic solution. The current traces obtained during a step voltage-clamp protocol (Fig. 10A) show essentially time-independent currents, except at very negative potentials where a time-dependent activation was observed. The reversal potential of the current was near 0 mV, which is near the estimated equilibrium potential for Cl− ions. Application of a hyposmotic 0.9T solution strongly increased the current amplitude at every potential. The current outwardly rectified and exhibited a clear inactivation time course at +100 mV. This current increase was strongly inhibited by addition of niflumic acid (NFA, 100 μm) and anthracene-9-carboxylic acid (9-AC, 500 μm), two classical blockers of the VRAC channel. The time course of the current response to hyposmotic swelling was followed using the repetitive ramp protocol as described in Fig. 10B. Current amplitudes at −100 and +100 mV were measured every 8 s at the beginning and end of each 1.35 s duration voltage ramp (Fig. 10C). Hyposmotic swelling increased mouse RPE Cl− currents over a period of 8 min, and addition of 9-AC + NFA reduced this stimulation by ∼80% within 6 min. These results demonstrate the presence of a swelling-activated VRAC current in mouse RPE cells.
Figure 10. Effect of hyposmotic cell swelling on Cl− current in mouse RPE cells.
The patch pipette contained high Cai. A, current traces obtained in response to the step protocol indicated above the traces. Top traces: normosmotic, 1T. Middle traces: hyposmotic, 0.9T. Bottom traces: hyposmotic (0.9T) in presence of niflumic acid (NFA, 100 μm) and anthracene-9-carboxylic acid (9-AC, 500 μm). B, ramp protocol and current traces. C, time course of current amplitudes at −100 mV (circles) and +100 mV (triangles) in response to hyposmotic swelling and inhibition by NFA + 9-AC. The cell was first exposed to normosmotic (1T), and subsequently to hyposmotic (0.9T) conditions, without or with NFA (100 μm) and 9-AC (500 μm) as indicated by the solid lines in C. The current traces in B were obtained at times indicated by the corresponding letters in C. Cell membrane capacitance was 87.2 pF.
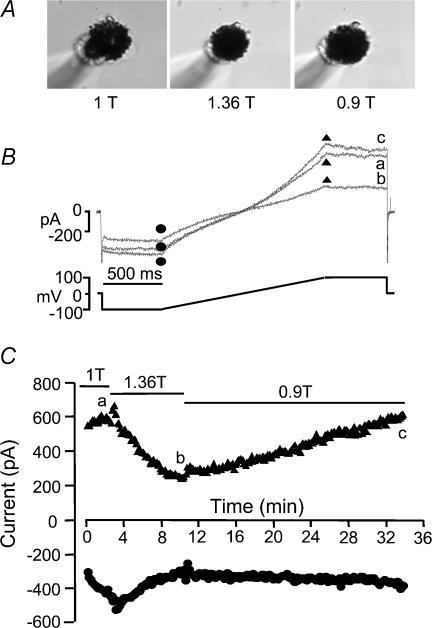
The effect of hyperosmotic shrinkage was subsequently examined. Figure 11 shows an experiment in which a mouse RPE cell was successively exposed to normosmotic (1T), hyperosmotic (1.36T) and hyposmotic (0.9T) solutions while voltage clamped using the ramp protocol. The micrographs in Fig. 11A indicate that the cell underwent the expected volume decrease and increase during the hyperosmotic and hyposmotic stimuli, respectively. During hyperosmotic shrinkage, there was a progressive inhibition of the current until a new steady state was reached within ∼6 min (Figs 11B and C). The Cl− current decreased by ∼60% at +100 mV and decreased by ∼40% at −100 mV. When the extracellular solution was switched to a hyposmotic solution (0.9T), the current slowly increased at +100 mV to return to its control level within 20 min. However, the effect at −100 mV was smaller, and the current amplitude returned to only ∼50% of its control amplitude within the same period.
Figure 11. Effect of cell volume changes on Cl− current in mouse RPE cells.
The patch pipette contained high Cai. A, micrographs of the cell exposed to normosmotic (1T), hyperosmotic (1.36T) and hyposmotic (0.9T) solutions. B, ramp protocol and current traces. C, time course of the current response to hyperosmotic shrinkage and hyposmotic swelling. The cell was exposed to normosmotic (1T), hyperosmotic (1.36T), and hyposmotic (0.9T) solutions as indicated by the solid lines in C. The micrographs in A and the individual current traces in B were obtained at times indicated by the corresponding letters in C. Cell membrane capacitance was 110.9 pF.
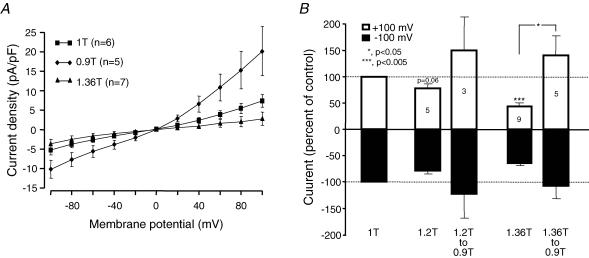
The results of several similar experiments are summarized in Fig. 12. The I–V curves in Fig. 12A demonstrate that total current density was reduced in 1.36T hyperosmotic shrinkage and increased in 0.9T hyposmotic swelling. Both manoeuvres affected the current at each membrane potential, but the effects were more pronounced at positive potentials. Data from paired experiments (Fig. 12B), using each cell as its own control, show that a moderate (1.2T) hyperosmotic shrinkage reduced the current by only 20% both at negative and positive potentials. However, a stronger hyperosmotic shrinkage (1.36T) reduced the current by 50% at +100 mV, but only by ∼30% at −100 mV. In both situations, exposing the cell to a hyposmotic 0.9T solution increased the current above control level, and the effect was larger at +100 than −100 mV. To make sure that current in normosmotic solution was not contaminated by VRAC current, we tested the effect of 9-AC (500 μm) + NFA (100 μm) under control conditions. In seven mouse RPE cells, current amplitude decreased by −13.8 ± 8.7% at −100 mV and −18.9 ± 30.2% at +100 mV, and the effects were not statistically significant (P > 0.2).
Figure 12. Summary of the effects of cell volume changes on Cl− currents in mouse RPE cells.
A, current–voltage (I–V) curves for the Cl− currents in isolated mouse RPE cells. Cells were first exposed to normosmotic solution (1T) and subsequently to either hyperosmotic (1.36T) or hyposmotic (0.9T) solutions. B, Cl− current density was recorded at −100 mV (bottom histograms) or +100 mV (top histograms). In all experiments, the cells were first exposed to normosmotic solution (1T), then to hyperosmotic (1.2T or 1.36T) solutions, and finally some cells were exposed to hyposmotic solution (0.9T). The changes in current densities were normalized to that obtained in 1T (−100% at −100 mV; +100% at +100 mV). The histograms show the means ± s.e.m. of the number of expriments indicated in the top histograms. All experiments were performed with 620 nm Cai.
Discussion
In this paper, we show that expression of either hBest1 and mBest2 in several cell lines induces a novel Cl− current that is strongly inhibited by hyperosmotic solutions and stimulated, but non-systematically and to a lesser extent, by hyposmotic solutions. The latter effect could not be quantified because of a simultaneous activation of a VRAC current.
Stretch-activated or volume-regulated ion channels are thought to play a key role in regulating cell volume (Hoffmann & Simonsen, 1989; Nilius et al. 1997; Lang et al. 1998). The canonical volume-regulated anion channel (VRAC) is outwardly rectifying, exhibits time-dependent inactivation at positive potentials and is stimulated by hyposmotic solutions. In non-transfected HEK 293 cells, we find that the endogenous VRAC current is small (∼6 pA pF−1) in 0.9T hyposmotic solutions. Other investigators who have studied this current in HEK cells (e.g. Nilius et al. 2001; Sardini et al. 2003) have observed larger VRAC currents, but have used considerably lower osmolality solutions (0.7T–0.8T). For our discussion, we define VRAC as an outwardly rectifying, time-dependent current.
Are bestrophins candidates for VRACs?
The VRAC current was about 10-fold larger in hBest1-transfected cells than in non-transfected cells. On this basis, one might be tempted to make the snap conclusion that hBest1 is a component of VRAC. However, the muddled history of the identification of the molecular counterpart of VRAC makes us loath to even consider this conclusion (Sardini et al. 2003; Nilius et al. 1997). P-Glycoprotein, ClC-3, ClC-2, pICln, phospholemman, and the Cl−-HCO3− exchanger have all been proposed as VRACs, but none of these has received acceptance. It seems likely that these proteins somehow regulate the expression or function of endogenous VRAC channels. We think that hBest1 probably also somehow increases endogenous VRAC expression or function. The observation that mBest2 expression does not increase VRAC current supports this suggestion.
There are a number of reasons to think that bestrophins are not VRAC channels, and are rather a different kind of Cl− channel that is both Cai and volume sensitive and may therefore play a different role in cell volume regulation. Reasons for thinking that bestrophins are not canonical VRACs include the following: the kinetics and rectification of VRAC are distinctly different from the bestrophin currents in normosmotic solution. Bestrophin currents are time independent and have linear I–V relationships. Furthermore, the bestrophin current, especially the mBest2 current, is rather insensitive to hyposmolality. Rather, the bestrophin currents are strongly inhibited by hyperosmotic solutions. Quantification of the effects of hyposmolality on bestrophin currents was complicated because of the difficulty in separating it from the endogenous VRAC, but if one accepts the difference in kinetics and rectification as sufficient evidence for differentiating between the two currents, it seems that the bestrophin current is less sensitive to hyposmolality than the endogenous VRAC.
The rather small and non-systematic effect of hyposmolality on bestrophin currents does not necessarily exclude their being regulated by cell swelling. First, we used relatively modest hyposmotic conditions. Bestrophin currents might be stimulated by more extreme conditions. Second, the ability of cells to respond to hyposmolality depends somehow on the ‘set-point’ of the cell. For example, the set-point can be altered by the ionic strength of the cytosol: higher ionic strengths inhibit the ability of VRAC to be stimulated by swelling (Cannon et al. 1998; Nilius et al. 1998). Further, keeping cells for prolonged periods in different ionic conditions alters the sensitivity to RVD and RVI (Lang et al. 1998). However, it seems that bestrophin currents are less sensitive to swelling than VRAC. As shown in Fig. 5, upon shifting to 0.9T, the change in the time-dependent current (VRAC) is slower but larger than the change in the time-independent current (hBest1).
An additional argument against the contribution of bestrophins to VRAC is the fact that the activation of canonical VRAC is usually considered to be independent of Ca2+ (Nilius et al. 1997). However, it has been reported that in some cells a permissive low level of Ca2+ (50 nm) may be required for VRAC activation (Nilius et al. 1997; Szucs et al. 1996). Increases in cell volume are often accompanied by increases in Cai, but the role of Cai remains controversial and unresolved (McCarty & O'Neil, 1992). The consensus is that increases in Cai are not obligatory for regulatory volume decrease, but may facilitate it (Altamirano et al. 1998).
Cell volume regulation in mouse RPE cells
Mouse RPE cells clearly have volume-regulated Cl− currents. A component of the Cl− current in these cells is inhibited by cell shrinkage. However, because of the absence of suitable pharmacological tools, it is not possible to determine whether this current is due to bestrophin. The current differs in some respects from the mBest2 or hBest1 in that it outwardly rectifies. Unfortunately, we have not yet studied mBest1, which may have other properties. In any case, the volume-sensitive currents are likely to be important in the function of RPE cells in the context of the retina. For example, light produces changes in the volume and ionic composition of the subretinal space (Huang & Karwoski, 1992) that might result in osmotic stresses on the RPE.
In addition to regulating the composition of the subretinal space, the RPE Is also involved in phagocytosis of shed photoreceptor discs (Besharse, 1982; LaVail, 1983; Nguyen-Legros & Hicks, 2000). The process of ingestion of photoreceptor discs by RPE cells involves substantial changes in RPE cell morphology and volume, both of which may be dependent on Cl− channels. Engulfment of the photoreceptor discs may involve large changes in the volume of the RPE cell. It has been estimated that each RPE cell ingests >25 000 discs per day (Nguyen-Legros & Hicks, 2000). In liver cells, phagocytosis is accompanied by large osmolyte fluxes via anion channels and transporters (Wettstein et al. 2000).
Acknowledgments
The authors thank Chun Pfahnl and Toni Grim for excellent technical assistance. The study was supported by NIH grants GM60448 and EY014852. R. Fischmeister also received support from INSERM.
References
- Adorante JS. Regulatory volume decrease in frog retinal pigment epithelium. Am J Physiol Cell Physiol. 1995;268:C89–C100. doi: 10.1152/ajpcell.1995.268.1.C89. [DOI] [PubMed] [Google Scholar]
- Altamirano J, Brodwick MS, Alvarez-Leefmans FJ. Regulatory volume decrease and intracellular Ca2+ in murine neuroblastoma cells studied with fluorescent probes. J Gen Physiol. 1998;112:145–160. doi: 10.1085/jgp.112.2.145. 10.1085/jgp.112.2.145. [DOI] [PMC free article] [PubMed] [Google Scholar]
- Bakall B, Marmorstein LY, Hoppe G, Peachey NS, Wadelius C, Marmorstein AD. Expression and localization of bestrophin during normal mouse development. Invest Ophthalmol Vis Sci. 2003;44:3622–3628. doi: 10.1167/iovs.03-0030. [DOI] [PubMed] [Google Scholar]
- Besharse JC. The daily light-dark cycle and rhythmic metabolism in the photoreceptor pigment epithelial complex. Prog Retinal Res. 1982;1:81–124. [Google Scholar]
- Caldwell GM, Kakuk LE, Griesinger IB, Simpson SA, Nowak NJ, Small KW, Maumenee IH, Rosenfeld PJ, Sieving PA, Shows TB, Ayyagari R. Bestrophin gene mutations in patients with Best vitelliform macular dystrophy. Genomics. 1999;58:98–101. doi: 10.1006/geno.1999.5808. [DOI] [PubMed] [Google Scholar]
- Cannon CL, Basavappa S, Strange K. Intracellular ionic strength regulates the volume sensitivity of a swelling-activated anion channel. Am J Physiol Cell Physiol. 1998;275:C416–C422. doi: 10.1152/ajpcell.1998.275.2.C416. [DOI] [PubMed] [Google Scholar]
- Civan MM, Marano CW, Matschinsky FW, Peterson-Yantorno K. Prolonged incubation with elevated glucose inhibits the regulatory response to shrinkage of cultured human retinal pigment epithelial cells. J Membr Biol. 1994;139:1–13. doi: 10.1007/BF00232670. [DOI] [PubMed] [Google Scholar]
- Gallemore RP, Hughes BA, Miller SS. Retinal pigment epithelial transport mechanisms and their contributions to the electroretinogram. Prog Retinal Eye Res. 1997;16:509–566. 10.1016/S1350-9462(96)00037-7. [Google Scholar]
- Gass JDM. Diagnosis and Treatment. St Louis, MO, USA: C.V. Mosby; 1987. Stereoscopic atlas of macular diseases. [Google Scholar]
- Hoffmann EK, Simonsen LO. Membrane mechanisms in volume and pH regulation in vertebrate cells. Physiol Rev. 1989;69:315–382. doi: 10.1152/physrev.1989.69.2.315. [DOI] [PubMed] [Google Scholar]
- Huang B, Karwoski CJ. Light-evoked expansion of subretinal space volume in the retina of the frog. J Neurosci. 1992;12:4243–4252. doi: 10.1523/JNEUROSCI.12-11-04243.1992. [DOI] [PMC free article] [PubMed] [Google Scholar]
- Hughes BA, Miller SS, Farber DB. Adenylate cyclase stimulation alters transport in frog retinal pigment epithelium. Am J Physiol Cell Physiol. 1987;252:C385–C395. doi: 10.1152/ajpcell.1987.252.4.C385. [DOI] [PubMed] [Google Scholar]
- Hughes BA, Miller SS, Machen TE. Effects of cyclic AMP on fluid absorption and ion transport across frog retinal pigment epithelium. Measurements in the open-circuit state. J Gen Physiol. 1984;83:875–899. doi: 10.1085/jgp.83.6.875. 10.1085/jgp.83.6.875. [DOI] [PMC free article] [PubMed] [Google Scholar]
- Kennedy BG. Volume regulation in cultured cells derived from human retinal pigment epithelium. Am J Physiol Cell Physiol. 1994;266:C676–C683. doi: 10.1152/ajpcell.1994.266.3.C676. [DOI] [PubMed] [Google Scholar]
- La Cour M, Zeuthen T. Osmotic properties of the frog retinal pigment epithelium. Exp Eye Res. 1993;56:521–530. doi: 10.1006/exer.1993.1066. 10.1006/exer.1993.1066. [DOI] [PubMed] [Google Scholar]
- Lang F, Busch GL, Ritter M, Volkl H, Waldegger S, Gulbins E, Haussinger D. Functional significance of cell volume regulatory mechanisms. Physiol Rev. 1998;78:247–306. doi: 10.1152/physrev.1998.78.1.247. [DOI] [PubMed] [Google Scholar]
- LaVail MM. Outer segment disc shedding and phagocytosis in the outer retina. Trans Ophthalmol Soc UK. 1983;103:397–404. [PubMed] [Google Scholar]
- McCarty NA, O'Neil R. Calcium signaling in cell volume regulation. Physiol Rev. 1992;72:1037–1061. doi: 10.1152/physrev.1992.72.4.1037. [DOI] [PubMed] [Google Scholar]
- Marmorstein AD, Marmorstein LY, Rayborn M, Wang X, Hollyfield JG, Petrukhin K. Bestrophin, the product of the Best vitelliform macular dystrophy gene (VMD2), localizes to the basolateral plasma membrane of the retinal pigment epithelium. Proc Natl Acad Sci U S A. 2000;97:12758–12763. doi: 10.1073/pnas.220402097. 10.1073/pnas.220402097. [DOI] [PMC free article] [PubMed] [Google Scholar]
- Nguyen-Legros J, Hicks D. Renewal of photoreceptor outer segments and their phagocytosis by the retinal pigment epithelium. Intern Rev Cytol. 2000;196:245–313. doi: 10.1016/s0074-7696(00)96006-6. [DOI] [PubMed] [Google Scholar]
- Nilius B, Droogmans G. Amazing chloride channels: an overview. Acta Physiol Scand. 2003;177:119–147. doi: 10.1046/j.1365-201X.2003.01060.x. 10.1046/j.1365-201X.2003.01060.x. [DOI] [PubMed] [Google Scholar]
- Nilius B, Eggermont J, Voets T, Buyse G, Manolopoulos V, Droogmans G. Properties of volume-regulated anion channels in mammalian cells. Prog Biophys Molec Biol. 1997;68:69–119. doi: 10.1016/s0079-6107(97)00021-7. 10.1016/S0079-6107(97)00021-7. [DOI] [PubMed] [Google Scholar]
- Nilius B, Prenen J, Voets T, Eggermont J, Droogmans G. Activation of volume-regulated chloride currents by reduction of intracellular ionic strength in bovine endothelial cells. J Physiol. 1998;506:353–361. doi: 10.1111/j.1469-7793.1998.353bw.x. 10.1111/j.1469-7793.1998.353bw.x. [DOI] [PMC free article] [PubMed] [Google Scholar]
- Nilius B, Prenen J, Wissenbach U, Bodding M, Droogmans G. Differential activation of the volume-sensitive cation channel TRP12 (OTRPC4) and volume-regulated anion currents in HEK-293 cells. Pflugers Arch. 2001;443:227–233. doi: 10.1007/s004240100676. 10.1007/s004240100676. [DOI] [PubMed] [Google Scholar]
- O'Gorman S, Flaherty WA, Fishman GA, Berson EL. Histopathologic findings in Best's vitelliform macular dystrophy. Arch Ophthalmol. 1988;106:1261–1268. doi: 10.1001/archopht.1988.01060140421045. [DOI] [PubMed] [Google Scholar]
- Peti-Peterdi J, Morishima S, Bell PD, Okada Y. Two-photon excitation fluorescence imaging of the living juxtaglomerular apparatus. Am J Physiol Renal Physiol. 2002;283:F197–F201. doi: 10.1152/ajprenal.00356.2001. [DOI] [PubMed] [Google Scholar]
- Petrukhin K, Koisti MJ, Bakall B, Li W, Xie G, Marknell T, Sandgren O, Forsman K, Holmgren G, Andreasson S, Vujic M, Bergen AA, McGarty-Dugan V, Figueroa D, Austin CP, Metzker ML, Caskey CT, Wadelius C. Identification of the gene responsible for Best macular dystrophy. Nat Genet. 1998;19:241–247. doi: 10.1038/915. 10.1038/915. [DOI] [PubMed] [Google Scholar]
- Qu Z, Fischmeister R, Hartzell C. Mouse bestrophin-2 is a bona fide Cl− channel: Identification of a residue important in anion binding and conductance. J Gen Physiol. 2004;123:327–340. doi: 10.1085/jgp.200409031. 10.1085/jgp.200409031. [DOI] [PMC free article] [PubMed] [Google Scholar]
- Qu Z, Wei RW, Mann W, Hartzell HC. Two bestrophins cloned from Xenopus laevis oocytes express Ca-activated Cl currents. J Biol Chem. 2003;278:49563–49572. doi: 10.1074/jbc.M308414200. 10.1074/jbc.M308414200. [DOI] [PubMed] [Google Scholar]
- Ross PE, Garber SS, Cahalan MD. Membrane chloride conductance and capacitance in Jurkat T lymphocytes during osmotic swelling. Biophys J. 1994;66:169–178. doi: 10.1016/S0006-3495(94)80754-4. [DOI] [PMC free article] [PubMed] [Google Scholar]
- Sardini A, Amey JS, Weylandt KH, Nobles M, Valverde MA, Higgins CF. Cell volume regulation and swelling-activated chloride channels. Biochim Biophys Acta. 2003;1618:153–162. doi: 10.1016/j.bbamem.2003.10.008. [DOI] [PubMed] [Google Scholar]
- Sun H, Tsunenari T, Yau KW, Nathans J. The vitelliform macular dystrophy protein defines a new family of chloride channels. Proc Natl Acad Sci U S A. 2002;99:4008–4013. doi: 10.1073/pnas.052692999. 10.1073/pnas.052692999. [DOI] [PMC free article] [PubMed] [Google Scholar]
- Szucs G, Heinke S, Droogmans G, Nilius B. Activation of the volume-sensitive chloride current in vascular endothelial cells requires a permissive intracellular Ca2+ concentration. Pflugers Arch. 1996;431:467–469. doi: 10.1007/BF02207289. 10.1007/s004240050023. [DOI] [PubMed] [Google Scholar]
- Tsunenari T, Sun H, Williams J, Cahill H, Smallwood P, Yau KW, Nathans J. Structure-function analysis of the bestrophin family of anion channels. J Biol Chem. 2003;278:4114–41125. doi: 10.1074/jbc.M306150200. [DOI] [PMC free article] [PubMed] [Google Scholar]
- Wettstein M, Peters-Regehr T, Kubitz R, Fischer R, Holneicher C, Monnighoff I, Haussinger D. Release of osmolytes induced by phagocytosis and hormones in rat liver. Am J Physiol Gastrointest Liver Physiol. 2000;278:G227–G233. doi: 10.1152/ajpgi.2000.278.2.G227. [DOI] [PubMed] [Google Scholar]
- White K, Marquardt A, Weber BH. VMD2 mutations in vitelliform macular dystrophy (Best disease) and other maculopathies. Hum Mutat. 2000;15:301–330. doi: 10.1002/(SICI)1098-1004(200004)15:4<301::AID-HUMU1>3.0.CO;2-N. 10.1002/(SICI)1098-1004(200004)15:4<301::AID-HUMU1>3.0.CO;2-N. [DOI] [PubMed] [Google Scholar]


