Abstract
The relations between apparent affinity for substrates and operating rates have been investigated by two-electrode voltage clamp in the GABA transporter rGAT1 expressed in Xenopus oocytes. We have measured the transport current induced by the presence of GABA, as well as the charge equilibration rate in the absence of the neurotransmitter, in various experimental conditions known to affect the transporter characteristics. The apparent affinities for GABA and for Na+ were also determined in the same conditions. Two pharmacological actions and three mutated isoforms have been examined. In all cases significant correlations were found between the charge equilibration rates and apparent affinities for both substrates. In particular in the transport process, the apparent affinity for GABA appears to be inversely related to the sum of the unidirectional charge equilibration rates (α+β), while the Na+ apparent affinity is directly related to their ratio (β/α). Together these observations suggest a kinetic basis for GABA affinity with higher turnover rates resulting in lower affinity, and indicate that an efficient uptake requires a compromise between these two parameters.
The GABA cotransporter GAT1, the first neurotransmitter cotransporter to be cloned (Guastella et al. 1990) plays the essential role of clearing the synaptic cleft from GABA, contributing to shape the postsynaptic response (Engel et al. 1998; Chiu et al. 2002), and allowing recycling of the neurotransmitter. This cotransporter is one of the most studied, especially by means of heterologous expression in model systems, and it is particularly amenable to electrophysiological studies in Xenopus oocytes (Mager et al. 1993; Lu & Hilgemann, 1999b; Bossi et al. 2002): in fact, the very high number of protein molecules produced in this way compensates for the extremely low current produced by a single transporter during operation, allowing precise determinations of the biophysical parameters of transport. Electrophysiological experiments have several advantages over uptake measurements: first of all the currents generated by the transporters are measured in voltage-clamp conditions, therefore keeping the electrochemical gradient under strict control; second, different conditions may be tested on the same oocyte, producing better comparison of effects; finally, some of the results may be available immediately, allowing more efficient planning of the experiments. Several parameters related to the transport activity may be derived from these experiments: the number of transporters, from the amount and voltage dependence of the intramembrane charge movement (Mager et al. 1993, 1996); the unidirectional rate constants for charge movement (Forlani et al. 2001); the apparent affinities for Na+ and GABA (Mager et al. 1996; Forlani et al. 2001); the turnover rate, from the number of expressed transporters and the transport-associated current (Mager et al. 1993; Deken et al. 2000). These data have given relevant information to build functional kinetic models (Mager et al. 1996; Su et al. 1996; Hilgemann & Lu, 1999; Fesce et al. 2002).
Along with the description of the properties of the wild-type transporter, several mutations have been performed on rGAT1 with the aim of getting insights into the structure–function relationships of the transport process. Furthermore, the inhibitory or facilitatory effects of some substances on the transport activity of rGAT1 have been reported (Borden, 1996). In most cases, both mutated transporters and the wild-type form in the presence of modulatory agents display alterations in one or more of the parameters listed above. Up to now, however, no attempts have been made to organize these rather scattered observations in a coherent framework that may be of help in understanding the relationships between the various processes that give rise to the transport activity.
Theoretical foundations of the nature of the presteady-state currents in Na+-coupled cotransporters were set out initially for a glucose transporter (Loo et al. 1993), and for the GABA transporter rGAT1 (Mager et al. 1993, 1996); subsequent developments were introduced by Hilgemann (Lu & Hilgemann, 1999a; Hilgemann & Lu, 1999), and by our group, concerning the calculation of the unidirectional rate constants (Forlani et al. 2001), and the proposal of a simplified three-state kinetic scheme for GAT1, relating charge movement to transport current (Fesce et al. 2002; Giovannardi et al. 2003; Peres et al. 2004). While the relevance of this model for other transporters remains to be assessed, starting from these bases we believe we are in a position to attempt to construct a network of cause–effect relationships, which may at least qualitatively incorporate many of the observations seen in a number of situations on rGAT1. These include various mutated isoforms and pharmacological modifications that have been reported in the literature (Mager et al. 1996; Forlani et al. 2001; Whitlow et al. 2003; MacAulay et al. 2003).
To do so, we have revisited many of these studies, confirming previous observations and integrating them with new data with the aim of finding in all cases a general scheme of correlations linking voltage dependence of rates to substrate affinity in the operation of rGAT1.
Methods
Construction of point mutations and mRNA preparation
Mutations of rGAT1 were obtained by site-directed mutagenesis (Quickchange Site-Directed Mutagenesis Kit, Stratagene Inc., Milano, Italy), and were verified by sequencing (MWG Biotech, Sequencing Service, Ebersberg, Germany). cRNAs encoding the rat wild-type and the correct mutated GAT1 cotransporters were synthesized in vitro in the presence of Ribo M7G Cap Analog (Promega) and 200 units of T7 RNA polymerase after linearization of the cDNA with Not I. All enzymes were supplied by Promega Italia (Milan, Italy).
Xenopus laevis oocyte expression
Xenopus laevis frogs were anaesthetized in 0.10% (w/v) MS222 (tricaine methansulphonate) solution in tap water, portions of ovary were removed through a small incision on the abdomen, the incision was sutured and the animal was returned to the water. The oocytes were treated with collagenase (Sigma Type IA), 1 mg ml−1, in Ca+-free ND96 (96 mm NaCl, 2 mm KCl, 1.8 mm CaCl2, 1 mm MgCl2, 5 mm Hepes, pH 7.6), for at least 1 h at 18°C. Healthy looking stages V and VI oocytes were collected and injected with 12.5 ng of cRNA in 50 nl of water, using a manual microinjection system (Drummond). Oocytes were tested 3–10 days after injection. Each frog was not reused more than two times; suitable postoperative care was given to the animals and the interval between operations was longer than 4 months. The frogs were humanely killed after the last collection. Experiments were carried out in strict accordance with the guidelines released by the Italian Ministry of Health (D.L. 116/92) and (D.L. 111/94-B), and the European Community directives regulating animal research (86/609/EEC). All efforts were made to minimize the number of animals used and their suffering.
Electrophysiology and data analysis
Classic two-electrode voltage clamp (GeneClamp, Axon Instruments, Union City, CA, USA or Oocyte Clamp OC-725B, Warner Instruments, Hamden, CT, USA) was used to record membrane currents under voltage-controlled conditions. Reference electrodes were connected to the experimental oocyte chamber via agar bridges (3% agar in 3 m KCl) to minimize chloride effects on junction potential. Borosilicate electrodes, with a tip resistance of 0.5–2 MΩ, were filled with 3 m KCl. The holding potential (Vh) was kept at −40 mV, except when stated otherwise; voltage pulses to test potentials from −120 to +40 mV, in 20 mV increments, were applied and four pulses were averaged at each potential. Signals were filtered at 1 kHz and sampled at 2 kHz. To isolate presteady-state currents, the specific rGAT-1 blocker, SKF89976A (Tocris), was used at a concentration of 30 μm. Subtracted traces were corrected for any remaining leakage and integrated. Transport-associated currents were estimated by subtracting the traces in the absence of GABA from those in its presence for each experimental condition. Data analysis was performed using Clampfit 8.2 (Axon Instruments). All figures were prepared with Origin 5.0 (Origin Lab Corp., Northampton, MA, USA).
Solutions
The external control solution had the following composition (mm): NaCl, 98; MgCl2, 1; CaCl2, 1.8; Hepes, 5 at pH 7.6. When [Na+]o was reduced, it was replaced with TMA+ (tetramethylammonium) and NMDG (N-methyl-d-glutamine). The pH was adjusted with HCl, NaOH or TMAOH. In valproate experiments, in order to keep the chloride concentration constant (48 mm), excess Cl− was replaced with gluconate. GABA was added at the indicated micromolar concentrations to the appropriate solutions. Experiments were done at room temperature (20–24°C).
Results
In order to better characterize the interrelations among the various kinetic parameters that may be electrophysiologically determined in rGAT1, we have used pharmacological treatments known to affect these parameters in different ways, as well as mutated forms of the transporters, also known to give rise to altered behaviours in one or more properties. In all cases the aim was to establish correlations between charge movement characteristics and apparent affinities for Na+ and for GABA.
Effects of valproate
Valproate is an anticonvulsant drug used in the treatment of epileptic seizures and, among other effects on different targets, it has been shown to act on GABA uptake and on the amplitude of the transport-associated currents, with partially contrasting results (Eckstein-Ludwig et al. 1999; Whitlow et al. 2003). Separate measurements of the different electrophysiological parameters at 5–50 mm valproate concentrations, mostly in mGAT3 and some in hGAT1 (Whitlow et al. 2003), have revealed a number of effects that may be summarized as follows: (i) the maximal amount of charge moved in the absence of GABA (Qmax) was not affected by valproate; (ii) valproate increased the rate of presteady-state current relaxations; (iii) both Q versus V and rate versus V curves were shifted towards more positive potentials in hGAT1; (iv) valproate decreased the apparent affinity for GABA; (v) valproate did not affect the apparent affinity for Na+ (mGAT3). Consequently we have re-examined the effects of high valproate concentrations on rGAT1, to check whether they could also be quantitatively accounted for.
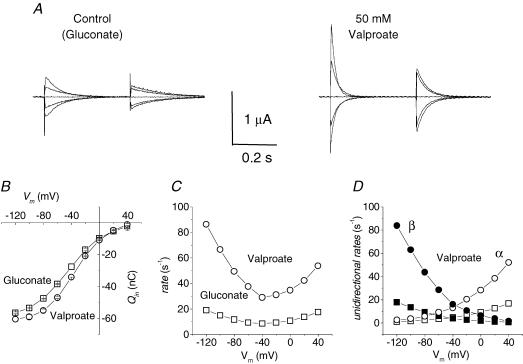
The results shown in Figs 1 and 2 completely reconfirm those previously reported for mGAT3 and hGAT1 (Whitlow et al. 2003); addition of valproate strongly accelerates the decline of the presteady-state currents in the absence of GABA, without appreciable effects on the maximal amount of displaceable charge. The voltage dependence of the charge, plotted here as the charge in the inner transporter position (Qin), according to the convention introduced by our group (Fesce et al. 2002), appears shifted to more positive potentials (Fig. 1B) by about 10 mV. The charge equilibration rate (r) increases three- to fourfold in the presence of 50 mm valproate and shows a rightward shift along the voltage axis analogous to that of the charge curve (Fig. 1C). In terms of the unidirectional outward (α), and inward (β) rate constants for charge movement, derived as: α = r(1 −Qin/Qmax) and β=rQin/Qmax (see Fesce et al. 2002 and the Discussion), the effect of valproate is an enhancement of both processes (Fig. 1D), with the increase in β being somehow larger than that in α, and whose possible implications will be discussed later.
Figure 1. Effects of valproate.
A, presteady-state currents elicited by voltage steps from Vh = −40 mV (range −120 to +40 mV in 40 mV steps) in control and 50 mm valproate solutions in the same representative oocyte. B, the charge versus voltage relationship is shifted in the positive direction with V½ moving from −44 ± 1 mV in gluconate solution to −35 ± 1 mV in valproate; Qmax is not significantly affected. C, the rate of decay is greatly increased by valproate (○) compared with control (□). D, the unidirectional rate constants calculated as α = r(1 – Qin/Qmax) and β =−rQin/Qmax, are asymmetrically increased in the presence of valproate, with inward rate (β) increased more than outward rate (α). Data are means ± s.e.m. from 4 oocytes (same batch).
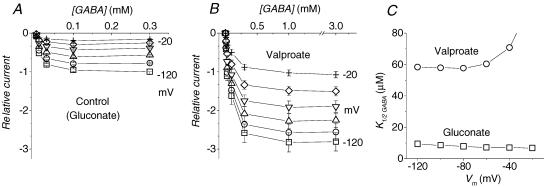
Figure 2. Effects of valproate on GABA apparent affinity.
Transport currents elicited at the indicated membrane potentials (20 mV steps) are plotted as functions of GABA concentrations in the absence (A) and presence of 50 mm valproate (B); note the different [GABA] scales in A and B. In A, 50 mm gluconate was used in order to keep the Cl− concentration constant. C, the GABA concentrations giving rise to half the maximal current (K½(GABA)) at each potential are plotted for the two conditions (□, gluconate: ○, valproate). Means ± s.e.m. from 9 oocytes (2 batches) each tested in the two conditions. For each cell the data were normalized to the current in gluconate at −120 mV and 0.3 mm GABA.
In the presence of GABA, as expected, 50 mm valproate produced a large increase in the transport-associated current (Itr), although this required a greater neurotransmitter concentration to show its full effect (Fig. 2A and B). Indeed the analysis of the apparent GABA affinity, through the estimate of the GABA concentration eliciting the half-maximal transport current at each potential (K½(GABA)), shows that this value is strongly increased (Fig. 2C), indicating a lower affinity. We have previously shown (Fesce et al. 2002) that the transport-associated current at saturating GABA is given by the product Qin×r, and therefore the increase in Itr induced by valproate is qualitatively accounted, on the basis of the results of Fig. 1, by the large increase in r, despite the fact that Qin remains unchanged. Our three-state kinetic scheme (see (Fesce et al. 2002) and the Discussion) predicts that the GABA apparent affinity should be inversely related to the speed of charge equilibration in the absence of GABA, and therefore it is in agreement with the result of Fig. 2C.
In contrast with the effects considered above, no changes in Na+ affinity in the presence of valproate were reported in mGAT3 (Whitlow et al. 2003). As shown in Fig. 3, however, this kind of experiment performed on rGAT1 gave different results. A clear enhancement of the Na+ apparent affinity was evident under the action of valproate compared with the value in 50 mm gluconate. The K½(Na) values plotted in Fig. 3C could be reliably estimated only at voltages < −40 mV, and may be assumed to increase well over 100 mm at more positive membrane voltages (Mager et al. 1993; MacAulay et al. 2003).
Figure 3. Estimation of Na+ apparent affinity in the presence of 50 mm valproate.
Transport currents elicited by 0.3 (A) or 3 (B) mm GABA at the indicated membrane potentials (20 mV steps) are plotted as functions of the Na+ concentrations in the absence (A) and presence of 50 mm valproate (B). In A, 50 mm gluconate was used in order to keep the Cl− concentration constant. C, the Na+ concentrations giving rise to half the maximal current (K½(Na)) at each potential are plotted for the two conditions (□, gluconate; ○, valproate); values were estimated by fitting a Hill equation (Hill coefficient 1.5 (Mager et al. 1993)) to current versus[Na+]o curves from panel A and B. Means ± s.e.m. from 6 oocytes, each tested in the two conditions, from the same batch.
Effects of SKF89976A
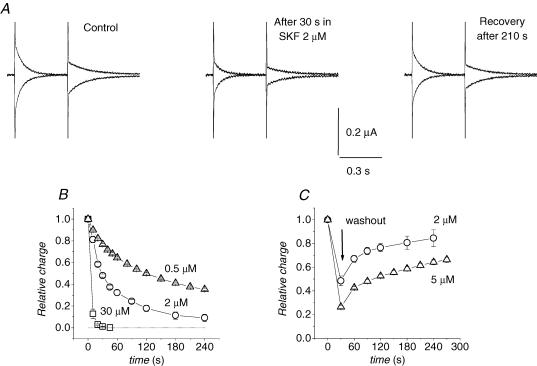
This molecule is typically employed as an experimental tool to isolate the presteady-state currents in GABA transporters (Mager et al. 1993; Forlani et al. 2001), and a very similar molecule, tiagabine, is a commonly used therapeutic agent (Borden, 1996). An IC50 of 0.64 μm has been reported in uptake studies in transfected human cells (Borden, 1996), while in electrophysiological experiments in wild-type GAT1, a concentration of 30 μm is generally able to rapidly and completely block both presteady-state and transport-associated currents. However, recovery from this block is extremely slow and the estimation of the concentration needed for 50% block of the transient current appears difficult to carry out, because of the long time needed to reach equilibrium at low blocker concentrations. Figure 4 illustrates the time course of the presteady-state current reduction and recovery under different SKF89976A concentrations. Two voltage pulses to −120 and to +40 mV were repeatedly applied from a −40 mV holding potential; charge movement appears to be saturated at these two opposite potentials, so the sum of their integrals should correspond to Qmax. Figure 4B shows that even at 0.5 μm SKF89976A a tendency to the complete abolishment of the charge movement is evident, although it occurs more slowly. Similarly, recovery of charge movement after SKF89976A removal is slow and its completion requires quite long times (Fig. 4C).
Figure 4. Time course of presteady-state current block by SKF89976A and washout.
A, isolated presteady-state currents in response to pulses to −120 and +40 mV from Vh−40 mV, from the same representative oocyte in the indicated conditions. B, time course of block in the presence of three different concentrations of SKF89976A. C, time course of recovery from partial block by 2 and 5 μm SKF89976A; data are means ± s.e.m. from of 3 to 5 oocytes for each condition (3 batches).
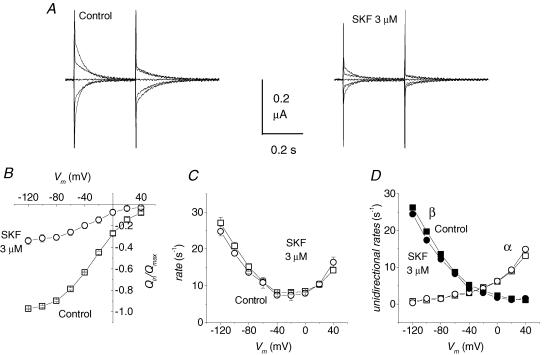
On the other hand, the current traces in Fig. 4A suggest that the relaxation time constants of the presteady-state current are not affected by SKF89976A. We examined this point in more detail in the experiments of Fig. 5, using a blocker concentration of 3 μm. In order to keep a relatively stable degree of block, in terms of amount of remaining displaceable charge, the voltage protocol was applied between 30 and 50 s after the start of SKF89976A superfusion. The relaxation time constant and the amount of displaceable charge recorded under these conditions were compared with controls. On the basis of the results of Fig. 4, the curve of the remaining charge (circles in Fig. 5B) will represent the mean of a decreasing value during the application of the protocol; however, we see in Fig. 5C that the charge equilibration rate remains very similar to the control curve, indicating that SKF89976A does not affect this parameter. Consequently, the unidirectional rate constants, shown in Fig. 5D, remain identical to those of control.
Figure 5. Effects of SKF89976A.
A, presteady-state currents elicited by voltage steps from Vh = −40 mV (range −120 to +40 mV in 40 mV steps) in control and in the presence of 3 μm SKF89976A in the same representative oocyte. B, the charge versus voltage relationship shows a strong reduction in Qmax with only a small voltage shift (V½ = −26 ± 1 in control, −33 ± 3 in the presence of SKF89976A, while the rate of decay (C) is not affected by the blocker (○) compared with control (□). Consequently, the unidirectional rate constants (D), calculated as in Fig. 1, are not changed in the presence of the blocker. Means ± s.e.m. from 4 oocytes of the same batch.
Valproate and SKF89976A appear then to act on different aspects of the charge movement process seen in the absence of GABA: valproate acts mainly on the rate, leaving the maximal displaceable charge substantially unaltered, and with a relatively small effect on the voltage dependence; conversely, SKF89976A mainly reduces the amount of displaceable charge, without significant changes in its voltage dependence, and leaving the equilibration rate unaffected. SKF89976A reduces the availability of transporters able to bind Na+ and GABA, resulting in an effect like a lower protein expression. The alterations produced by SKF89976A on the charge movement parameters complement, therefore, those induced by valproate to test the predictions of our three-state kinetic scheme regarding the transport-associated current and substrate affinities.
Since in our scheme the transport-associated current is given by the product Qin×r, the reduction of Itr in the presence of the blocker is clearly consistent with the reduction in Qin, even though r is unchanged. The very long washout time of SKF89976A makes it difficult to determine the GABA apparent affinity under conditions of constant partial block. The plot of Fig. 4C, illustrating the recovery from a 30 s exposure to 5 μm SKF89976A, shows, however, that in the period between 60 and 210 s after washing out the blocker, the amount of displaceable charge changes between 48 and 64% of the initial value, and the range is even less (74–84%) in the case of recovery from the 2 μm SKF89976A exposure. We considered that this might be a sufficiently stable state to attempt a determination of GABA affinity in a transporter condition affecting only the amount of displaceable charge but not its equilibration rate.
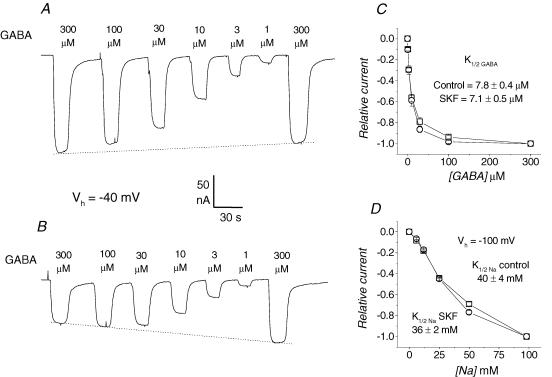
In order to reduce the time needed to complete the measurements, the GABA concentration eliciting the half-maximal transport current was determined in this case only at the holding potential of −40 mV. In each oocyte a sequence of different GABA concentrations, starting and ending with 300 μm, was initially applied in control solution; then 5 μm SKF89976A was added to the perfusate for 30 s. The oocyte was again exposed to the same sequence of GABA concentrations starting at 60 s after the removal of the blocker. Sample recordings of this kind are shown in Fig. 6A and B. Comparing the amplitude of the currents elicited by the first and the last 300 μm GABA exposure in the two traces, it is evident that while under control conditions there is a slight decrease (Fig. 6A), during washout (Fig. 6B) the current elicited by the last exposure is significantly larger (with a mean increase of 46%) than that in response to the first. It is worthwhile to note, as an internal control, that the reduction in transport-associated current between the last 300 μm GABA application in Fig. 6A and the first in Fig. 6B, as well as its increase with time in this latter recording, correspond quite precisely to the block and subsequent recovery of displaceable charge shown in Fig. 4C, indicating a direct relation between these two quantities.
Figure 6. GABA and Na+ affinities under the effects of SKF89976A.
A, inward current elicited by sequential GABA application at the indicated concentrations; a slight decline occurs between the first and last 300 μm application. B, the same sequence of GABA concentrations was superfused onto the same oocyte, during the washout phase, starting 60 s after removal of 5 μm SKF89976A (the duration of the treatment was 30 s); in this case the last 300 μm GABA application was significantly larger (46%) than the first. C, dose–response curves from 5 oocytes treated as in panels A and B; □, control condition; ○, responses after SKF89976A treatment. Both sets of data were normalized assuming linear decrease (or increase) between the first and last 300 μm GABA application, as indicated by the dotted line in A and B. The indicated values of K½(GABA) were obtained by fitting a sigmoidal function to the semilogarithmic plot of the experimental data. D, Na+-response curve from 4 oocytes before and after SKF89976A; experimental protocol as for GABA, with the exception that Vh was −100 mV; transport currents were elicited by 300 μm GABA in the presence of different Na+ concentrations. K½(Na) was estimated by fitting a Hill equation (Hill coefficient 1.5 (Mager et al. 1993)) to the experimental points.
GABA dose–response curves before the application of SKF89976A and during washout are shown in Fig. 6C. In order to compensate for the recovery of charge, the responses to the different GABA concentrations during washout were normalized assuming a linear increase with time (dotted line in Fig. 6B). The control responses were corrected in the same way to take into account the small decrease between the first and last response to 300 μm GABA (dotted line in Fig. 6A). Fitting of the curves in Fig. 6C gave very similar values for the GABA concentrations eliciting half-maximal current under the two conditions (K½ (GABA)= 7.8 ± 0.4 μm in control, and 7.1 ± 0.5 μm after partial block by SKF89976A). These values are also in close agreement with those previously determined at Vh = −40 mV using voltage-pulse protocols (Mager et al. 1993; Forlani et al. 2001).
We have tested the apparent affinity for Na+ in the same way: the transport-associated current elicited by a fixed 300 μm GABA application was measured in the presence of different Na+ concentrations, from 6 to 98 mm, before and during recovery from a 30 s, 5 μm SKF89976A superfusion at Vh = −100 mV. Reduction and recovery behaviours similar to those described above were observed, and the same correction protocol was used in order to determine the Na+ concentration effects after partial inhibition by SKF89976A. The dose–response relationships are plotted in Fig. 6D, and the values of K½(Na) calculated from fitting a Hill equation did not show significant change between the two conditions.
Mutated isoforms
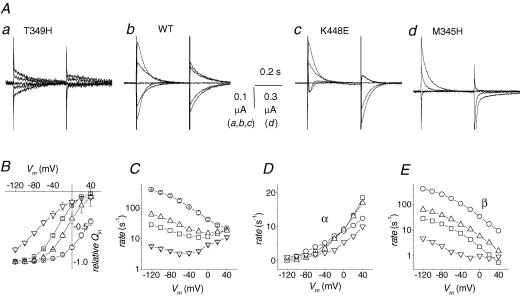
Several mutations have been reported to affect the transport properties of GAT1 (Mager et al. 1996; Bismuth et al. 1997; Bennett et al. 2000; Forlani et al. 2001; MacAulay et al. 2003). We have re-examined these effects in a number of cases attempting to detect repeated features that could be combined in a coherent logical framework. In Fig. 7 the behaviour of the mutated forms T349H, K448E and M345H is compared with that of the wild-type. All these forms have been previously studied (Forlani et al. 2001; MacAulay et al. 2003), and show interesting aspects for our purposes. In the absence of GABA the presteady-state currents are affected in different ways by these mutations. The traces in Fig. 7A clearly show a progressive acceleration of the decline rate from the leftmost panel (the T349H mutation) to the rightmost (the M345H mutation); this goes along with a shift of the amplitude of the transients from more negative to more positive potentials. Compared with the wild-type in which the potential at which half of the charge has moved (V½) is −29 ± 1 mV, in the T349H form the Qin versus V and rate versus V relationships are strongly shifted toward more negative potentials, with an estimated V½ around −70 ± 3 mV, and a reduced equilibration rate in the physiological range of potentials. On the contrary, in the K448E form a positive shift is evident, with V½ = −10 mV, together with a moderate increase in rate. Finally, the intramembrane charge movement is strongly shifted in the positive direction in the M345H form (V½ = +30 mV) with a large increase in the equilibration rate.
Figure 7. Charge movement properties in wild-type GAT1 and mutants.
Oocytes expressing the indicated isoforms were subjected to voltage pulses in the range −120 to +40 mV from Vh=−40 mV. The top row shows examples of presteady-state currents in the absence of GABA. In the bottom row the relative Qin (B), the equilibration rate (C), the outward rate α (D) and the inward rate β (E) are plotted against voltage for the T349H mutant (∇), the wild-type (□), the K448E mutant (Δ) and the M345H mutant (○). Data are means ± s.e.m. from 5 oocytes each for T349H and M345H, 27 for wild-type and 25 for K448E (five different batches). Data for wild-type and K448E are adapted from Forlani et al. (2001).
In all cases, V½ is in good agreement with the position of the minimum of the rate versus voltage curve, the relation expected in a simple two-state reaction.
The corresponding unidirectional rate constants are shown in panels D and E of Fig. 7 and, in contrast to valproate and SKF89976A, we see a differential effect on the two rates, the inward rate being much more strongly affected than the outward rate.
We then compared these effects with the apparent affinities for Na+ and GABA. The forms displaying a rightward shift (K448E and M345H) were already reported to exhibit a higher affinity for Na+ (Forlani et al. 2001; MacAulay et al. 2003), while the T349H form, that shows a leftward shift, was reported to have a lower Na+ affinity (MacAulay et al. 2003).
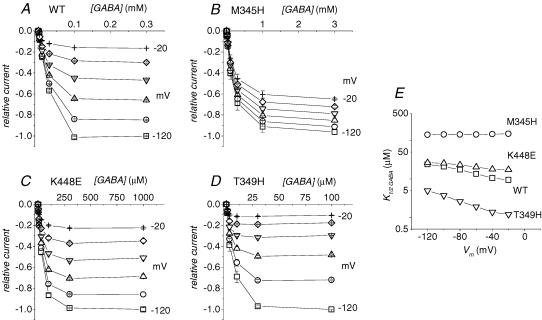
Concerning the GABA apparent affinity, we have performed dose–response determinations on the transport-associated current for wild-type and the three mutants. The results are shown in the current–voltage curves of Fig. 8 where it can be seen that the various forms require quite different GABA concentrations to reach saturation, ranging from 30 μm for the T349H mutant up to 3 mm (or more) for the M345H mutant.
Figure 8. GABA apparent affinity in the mutated isoforms.
Transport currents elicited at the indicated membrane potentials (20 mV steps) are plotted as a function of GABA concentration for the wild-type (A), the M345H (B), the K448E (C) and the T349H (D) forms; note the different [GABA] scales. E, the GABA concentrations giving rise to half the maximal current (K½(GABA)) at each potential are plotted for the four transporters, as indicated. Means ± s.e.m. from 4 oocytes in A, 5 oocytes in B, 8 oocytes in C and 6 oocytes in D. Data for wild-type and K448E are adapted from Forlani et al. (2001).
The value of the GABA concentrations eliciting half-maximal transport current at each potential K½(GABA) is shown in Fig. 8E demonstrating that the apparent affinity for GABA is oppositely affected in the various mutants: the forms displaying a rightward shift of the charge curve, and an increase in rate (K448E and M345H) have lower apparent affinity, while the form exhibiting the leftward shift and the decrease in rate (T349H) displays a significantly increased apparent affinity.
These results on the mutant forms support therefore the validity of an inverse correlation between rate of charge equilibration in the absence of GABA and apparent affinity for the neurotransmitter. The strength of this assertion may be judged by the great similarity between the data shown in Figs 7C and 8E.
Discussion
We have presented in this work a collection of experimental results in which mutations in GAT1 or pharmacological actions affect the way in which substrates interact with the transporter. Analysis of the intramembrane charge movement that arises from the interaction of Na+ reveals that the various treatments may differentially alter the amount of displaceable charge (Qin), its equilibration rate (r), or their voltage dependence. These alterations may be related back to changes in the unidirectional rates of charge movement α and β, which may be easily derived from Qin and r (see above).
Measurements of the apparent affinity for Na+ and for GABA from the amplitude of the transport current show effects that appear to be qualitatively related to the changes in α and β, indicating that charge equilibration rates play an important role in determining the substrate affinities in this transporter. The effects of the treatments and mutations analysed in this work are summarized in Table 1 in qualitative terms.
Table 1.
Qualitative correlations between effects on rates and on affinities
| Effects | ||||
|---|---|---|---|---|
| Treatment or mutation | Unidirectional rates | Voltage dependence | Na+ affinity | GABA affinity |
| Valproate | β increases more than α | Rightward shift (small) | Increased | Decreased |
| SKF | No change in α and β | No change | Unaltered | Unaltered |
| K448E | Increased β at constant α | Rightward shift | Increased | Decreased |
| M345H | Increased β at constant α | Rightward shift | Increased | Decreased |
| T349H | Decreased β at constant α | Leftward shift | Decreased | Increased |
These observations suggest correlations between the behaviour of the unidirectional rate constants and the effects on apparent affinities: changes in affinity appear to require changes in rate constant in particular the affinity for Na+ appears to be directly related to the ratio β/α, while the affinity for GABA is inversely related to the sum (α+β).
Kinetic scheme
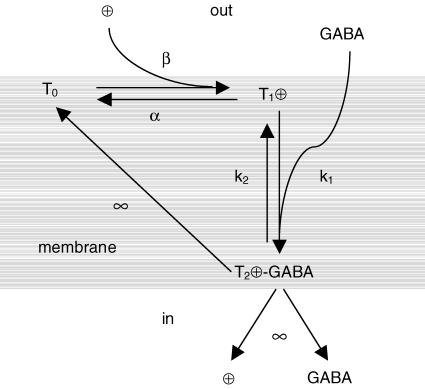
Reference to the three-state kinetic scheme depicted in Fig. 9 will be made to establish the relationships among the effects on Na+ and GABA affinities and the alterations listed in Table 1.
Figure 9. Simple three-state kinetic scheme that accounts for rGAT1 operation.
The empty transporter (T0) with binding sites for Na+ facing the external side of the membrane, cannot bind GABA; binding and translocation of charges (Na+ and possibly Cl−) are tightly coupled, and lead to a transporter state (T1), with charge on the inner side of the membrane electrical field (Qin); this process sets the transporter in a higher energy state and at the same time allows interaction of GABA; binding of the neurotransmitter to T1 (with rate k1) leads to an evanescent state (T2) that immediately dissociates charges and GABA to the cytosol, while the transporter returns to the empty state T0, making the unbinding rate k2 irrelevant. The ⊕ symbol refers to all the charges binding to the transporter prior to GABA interaction.
The main features of the model are summarized in the legend, and a more detailed account may be found in Fesce et al. (2002). The scheme may be analytically solved leading to a set of equations that can be easily interpreted in their physical meaning; the transport-associated current is given by:
| (1) |
which, in saturating GABA conditions becomes:
| (2) |
where Qin is the amount of charge in an inner transporter position, and r = (α+β) is the charge equilibration rate (both measured in the absence of GABA). The experiments on the action of valproate and SKF89976A represent a successful test for eqn (2), at least qualitatively. We have seen that valproate increases the charge equilibration rate 3- to 4-fold, leaving Qin unaltered (Fig. 1). Accordingly, the transport-associated current in the presence of 3 mm GABA may be seen to undergo almost the same increase. In the case of SKF89976A, its effect is concentrated on the reduction in Qin, indicating a reduced number of transporters available for operation, without changes in rate. In agreement, the transport-associated current and the charge are reduced by a very similar percentage (respectively 45% and 48% after 30 s in 5 μm SKF89976A and 30 s washout, see Figs 4C and 6). Therefore these two treatments, each acting separately on the two factors in the product in eqn (2) confirm its validity.
Na+ affinity
The effects of external Na+ concentration on the activity of GAT1 may be studied in three different ways, according to the measured process. In fact an increase in Na+ affects: (i) the uptake of radiolabelled GABA; (ii) the presteady-state currents, shifting the charge curve towards more positive voltages, without changes in the slope or in the Qmax values (Mager et al. 1993; Liu et al. 1998; Forlani et al. 2001); (iii) the transport-associated current, again producing a shift of the I–V curve corresponding to the shift in the Q–V curve (Mager et al. 1993; Liu et al. 1998; Forlani et al. 2001; Fesce et al. 2002).
All three effects may be used to obtain an indication of the apparent affinity for Na+, although clearly the experimental conditions are quite dissimilar, and the values may consequently differ. The first and third approach look at the effects on the complete transport cycle, while the second, with GABA being absent, is based on a partial reaction scheme. We have not used radioactive-uptake measurements because, in order to be correct, they should be done under voltage-clamp, implying relevant experimental difficulties.
With the second approach, the Na+ apparent affinity at zero membrane voltage may be estimated from the position of the Q–V curve in the absence of GABA.
Using Eyring's rate theory (Hille, 2001), the outward and inward unidirectional rates for charge equilibration may be written as:
| (3a) |
| (3b) |
where q is the elementary charge, δ is the fraction of electrical field over which the charge movement occurs, kα is the unbinding rate constant, kβ the binding rate constant, k is the Boltzmann constant and T the absolute temperature.
Since:
| (4) |
the following modified Hill equation, analogous to that derived by Mager et al. (1996) may be obtained:
| (5) |
In this equation KNa(V = 0) is the zero-voltage dissociation constant (equal to kα/kβ, the ratio of unbinding to binding rates), and therefore it represents an indication of affinity for Na+. It is easy to derive the relationship between KNa(V = 0) and the potential at which half of the charge has moved, V½:
| (6) |
and, at V = 0 mV,
| (7) |
formally establishing the relationship between the Na+ dissociation constant KNa(V = 0) and the unidirectional rates. For instance, from the data of Fig. 1D under control conditions, eqn (7) gives a KNa(V = 0)= 516 mm, which coincides with previous estimates (Mager et al. 1996).
The third way to define the Na+ apparent affinity is to estimate the Na+ concentration giving rise to half the maximal transport-associated current at a fixed membrane voltage in the presence of a saturating GABA concentration (K½(Na)). This quantity is voltage dependent, small (around 50 mm) at −120 mV and increasing as the membrane potential is made more positive, up to 343 mm at −20 mV (Mager et al. 1993; MacAulay et al. 2003). It must be noted, however, that for wild-type rGAT1, saturating Na+ concentrations may only be extrapolated, as they appear to be in the range of several hundreds of millimolar, and cannot be experimentally tested because of the risk of osmotic effects on the oocytes. Therefore, extrapolation of the K½(Na)versus voltage curve to 0 mV, gives a value in the same order of magnitude to the zero-voltage dissociation constant obtained from charge movement. As noted above, the conditions under which the two determinations of affinity are made differ. In the charge movement method, in the absence of GABA, only a part of the reaction cycle is performed, while in the presence of GABA the cycle is completed. The fact that the values of KNa(V = 0) and K½(Na) are similar indicates that addition of GABA and completion of the transport cycle do not strongly affect the rates of Na+ interaction with the transporter. If we are allowed to say that KNa(V = 0)≈K½(Na), then eqn (7) explains the correlation noted in Table 1 between the ratio α/β and K½(Na).
The GABA apparent affinity is determined by the charge equilibration rate
The correlation between unidirectional rate constants and GABA apparent affinity is predicted by the kinetic scheme of Fig. 9. From eqn (1) the GABA concentration producing half the maximal current at any given potential is given by:
| (8) |
where k1 is the rate constant of GABA binding to the transporter (see Fig. 9).
This last relationship gives a kinetic interpretation of the apparent affinity for GABA, linking the value of the concentration needed to elicit half the maximal current at any given membrane potential (K½(GABA)) to the equilibration rate of charge movement (r = α + β).
Put simply the interpretation offered by the scheme of Fig. 9 on this respect is as follows: to maintain saturation, a GABA molecule must interact with a transporter as soon as this reaches state T1; since the transport cycle can only proceed clockwise, state T1 will happen at a frequency β (that is, β will be the limiting step in the cycle). Any condition that will increase β, such as more negative potential, valproate or the mutations K448E and M345H, will require higher GABA concentrations in order to reach saturation, so as to ensure immediate interaction with the transporter. As a direct consequence of this fact, the GABA concentration for half current will also increase.
On this basis, we expected that any condition having an increasing or decreasing effect on the charge equilibration rate, detectable in the absence of GABA, should alter the GABA apparent affinity in the opposite way. All situations reported in this paper fulfil this prediction: in the presence of valproate, whose primary action is to boost up the charge equilibration rate, the apparent affinity for GABA is significantly lowered, with a K½(GABA) around 60 μm or more (Fig. 2); conversely, under the action of SKF89976A, which does not alter the charge equilibration rate, no changes in GABA apparent affinity can be observed (Fig. 6C). Finally, in the mutated forms, in which either an increase or decrease in rate may be observed, the GABA affinity is qualitatively modified in the expected directions (Figs 7E and 8E).
A decrease in external Na+ concentration is also expected to cause parallel changes in (α+β) and in K½(GABA). Indeed we have already shown this effect (Giovannardi et al. 2003), although an apparently different result has also been reported (Loo et al. 2000). Interestingly, results consistent with our kinetic interpretation of affinity have been reported for two H+-driven transporters, the plant hexose transporter STP1 (Boorer et al. 1994), and the oligopeptide transporter hPEPT1 (Mackenzie et al. 1996). In both cases the K½(substrate) is seen to depend on voltage and on proton concentration according to eqn (8). However, as we have previously pointed out (Fesce et al. 2002; Peres et al. 2004), caution must be exerted in extending these considerations to other transporters, as rGAT1 may represent a particularly propitious case in which a combination of favourable characteristics permits simplification of otherwise more complicated kinetic schemes.
Comparison of rates and K½(GABA) values in Figs 1 and 2 and in panels E of Figs 7 and 8 shows that although qualitatively confirmed, eqn (8) may not be completely satisfied in quantitative terms. Structural determinants and physico-chemical conditions in the proximity of the binding site will of course contribute to define the energetic requirements for successful interaction of substrates with the transporter, and consequently the substrate concentration needed for saturation and for half-saturation. It is conceivable that structural alteration induced in the mutated form, or the binding of valproate, besides altering the equilibration rates of charge movement, might also affect the GABA binding rate k1, explaining the observed quantitative discrepancies.
Acknowledgments
This work was supported by grants from the Italian Ministry of Research and University (PRIN and FIRB programs) to A. Peres, and by a grant from Fondazione CARIPLO to A. Peres. We are grateful to Professor Riccardo Fesce for stimulating discussions.
References
- Bennett ER, Su H, Kanner BI. Mutation of arginine 44 of GAT-1, a (Na++ Cl−)-coupled γ-aminobutyric acid transporter from rat brain, impairs net flux but not exchange. J Biol Chem. 2000;275:34106–34113. doi: 10.1074/jbc.M004229200. [DOI] [PubMed] [Google Scholar]
- Bismuth Y, Kavanaugh MP, Kanner BI. Tyrosine 140 of the γ-aminobutyric acid transporter GAT-1 plays a critical role in neurotransmitter recognition. J Biol Chem. 1997;272:16096–16102. doi: 10.1074/jbc.272.26.16096. [DOI] [PubMed] [Google Scholar]
- Boorer KJ, Loo DDF, Wright EM. Steady-state and presteady-state kinetics of the H+/hexose cotransporter (STPl) from Arabidopsis thaliana expressed in Xenopus oocytes. J Biol Chem. 1994;269:20417–20424. [PubMed] [Google Scholar]
- Borden LA. GABA transporter heterogeneity: pharmacology and cellular localization. Neurochem Int. 1996;29:335–356. doi: 10.1016/0197-0186(95)00158-1. [DOI] [PubMed] [Google Scholar]
- Bossi E, Giovannardi S, Binda F, Forlani G, Peres A. Role of anion–cation interactions on the presteady-state currents of Na+−Cl−-dependent cotransporters. J Physiol. 2002;541:343–350. doi: 10.1113/jphysiol.2001.013457. [DOI] [PMC free article] [PubMed] [Google Scholar]
- Chiu C-S, Jensen K, Sokolova I, Wang D, Li M, Deshpande P, Davidson N, Mody I, Quick MW, Quake SR, Lester HA. Number, density, and surface/cytoplasmic distribution of GABA transporters at presynaptic structures of knock-in mice carrying GABA transporter subtype 1-green fluorescent protein fusions. J Neurosci. 2002;22:10251–10266. doi: 10.1523/JNEUROSCI.22-23-10251.2002. [DOI] [PMC free article] [PubMed] [Google Scholar]
- Deken SL, Beckman ML, Boos L, Quick MW. Transport rates of GABA transporters: regulation by the N-terminal domain and syntaxin 1A. Nature Neurosci. 2000;3:998–1003. doi: 10.1038/79939. [DOI] [PubMed] [Google Scholar]
- Eckstein-Ludwig U, Fei J, Schwartz W. Inhibition of uptake, steady-state currents, and transient charge movements generated by the neuronal GABA transporter by various anticonvulsants drugs. Br J Pharmacol. 1999;128:92–102. doi: 10.1038/sj.bjp.0702794. [DOI] [PMC free article] [PubMed] [Google Scholar]
- Engel D, Schmitz D, Gloveli T, Frahm C, Heinemann U, Draguhn A. Laminar difference in GABA uptake and GAT-1 expression in rat CA1. J Physiol. 1998;512:643–649. doi: 10.1111/j.1469-7793.1998.643bd.x. [DOI] [PMC free article] [PubMed] [Google Scholar]
- Fesce R, Giovannardi S, Binda F, Bossi E, Peres A. The relation between charge movement and transport-associated currents in the GABA cotransporter rGAT1. J Physiol. 2002;545:739–750. doi: 10.1113/jphysiol.2002.026823. [DOI] [PMC free article] [PubMed] [Google Scholar]
- Forlani G, Bossi E, Ghirardelli R, Giovannardi S, Binda F, Bonadiman L, Ielmini L, Peres A. K448E mutation in the external loop 5 of rGAT1 transporter induces pH sensitivity and altered substrates interactions. J Physiol. 2001;536:479–494. doi: 10.1111/j.1469-7793.2001.0479c.xd. [DOI] [PMC free article] [PubMed] [Google Scholar]
- Giovannardi S, Fesce R, Bossi E, Binda F, Peres A. Cl− effects on the function of the GABA cotransporter rGAT1 preserve the mutual relation between transient and transport currents. CMLS. 2003;60:550–556. doi: 10.1007/s000180300046. [DOI] [PMC free article] [PubMed] [Google Scholar]
- Guastella J, Nelson N, Nelson H, Czyzyc L, Keynan S, Miedel MC, Davidson N, Lester HA, Kanner BI. Cloning and expression of a rat brain GABA transporter. Science. 1990;249:1303–1306. doi: 10.1126/science.1975955. [DOI] [PubMed] [Google Scholar]
- Hilgemann DW, Lu C-C. GAT1 (GABA: Na+: Cl−) cotransport function. Database reconstruction with alternating access model. J General Physiol. 1999;114:459–475. doi: 10.1085/jgp.114.3.459. [DOI] [PMC free article] [PubMed] [Google Scholar]
- Hille B. Ionic channels of excitable membranes. 3rd edn. Sunderland, MA, USA: Sinauer Associates; 2001. [Google Scholar]
- Liu Y, Eckstein-Ludwig U, Fei J, Schwarz W. Effect of mutation of glycosylation sites on the Na+ dependence of steady-state and transient currents generated by the neuronal GABA transporter. Biochim Biophys Acta. 1998;1415:246–254. doi: 10.1016/s0005-2736(98)00200-4. [DOI] [PubMed] [Google Scholar]
- Loo DDF, Eskandari S, Boorer KJ, Sarkar HK, Wright EM. Role of Cl− in electrogenic Na+-coupled cotransporters GAT1 and SGLT1. J Biol Chem. 2000;275:37414–37422. doi: 10.1074/jbc.M007241200. [DOI] [PubMed] [Google Scholar]
- Loo DDF, Hazama A, Supplisson S, Turk E, Wright EM. Relaxation kinetics of the Na+/glucose cotransporter. Proc Natl Acad Sci U S A. 1993;90:5767–5771. doi: 10.1073/pnas.90.12.5767. [DOI] [PMC free article] [PubMed] [Google Scholar]
- Lu C-C, Hilgemann DW. GAT1 (GABA: Na+: Cl−) cotransport function. Kinetic studies giant Xenopus oocyte membrane patches. J General Physiol. 1999a;114:445–457. doi: 10.1085/jgp.114.3.445. [DOI] [PMC free article] [PubMed] [Google Scholar]
- Lu C-C, Hilgemann DW. GAT1 (GABA: Na+: Cl−) cotransport function. Steady state studies in giant Xenopus oocyte membrane patches. J General Physiol. 1999b;114:429–444. doi: 10.1085/jgp.114.3.429. [DOI] [PMC free article] [PubMed] [Google Scholar]
- MacAulay N, Meinild A-K, Zeuthen T, Gether U. Residues in the extracellular loop 4 are critical for maintaining the conformational equilibrium of the γ-aminobutyric acid (GABA) transporter-1. J Biol Chem. 2003;278:28771–28777. doi: 10.1074/jbc.M213023200. [DOI] [PubMed] [Google Scholar]
- Mackenzie B, Loo DDF, Fei Y-J, Liu W, Ganapathy V, Leibach FH, Wright EM. Mechanisms of the human intestinal H+-coupled oligopeptide transporter hPEPT1. J Biol Chem. 1996;271:5430–5437. doi: 10.1074/jbc.271.10.5430. [DOI] [PubMed] [Google Scholar]
- Mager S, Kleinberger-Doron N, Keshet GI, Davidson N, Kanner BI, Lester HA. Ion binding and permeation at the GABA transporter GAT1. J Neurosci. 1996;16:5405–5414. doi: 10.1523/JNEUROSCI.16-17-05405.1996. [DOI] [PMC free article] [PubMed] [Google Scholar]
- Mager S, Naeve J, Quick M, Labarca C, Davidson N, Lester HA. Steady states, charge movements, and rates for a cloned GABA transporter expressed in Xenopus oocytes. Neuron. 1993;10:177–188. doi: 10.1016/0896-6273(93)90309-f. [DOI] [PubMed] [Google Scholar]
- Peres A, Giovannardi S, Bossi E, Fesce R. Electrophysiological insights on the mechanism of ion-coupled cotransporters. NIPS. 2004;19:80–84. doi: 10.1152/nips.01504.2003. [DOI] [PubMed] [Google Scholar]
- Su A, Mager S, Mayo SL, Lester HA. A multi-substrate single-file model for ion-coupled transporters. Biophys J. 1996;70:762–777. doi: 10.1016/S0006-3495(96)79616-9. [DOI] [PMC free article] [PubMed] [Google Scholar]
- Whitlow RD, Sacher A, Loo DDF, Nelson N, Eskandari S. The anticonvulsant valproate increases the turn over rate of γ-aminobutyric acid transporters. J Biol Chem. 2003;278:17716–17726. doi: 10.1074/jbc.M207582200. [DOI] [PubMed] [Google Scholar]


