Abstract
The perifornical-lateral hypothalamic area (PF-LHA) has been implicated in the regulation of behavioural arousal. The PF-LHA contains several cell types including neurones expressing the peptides, hypocretin (HCRT; also called orexin) and melanin-concentrating hormone (MCH). Evidence suggests that most of the PF-LHA neurones, including HCRT neurones, are active during waking and quiescent during non-rapid eye movement (non-NREM) sleep. The PF-LHA contains local GABAergic interneurones and also receives GABAergic inputs from sleep-promoting regions in the preoptic area of the hypothalamus. We hypothesized that increased GABA-mediated inhibition within PF-LHA contributes to the suppression of neuronal activity during non-REM sleep. EEG and EMG activity of rats were monitored for 2 h during microdialytic delivery of artificial cerebrospinal fluid (aCSF) or bicuculline, a GABAA receptor antagonist, into the PF-LHA in spontaneously sleeping rats during the lights-on period. At the end of aCSF or bicuculline perfusion, rats were killed and c-Fos immunoreactivity (Fos-IR) in HCRT, MCH and other PF-LHA neurones was quantified. In response to bicuculline perfusion into the PF-LHA, rats exhibited a dose-dependent decrease in non-REM and REM sleep time and an increase in time awake. The number of HCRT, MCH and non-HCRT/non-MCH neurones exhibiting Fos-IR adjacent to the microdialysis probe also increased dose-dependently in response to bicuculline. However, significantly fewer MCH neurones exhibited Fos-IR in response to bicuculline as compared to HCRT and other PF-LHA neurones. These results support the hypothesis that PF-LHA neurones, including HCRT neurones, are subject to increased endogenous GABAergic inhibition during sleep. In contrast, MCH neurones appear to be subject to weaker GABAergic control during sleep.
The perifornical-lateral hypothalamic area (PF-LHA) has been implicated in several physiological functions including the regulation of locomotor activity and behavioural arousal. Electrical stimulation of the PF-LHA evokes locomotor activity, EEG activation, increased blood pressure and increased heart rate (Stock et al. 1981; Krolicki et al. 1985; Sinnamon et al. 1999). A majority of neurones within PF-LHA are active during waking and exhibit little activity during non-rapid eye movement (non-REM) sleep (Alam et al. 2002; Koyama et al. 2003). The PF-LHA contains several cell types including those expressing hypocretin (HCRT/orexin), melanin-concentrating hormone (MCH), γ-aminobutyric acid (GABA) and glutamate (Bittencourt et al. 1992; Broberger et al. 1998; Peyron et al. 1998; Abrahamson & Moore, 2001; Elias et al. 2001). Both HCRT and MCH neurones are projection neurones and have been implicated in the regulation of food intake, energy homeostasis and sleep–wake regulation (Kilduff & Peyron, 2000; Beuckmann & Yanagisawa, 2002; Forray, 2003; Gerashchenko & Shiromani, 2004; Siegel, 2004).
HCRT neurones appear to be active during behavioural arousal and contribute to the promotion and maintenance of waking. For example, HCRT neurones exhibit wake-associated, particularly movement-associated, discharge activity and are quiescent during both non-REM and REM sleep (Lee & Jones, 2004). The intracerebroventricular (i.c.v.) infusion, or local microinjection of the peptide HCRT into its target sites, for example preoptic area (POA), basal forebrain, tuberomammillary nucleus and locus coeruleus, promotes waking and suppresses non-REM and REM sleep (Hagan et al. 1999; Bourgin et al. 2000; Methippara et al. 2000; Espana et al. 2001; Huang et al. 2001; Thakkar et al. 2001). The HCRT level in cerebrospinal fluid is higher during active waking (Kiyashchenko et al. 2002). Human narcoleptics have a dramatically reduced number of HCRT neurones and HCRT-1 is undetectable in cerebrospinal fluid of most human narcoleptics (Peyron et al. 2000; Thannickal et al. 2000; Nishino et al. 2001; Dalal et al. 2002). Many of the symptoms of narcolepsy, including excessive sleepiness, cataplexy and increased REM sleep propensity as well as behavioural state instability, are exhibited by HCRT knockout mice, rats with a targeted destruction of HCRT-receptor expressing neurones in PF-LHA or HCRT/ataxin-3 transgenic mice (Chemelli et al. 1999; Hara et al. 2001; Gerashchenko et al. 2001, 2003; Mochizuki et al. 2004).
Recent evidence suggests that MCH neurones also play a role in the regulation of sleep. MCH-1 receptor-deficient mice become hyperactive (Marsh et al. 2002); i.c.v administration of MCH induces a dose-dependent increase in both non-REM and REM sleep (Verret et al. 2003). MCH neurones exhibit increased c-Fos protein immunoreactivity or expression (Fos-IR), a marker of neuronal activation, in rats during sleep with higher REM sleep rebound subsequent to REM sleep deprivation (Verret et al. 2003).
The PF-LHA contains local GABAergic interneurones and receives GABAergic inputs from other areas including from sleep-promoting GABAergic neurones in the POA region (Abrahamson & Moore, 2001; Gong et al. 2002, 2004). GABAA receptors are present on various PF-LHA neurones including HCRT and MCH neurones and in vitro studies suggest that GABA inhibits those neurones (Li et al. 2002; Eggermann et al. 2003; Moragues et al. 2003; Backberg et al. 2004; van den Pol et al. 2004). Some evidence suggests that the GABAergic system within PF-LHA is involved in the regulation of sleep. GABA release in the posterior hypothalamus is higher during non-REM and REM sleep (Nitz & Siegel, 1996). Local microinjection of muscimol into posterior hypothalamus produces a dose-dependent sedation in cats (Lin et al. 1989) and rats (Nelson et al. 2002).
We hypothesized that increased GABAergic inhibition within PF-LHA contributes to the suppression of wake-promoting systems, including HCRT neurones, during non-REM sleep. We also hypothesized that GABAergic inhibitory tone during sleep is minimal on MCH neurones. We tested these hypotheses by examining effects of bicuculline, a GABAA receptor antagonist, delivered unilaterally into PF-LHA through a microdialysis probe. We examined the effects of bicuculline on Fos-IR in HCRT, MCH and other PF-LHA neurones in the diffusion field of the microdialysis probe and concurrently recorded sleep–wake changes in freely behaving rats during the lights-on period.
Methods
Experimental procedure
Experiments were performed on 24 Sprague-Dawley male rats, weighing between 250 and 350 g. These rats were maintained on 12–12 h light–dark cycle (lights on at 07.00 h) and with food and water ad libitum. All experiments were conducted in accordance with the National Research Council Guide for the Care and Use of Laboratory Animals and were approved by the Veteran Administration Institutional Animal Research Committee. Under surgical anaesthesia (ketamine/xylazine, 80/10 mg kg−1; i.p.) and aseptic conditions, rats were stereotaxically prepared for chronic recording of electroencephalogram (EEG) and electromyogram (EMG) signals and microdialytic delivery of artificial cerebrospinal fluid (aCSF) or bicuculline, a GABAA receptor antagonist, into PF-LHA. EEG and EMG electrodes were implanted using standard techniques. A microdialysis guide cannula (23G stainless steel tube) was implanted unilaterally such that its tip rested 3 mm above the dorsal aspect of the PF-LHA (A, −2.9 to −3.1; L, 1.4–1.6, H, 4.5–5.5; Paxinos & Watson, 1998) and was blocked with a stylet.
Experiments were started at least 10 days after surgery and after acclimation of the animals to the recording environment. At least 24 h before a recording session, the stylet of the microdialysis guide cannula was replaced by a microdialysis probe (semipermeable membrane tip length, 1 mm; outer diameter, 0.22 mm; molecular cut off size, 50 kDa; Eicom, Japan) fixed with dental acrylic and perfused with aCSF containing (mm): Na+ 145, K+ 2.7, Mg2+ 1.0 , Ca2+ 1.2 , Cl− 1.5 and Na2HPO4 2 (pH 7.2) at a flow rate of ∼2 μl min−1.
The experiments were conducted on freely behaving undisturbed animals during lights-on period (between ZT5 and ZT8) when rats spend significantly more time asleep and fewer PF-LHA neurones express Fos-IR (Estabrooke et al. 2001; Espana et al. 2003). The experiments were conducted in pairs; tissues from one experimental and one control animal were processed together for immunostaining using the same batches of reagents. In the control group, rats (n = 7) were allowed to sleep normally for 2 h while the PF-LHA was continuously perfused with aCSF. In the experimental group, rats were allowed to sleep normally, that is they were undisturbed for 2 h while the PF-LHA was perfused with different doses of bicuculline for different time intervals (2 μm for 60 min, n = 2; 20 μm for 60 min, n = 8; 20 μm for 120 min, n = 3). During experiments, EEG and neck muscle EMG were continuously monitored, digitized (Cambridge Electronic Design 1401, UK; supporting software, Spike 2) and stored on a disc for subsequent analyses. Additional experiments were conducted during the lights-off period (between ZT13 and ZT16) during waking to determine whether bicuculline-induced changes in Fos-IR were influenced by the circadian timing and behavioural states. In those rats, aCSF (n = 2) or bicuculline (20 μm for 60 min, n = 2) was perfused while the rats were kept awake. At the end of 2 h, rats were given a lethal dose of pentobarbital (100 mg kg−1) and perfused for immunohistochemical processing for c-Fos protein, HCRT-1 and MCH immunostaining.
Histology and immunohistochemistry
After anaesthetization, rats were injected with heparin (500 U, i.p.), and perfused transcardially with 30–50 ml of 0.1 m phosphate buffer (pH 7.2) followed by 300 ml of 4% paraformaldehyde in phosphate buffer containing 15% saturated picric acid solution, 100 ml of 10% sucrose, and finally 100 ml of 30% sucrose in phosphate buffer. The brains were removed and equilibrated in 30% sucrose. Horizontal sections were freeze-cut at 30 μm thickness. Alternate sections from the series of sections spanning the probe tract were immunostained to reveal c-Fos and HCRT, or c-Fos and MCH proteins.
c-Fos immunostaining
Sections through PF-LHA were first immunostained for c-Fos protein. Free-floating sections were incubated in 0.3% H2O2 in Tris-buffered saline (TBS) at room temperature for 30 min and then rinsed three times for 10 min each in TBS. Then sections were placed in blocking solution (4% goat serum and 0.2% Triton X-100 in TBS) for 2 h. Sections were incubated in rabbit anti-c-Fos (1 : 15 000 Oncogene, CA, USA) in diluent solution containing 4% goat serum and 0.2% Triton X-100 in TBS for 40–48 h at 4°C. After rinsing, sections were incubated in biotinylated goat anti-rabbit secondary antibody (1 : 1000 Vector Laboratories, CA, USA) in diluent solution for 2 h followed by rinsing with TBS. The sections were then incubated in avidin–biotin complex (1 : 500, Vector Laboratories) for 2 h and then developed with nickel-3,3′-diaminobenzidine tetrahydrochloride (DAB, Sigma, USA). Black staining confined to the nucleus indicated Fos-IR. After staining for Fos-IR, alternate sections were processed for HCRT-1 or MCH immunostaining.
HCRT immunostaining
Sections were first washed in TBS followed by incubation in blocking solution for 2 h, followed by a rinse. Sections were then incubated in the primary antibody, rabbit anti-orexin (1 : 1000, Oncogene) for 40–48 h, followed by rinsing in TBS. The sections were then incubated in biotinylated goat anti-rabbit secondary antibody (1 : 500 Vector Laboratories) in diluent solution for 2 h followed by rinsing with TBS. The sections were then incubated in avidin–biotin complex (1 : 250, Vector Laboratories) for 2 h followed by DAB visualization.
MCH immunostaining
Sections were first washed in TBS followed by incubation in blocking solution for 2 h, followed by a rinse. Sections were incubated in the primary antibody, rabbit anti-MCH (1 : 20,000, Phoenix Pharmaceuticals, CA, USA) for 40–48 h, followed by rinsing in TBS. The sections were then incubated in biotinylated goat anti-rabbit secondary antibody (1 : 1000 Vector Laboratories) in diluent solution for 2 h followed by rinsing with TBS. The sections were then incubated in avidin–biotin complex (1 : 500, Vector Laboratories) for 2 h followed by DAB visualization.
Two sections from each brain were treated as above except for the omission of the Fos, HCRT-1 or MCH primary antibody to control for non-specific staining. Finally sections were rinsed in Tris (3 × 10 min) followed by TBS. The sections were mounted on gelatin-coated slides, air-dried, dehydrated and cover-slipped.
Data analysis
Sleep–wake scoring
A single person who was unaware of the experimental conditions scored sleep–waking states in 20-s epochs as active waking, quiet waking, non-REM sleep and REM sleep, according to the method described earlier (Alam & Mallick, 1990). Each behavioural state was further analysed in terms of episode duration or bout lengths to determine the ability of the rats to maintain each state (Franken et al. 1999; Mochizuki et al. 2004). Bouts of each state were subclassified according to increasing bout lengths (20–60 s, 61–120 s and > 120 s) and their frequency were determined.
Cell counting and analyses
A single person blind to the treatment conditions performed the counting and plotting of the immunoreactive neurones using the Neurolucida computer-aided plotting system (MicroBrightField). All sections were carefully reviewed and four representative sections ∼120 μm apart and encompassing the maximum number of HCRT-positive (HCRT+) or MCH-positive (MCH+) neurones adjacent to the probe were considered for counting. The identification and counting of different neuronal types; single Fos-positive (Fos+), HCRT+ or MCH+ neurones and double-labelled HCRT+/Fos+ or MCH+/Fos+ neurones were performed manually. Fos-IR was recognized by black stain localized to the nucleus, whereas brown-stained soma and dendrites was indicative of HCRT+ or MCH+ neurones. Neurones having a black nucleus and a brown cytoplasm were identified as HCRT+/Fos+ or MCH+/Fos+ neurones in particular slides.
The effects of bicuculline on Fos-IR in PF-LHA neurones would depend upon its diffusion gradient from the probe. Therefore, a larger area of interest was chosen and a grid system was used for the quantification of Fos-IR. First, a 50-μm area around the perimeter of the microdialysis membrane tract was excluded from analyses because the damaged cells along the wall of the membrane may exhibit abnormal responses to the pharmacological agents. The area of interest (1000 μm each along rostral, caudal, lateral and medial sides) was then marked by four 250-μm wide concentric grids/rectangular boxes of progressively increasing size (grid-1, 0–250 μm; grid-2, 251–500 μm; grid-3, 501–750 μm; and grid-4, 751–1000 μm; Fig. 2). In those cases where the distance between the microdialysis membrane tract and the ventricle (medial side) was less than 1000 μm the number of neurones encountered on the remaining three sides was considered. A comparable area on the contralateral side was also counted, using the same grid system, to determine whether the effect was specific to the perfusion field. The number of HCRT+ or MCH+ neurones in the box adjacent to the probe varied depending upon the anatomical location of the probe. This variation was corrected by calculating the percentage of HCRT+/Fos + or MCH+/Fos+ neurones versus total number of HCRT+ or MCH+ neurones as a function of drug delivery in each animal.
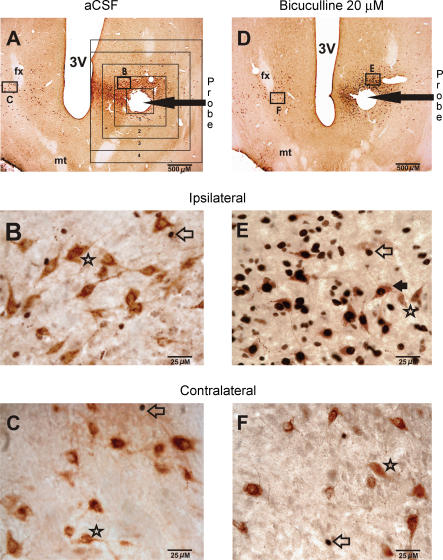
Figure 2. Effects of bicuculline on Fos-IR in PF-LHA neurones.
A, photomicrograph of a horizontal section (20 × magnification) from an animal that was perfused with aCSF and was awake for 17% of the recording time. The rectangular boxes around the probe tract show the grid system that was used for the quantification of Fos-IR neurones as a function of aCSF or bicuculline perfusion. The magnified images (400 x) of the marked sections on ipsilateral and contralateral sides are shown in B and C, respectively. In aCSF-treated animals, only a few Fos+ neurones were observed on both ipsilateral and contralateral sides and most of the HCRT+ neurones did not exhibit Fos-IR. D, example of a horizontal section (20 × magnification) showing the effects of bicuculline (20 μm for 60 min) on Fos-IR in PF-LHA neurones. This rat was awake for 58% of the recording time. The magnified images (400 x) of the marked sections on ipsilateral and contralateral sides are shown in E and F, respectively. In the presence of bicuculline, the number of both HCRT+ and non-HCRT neurones exhibiting Fos-IR increased dramatically. Filled arrow, HCRT+/Fos+ neurone; star, HCRT+/Fos– neurone; open arrow, single Fos+ neurone; fx, fornix; mt, mammillothalamic tract; 3V, third ventricle.
Statistical analyses
The numbers of single-labelled Fos+, HCRT+ or MCH+ and double-labelled HCRT+/Fos+ and MCH+/Fos+ neurones in grids adjacent to the probe after bicuculline perfusion were compared to those obtained after aCSF perfusion as well as in comparable regions on the contralateral side using independent and paired t tests, respectively. The amounts of waking, non-REM and REM sleep, and their bout lengths during bicuculline and aCSF perfusion were compared using independent t test.
Results
Effects of bicuculline on sleep–wakefulness
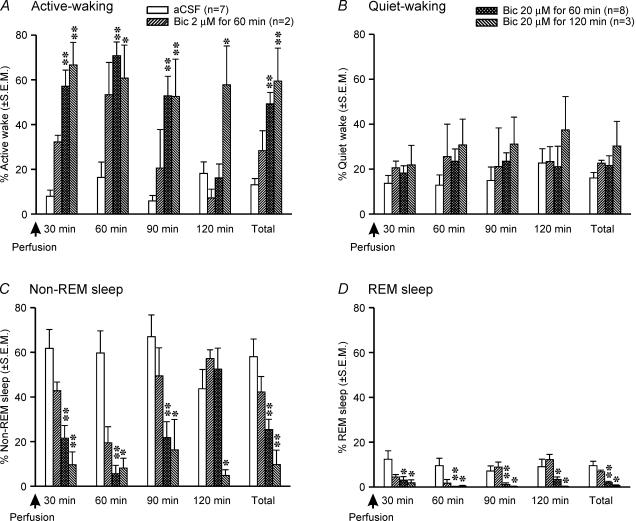
The sleep–wake profiles of rats microdialysed with bicuculline into PF-LHA were compared with those perfused with aCSF during the lights-on period to assess the contribution of endogenous GABAergic tone within PF-LHA to sleep–wake behaviour. Rats with aCSF perfusion into PF-LHA spent a significant portion of the recording time (mean ± s.e.m) in non-REM (58.0 ± 3.8%) and REM sleep (9.5 ± 1.1%) during the 2-h recording period before they were killed (Fig. 1). In contrast, microdialytic delivery of bicuculline into the PF-LHA during the same time period significantly decreased the amount of non-REM and REM sleep and increased total time the animals spent in waking (Fig. 1). In the presence of bicuculline (20 μm for 60 min), non-REM sleep was reduced by 57% and REM sleep was reduced by 80%. As compared to non-REM sleep, the effect on REM suppression also lasted longer (Fig. 1).
Figure 1. Effects of bicuculline on sleep–wake behaviour.
Effects of aCSF and different doses of bicuculline microdialysed into the PF-LHA during the lights-on period (ZT5–ZT8) on sleep–wake behaviour of rats during the 2-h recording period before they were killed. As compared to aCSF treatment, bicuculline induced a significant increase in active waking (A), and suppressed both non-REM (C) and REM sleep (D). **P < 0.01; *P < 0.05 level of significance (independent t test).
The effects of bicuculline on the induction of waking and suppression of non-REM and REM sleep were dose-dependent and occurred at a mean latency of 5 ± 2 min. Of three different bicuculline doses used, 20 μm perfused for 60 min produced optimal effects and was primarily used in this study (Fig. 1). The 2-h recording time was divided into four consecutive epochs of 30 min each to evaluate the onset and offset of the bicuculline effect. The epoch analyses revealed that the effects of bicuculline on behavioural changes were linked with the duration of its delivery. The effects were predominantly confined to the first three epochs (90 min) when bicuculline was perfused for 60 min whereas they lasted for the entire 2 h when it was perfused for 120 min (Fig. 1).
The bicuculline-induced waking resulted from a significant increase in active waking. The bout-length analyses of each of the behavioural states revealed that in the presence of bicuculline into the PF-LHA, rats exhibited a significant increase in the frequency of longer bouts of active waking (Table 1). In contrast, animals fell asleep significantly less frequently and exhibited significant decreases in non-REM and REM sleep bout lengths (Table 1).
Table 1.
Effects of bicuculline on sleep–wake architecture
| Episode frequency (first 90 min) | ||||
|---|---|---|---|---|
| Behavioural state | Treatment/Number of animals | Bout length (20–60 s) | Bout length (61–120 s) | Bout length (≥ 121 s) |
| Active wake | aCSF (n = 7) | 10.86 + 2.87 | 0.29 + 0.18 | 0.86 + 0.34 |
| Bic. 2 μm for 60 min (n = 2) | 7.00 + 1.00 | 4.50 + 1.50 | 3.50 + 0.50 | |
| Bic. 20 μm for 60 min (n = 8) | 9.88 + 1.87 | 3.25 + 0.67** | 8.00 + 0.56** | |
| Bic. 20 μm for 120 min (n = 3) | 22.00 + 9.17* | 6.00 + 2.08** | 4.67 + 1.67* | |
| Quiet wake | aCSF (n = 7) | 13.86 + 3.28 | 1.14 + 0.40 | 1.00 + 0.58 |
| Bic. 2 μm for 60 min (n = 2) | 17.00 + 7.00 | 3.00 + 0.00 | 3.00 + 1.00 | |
| Bic. 20 μm for 60 min (n = 8) | 14.50 + 2.41 | 2.38 + 0.63 | 2.00 + 0.83 | |
| Bic. 20 μm for 120 min (n = 3) | 18.00 + 4.04 | 4.00 + 3.06 | 1.00 + 0.58 | |
| Non-REM sleep | aCSF (n = 7) | 45.71 + 9.61 | 6.00 + 0.87 | 7.14 + 1.90 |
| Bic. 2 μm for 60 min (n = 2) | 40.00 + 16.00 | 5.50 + 3.50 | 3.50 + 1.50 | |
| Bic. 20 μm for 60 min (n = 8) | 24.38 + 11.27** | 2.00 + 0.94** | 1.00 + 0.50** | |
| Bic. 20 μm for 120 min (n = 3) | 13.00 + 7.57* | 2.00 + 1.53* | 0.33 + 0.33 | |
| REM sleep | aCSF (n = 7) | 15.29 + 1.89 | 0.71 + 0.57 | 0.43 + 0.30 |
| Bic. 2 μm for 60 min (n = 2) | 8.50 + 5.50 | 1.00 + 0.00 | 0.00 + 0.00 | |
| Bic. 20 μm for 60 min (n = 8) | 5.00 + 2.82** | 0.25 + 0.16** | 0.20 + 0.16 | |
| Bic. 20 μm for 120 min (n = 3) | 1.67 + 1.20** | 0.0 + 0.0* | 0.0 + 0.0 | |
P < 0.001;
P < 0.05 level of significance; independent t test.
Effects of bicuculline on PF-LHA neurones
In order to determine the neuronal types that are affected by endogenous GABAergic inhibition during sleep, the effects of different doses of bicuculline versus aCSF perfusion were quantified on Fos-IR in HCRT+, MCH+ and non-HCRT/non-MCH (single Fos+) neurones in rats killed after the above sleep–wake studies.
Effects of bicuculline on Fos-IR in HCRT+ neurones
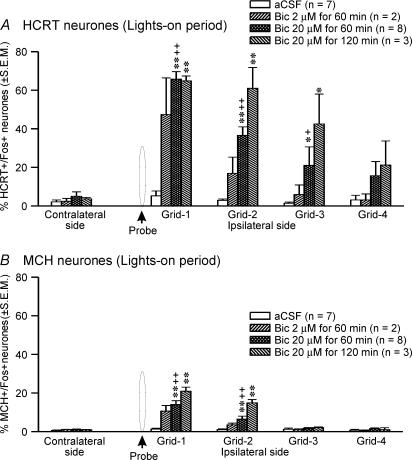
The effects of aCSF and different doses of bicuculline on Fos-IR in HCRT+ neurones during the lights-on period are shown in Figs 2, 3, 4. The number of HCRT+ neurones in aCSF and bicuculline treated rats around the microdialysis probe (370 ± 55 versus 255 ± 47) as well as in comparable regions on the contralateral sides (318 ± 63 versus 427 ± 62) were not significantly different. As reported in earlier studies (Estabrooke et al. 2001; Espana et al. 2003; Baldo et al. 2004), in aCSF-treated rats that were mostly asleep, few HCRT+ neurones expressed Fos-IR on both ipsilateral and contralateral sides, although the percentage of HCRT+/Fos+ neurones around the microdialysis probe was slightly higher (Fig. 4). However, in bicuculline-treated rats the number of HCRT+/Fos+ neurones around the microdialysis probe increased dramatically as compared to aCSF-treated rats. The number of HCRT+/Fos+ neurones in an equivalent region on the contralateral side of bicuculline-treated rats was not different from those found in aCSF-treated rats (Fig. 4).
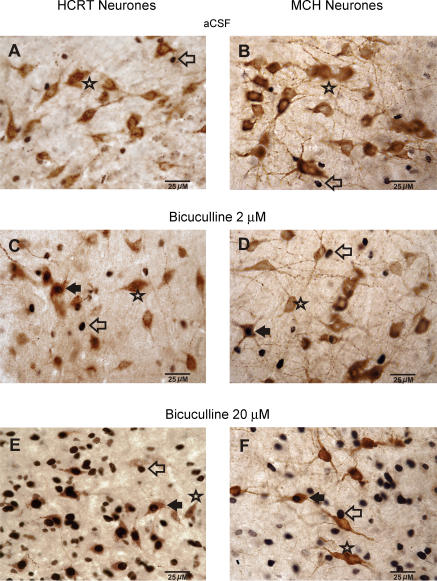
Figure 3. Bicuculline-induced dose-dependent changes in Fos-IR in PF-LHA neurones.
Photomicrographs (400 x) showing the effects of aCSF and two doses of bicuculline on Fos-IR in HCRT+, MCH+, and non-HCRT/non-MCH neurones ipsilateral to the microdialysis probe during the lights-on period. A dose-dependent increase in Fos expression (black dots) can be seen in HCRT+, MCH+ and non-HCRT/non-MCH neurones. Filled arrow, HCRT+/Fos+ neurone or MCH+/Fos+ neurone; Star, HCRT+/Fos– or MCH+/Fos– neurone; open arrow, single Fos+ neurone.
Figure 4. Effects of bicuculline on percentage of HCRT+ and MCH+ neurones exhibiting Fos-IR.
Mean percentage of HCRT+/Fos+ (A) and MCH+/Fos+ neurones (B) in different grids relative to the microdialysis probe after perfusion with aCSF or bicuculline during the lights-on period. The percentage of HCRT+/Fos+ or MCH+/Fos+ neurones on the contralateral side is the mean of neurones found in grids equivalent to the first three ipsilateral grids. In the presence of bicuculline, the number of HCRT+/Fos+ and MCH+/Fos+ neurones increased dose-dependently in a radius of 500–750 μm around the probe. *, as compared to the aCSF treatment (independent t test); +, as compared to the contralateral side (paired t test). ++,**P < 0.01; +,*P < 0.05 level of significance.
The increase in the number of HCRT+/Fos+ neurones in the presence of bicuculline was dose-dependent and, within a given dose, dependent upon the distance of the cell from the probe (Fig. 4). The number of HCRT+/Fos+ neurones was highest in the grid that was closest to the probe (grid-1) and gradually decreased with increasing distance from the probe. The effect of bicuculline was restricted to an approximately 750 μm radius.
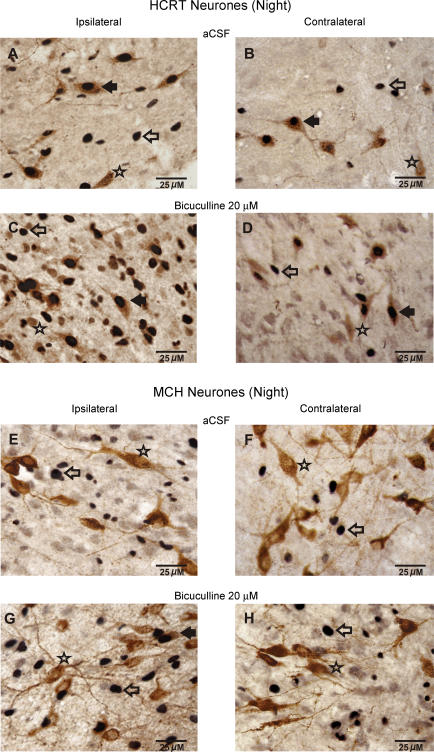
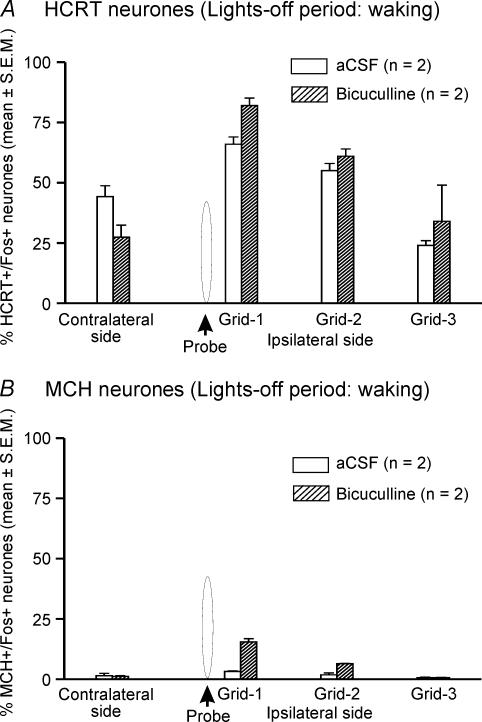
The effects of aCSF (n = 2) and bicuculline (n = 2) on Fos-IR in waking animals during the lights-off period were assessed to compare our observations with earlier studies. During the lights-off period when the rats were kept awake, a higher number of HCRT+ neurones expressed Fos-IR on both ipsilateral and contralateral sides during aCSF treatment (Figs 5 and 6). Though the number of subjects was not sufficient for statistical analysis, the bicuculline-treated rats showed a similar trend to that observed during the lights-on period, i.e. the number of HCRT+/Fos+ neurones in bicuculline-treated rats on the ipsilateral side was increased as compared to those found in aCSF-treated animals. However, the effect of bicuculline on Fos-IR during the lights-off period was marginal (HCRT+/Fos+ neurones during aCSF versus bicuculline treatment: 48.5 ± 4.8%versus 59.2 ± 0.4%, n = 2) as compared to that found during the lights-on period (aCSF versus bicuculline treatment: 5.9 ± 2.2%versus 41.1 ± 5.4%, n = 8; Fig. 7).
Figure 5. Effects of bicuculline on Fos-IR in PF-LHA neurones during the lights-off period.
Photomicrographs (400 x) showing Fos-IR in neurones found ipsilateral and contralateral to the microdialysis probe after aCSF or bicuculline (20 μm for 60 min) perfusion during the lights-off period. Filled arrow, HCRT+/Fos+ or MCH+/Fos+ neurone; star, HCRT+/Fos– or MCH+/Fos– neurone; open arrow, single Fos+ neurone.
Figure 6. Effects of bicuculline on percentage of HCRT+ and MCH+ neurones exhibiting Fos-IR.
Mean percentage of HCRT+/Fos+ (A) and MCH+/Fos+ neurones (B) after aCSF or bicuculline perfusion during waking in the lights-off period. Other details are the same as Fig. 4.
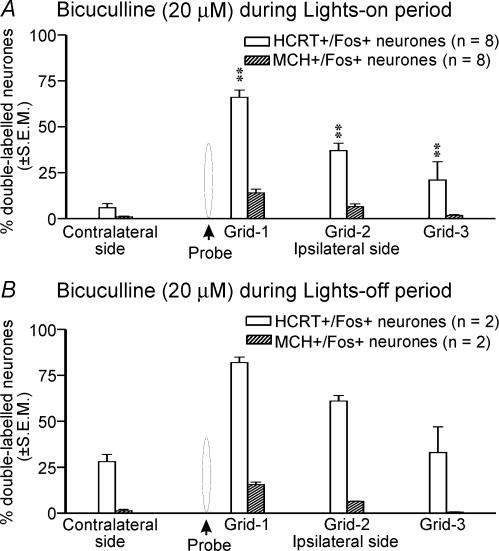
Figure 7. Effects of bicuculline on Fos-IR in HCRT+versus MCH+ neurones.
Effects of 20 μm bicuculline on mean percentage change in HCRT+/Fos+versus MCH+/Fos+ neurones during the lights-on period (A) and during waking in the lights-off (B) periods. The percentages of HCRT+/Fos+ or MCH+/Fos+ neurones on the contralateral side are the mean of neurones found in grids equivalent to the first three ipsilateral grids. **P < 0.01 level of significance (independent t test).
Effects of bicuculline on Fos-IR in MCH+ neurones
The effects of treatment with aCSF versus different doses of bicuculline on Fos-IR in MCH+ neurones during the lights-on period are shown in Figs 3 and 4. The numbers of MCH+ neurones in aCSF and bicuculline-treated rats within the standard grid around the microdialysis probe (268 ± 25 versus 243 ± 23) as well as on the contralateral sides (220 ± 14 versus 242 ± 21) were not significantly different. As reported in earlier studies (Verret et al. 2003), fewer MCH+ neurones on both the ipsilateral and the contralateral sides expressed Fos-IR during aCSF treatment. However, in bicuculline-treated rats, the number of MCH+/Fos+ neurones around the microdialysis probe increased significantly as compared to those found on the ipsilateral side in aCSF-treated rats or a comparable region on the contralateral side.
During the lights-off period when the rats were kept awake, unlike HCRT+ neurones, few MCH+/Fos+ neurones were found during aCSF treatment (n = 2). The bicuculline-treated rats showed a trend similar to that observed during the lights-on period, that is the number of MCH+/Fos+ neurones in bicuculline-treated rats on the ipsilateral side increased as compared to those found in aCSF-treated animals (Figs 6 and 7). In response to bicuculline, the percentage increase in HCRT+/Fos+ neurones was significantly higher than the percentage increase in MCH+/Fos+ neurones (Fig. 7).
Effects of bicuculline on Fos-IR in non-HCRT and non-MCH neurones
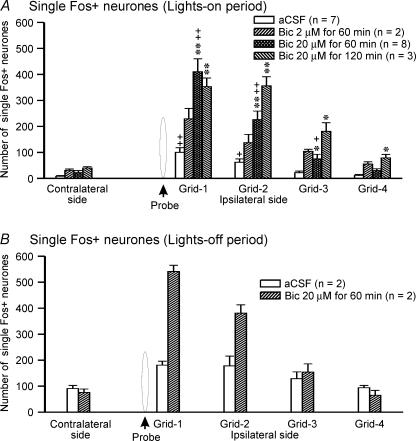
The effects of aCSF and different doses of bicuculline perfusion on Fos-IR in non-HCRT/non-MCH neurones are shown in Figs 2, 3 and 8. After aCSF perfusion during the lights-on period, a small number of single Fos+ neurones was found within the standard grid around the microdialysis probe and equivalent region on the contralateral side, although the number of Fos+ neurones ipsilateral to the probe was higher (Fig. 8). In the presence of bicuculline into PF-LHA, the number of Fos+ neurones around the microdialysis probe increased significantly as compared to those found on the ipsilateral side of aCSF-treated rats or a comparable region of the contralateral side. In the presence of bicuculline, the number of Fos+ neurones on the contralateral side also increased, although this effect was not significant.
Figure 8. Effect of bicuculline on Fos-IR in non-HCRT and non-MCH neurones.
Number of single Fos+ neurones on ipsilateral and contralateral sides of the microdilaysis probe after aCSF and bicuculline perfusion into the PF-LHA during the lights-on period (A) and in waking during the lights-off period (B). The number of Fos+ neurones on the contralateral side is the mean of neurones found in three grids equivalent to first three ipsilateral grids. *, as compared to the aCSF treatment (independent t test); +, as compared to the contralateral side (paired t test). ++,**P < 0.01; +,*P < 0.05 level of significance.
During the lights-off period, in agreement with earlier studies (Estabrooke et al. 2001; Espana et al. 2003), a large number of Fos+ neurones was found around the microdialysis probe or in an equivalent region on the contralateral side in aCSF-treated rats. In the presence of bicuculline, the number of Fos+ neurones within the standard grid around the microdialysis probe showed a trend to be higher as compared to those found in aCSF-treated animals (Fig. 8).
Correlation between bicuculline-induced Fos-IR and arousal
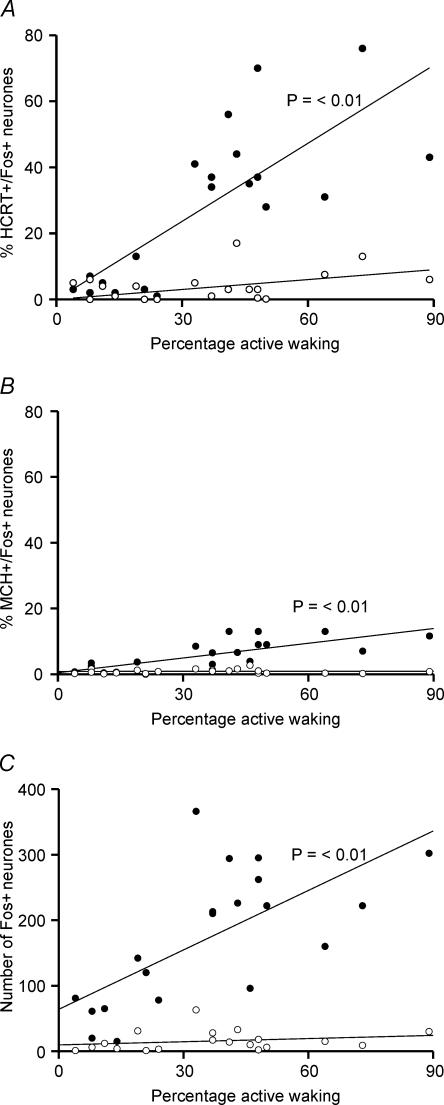
Figure 9 shows the correlation between aCSF and bicuculline-induced changes in Fos-IR in PF-LHA neurones and the amount of active waking during the 2-h recording period before the animals were killed. Bicuculline-induced increase in Fos-IR in HCRT+, MCH+ and other PF-LHA neurones on the ipsilateral side was positively correlated with the amount of active waking. However, changes in the number of HCRT+/Fos +, MCH+/Fos+ and single Fos+ neurones on the contralateral side were not correlated with active waking.
Figure 9. Regression functions and correlation between bicuculline-induced active waking and increase in Fos-IR.
Regression lines and scatter plots of the percentage of HCRT+/Fos+ (A), MCH+/Fos+ (B) and the number of single Fos+ neurones (C) in the ipsilateral side (•) and the contralateral side (○) versus percentage active wake time during the 2-h recording period before the rats were killed. The bicuculline-induced Fos-IR in a different neuronal population ipsilateral to the microdialysis probe was positively correlated with the amount of active waking. No significant correlation was found for neurones on the contralateral side. The active–wake and Fos-IR data were pooled from all rats used in this study for aCSF and bicuculline treatments.
Discussion
This study demonstrates that blockade of GABAA receptors within the PF-LHA by local microdialytic perfusion of bicuculline dose-dependently decreased non-REM and REM sleep and induced frequent and longer bouts of active waking in unrestrained spontaneously sleeping rats. In bicuculline-treated rats, the number of HCRT, MCH and non-HCRT/non-MCH neurones in the diffusion field of the microdialysis probe exhibiting Fos-IR also increased dose-dependently. The increase in Fos-IR neurones was positively correlated with the amount of active waking. However, as compared to HCRT and other PF-LHA neurones, a significantly smaller population of MCH neurones exhibited Fos-IR in response to bicuculline perfusion.
This is the first study, to our knowledge, that has quantified the effects of focal blockade of GABAergic transmission in PF-LHA on Fos-expression in identified HCRT, MCH and non-HCRT/non-MCH neurones in freely behaving animals. That the increase in Fos-IR in neurones adjacent to the microdialysis probe was induced by the blockade of GABAA receptors and not due to mechanical damage or to non-specific effects of fluid diffusion across the membrane is supported by the following evidence: (1) the bicuculline-induced increase in Fos-IR was significantly higher than that observed after aCSF perfusion; (2) the bicuculline-induced Fos-IR was dose-dependent; (3) bicuculline produced differential effects on HCRT and MCH neurones, the two overlapping neuronal population with differential influences on sleep–wake regulation (Estabrooke et al. 2001; Espana et al. 2003; Verret et al. 2003); (4) the increase in Fos-IR produced in response to bicuculline was positively correlated with the amount of waking; and (5) the magnitude of bicuculline-induced effects on HCRT neurones was different during lights-on and lights-off periods. The method of combined double-label immunohistochemistry adjacent to a microdialysis probe used for drug delivery provides obvious advantages compared to systemic, i.c.v. or microinjection delivery of drugs as well as administration by microdialysis without concomitant study of Fos-induction. However, this method cannot determine whether perfused drugs acted presynaptically on local interneurones, presynaptically on the terminals of distant afferents and/or directly on the receptors located on the dendrites or cell body of the identified neurones.
The PF-LHA neurones play a critical role in the regulation of behavioural arousal (see Introduction). A majority of PF-LHA neurones, including HCRT neurones, exhibit wake-associated discharge activity or Fos-IR (Estabrooke et al. 2001; Alam et al. 2002; Espana et al. 2003; Koyama et al. 2003; Torterolo et al. 2003; Lee & Jones, 2004). That PF-LHA neurones could be under GABAergic influences is supported by earlier studies. The GABAA receptors are present on various PF-LHA neurones including HCRT and MCH neurones (Moragues et al. 2003; Backberg et al. 2004). The GABAA receptor agonist, muscimol, hyperpolarizes HCRT and MCH neurones in in vitro preparations (Li et al. 2002; Eggermann et al. 2003; van den Pol et al. 2004). GABA levels in the posterior hypothalamus are higher during non-REM and REM sleep (Nitz & Siegel, 1996). Muscimol microinjection into posterior hypothalamus including PF-LHA promotes sleep (Lin et al. 1989). In this study bicuculline perfusion into PF-LHA dose-dependently increased waking and suppressed non-REM and REM sleep in freely behaving rats. These findings are in agreement with earlier studies and support a hypothesis that PF-LHA wake-promoting system is subject to increased endogenous GABAergic inhibition during sleep.
Rats exhibiting increased arousal and reduced sleep in response to bicuculline also showed increased number of Fos-IR neurones adjacent to the microdialysis probe. This suggests that the dis-inhibition of the neuronal population around the probe was sufficient to produce bicuculline-induced sleep–wake changes. It is unlikely that the increased number of Fos-IR neurones was indirectly caused by bicuculline-induced changes in waking as Fos-IR produced by waking should be equally expressed both ipsilateral and contralateral to the probe. In contrast, a relatively smaller population of neurones on the contralateral side exhibited Fos-IR. Therefore, it is plausible that bicuculline-induced sleep–wake changes were primarily mediated via the neuronal population around the microdialysis probe that exhibited Fos-IR in response to bicuculline.
Bicuculline-induced waking was accompanied by an insignificant increase in the number of HCRT+/Fos+ or single Fos-IR neurones on the contralateral side. This could be due to the fact that only sustained periods of waking accompanied by behavioural arousal or nocturnal spontaneous waking activates Fos-IR in HCRT and other PF-LHA neurones (Estabrooke et al. 2001; Espana et al. 2003). It is likely that bicuculline-induced arousal was neither sufficient in duration nor intense enough to evoke significant Fos-IR contralateral to the probe during the lights-on period. This interpretation is supported by our findings in rats that were kept awake during the lights-off period. In those rats a larger population of PF-LHA neurones, including HCRT neurones, were found to exhibit Fos-IR on the contralateral side. Our results are similar to the findings in a recent study where microdialytic perfusion of muscimol into the POA suppressed non-REM and REM sleep and increased Fos-IR in HCRT neurones located ipsilateral to the perfusion site while producing no effects on HCRT neurones located on the contralateral side (Satoh et al. 2004).
We found that a majority of neurones encountered in a 750 μm radius from the microdialysis probe that exhibited Fos-IR in response to bicuculline were of non-HCRT/non-MCH types. HCRT and MCH neurones constituted only 19 ± 2% and 8 ± 1%, respectively, of the responsive neurones. This suggests that the majority of PF-LHA neurones activated during waking contain neurotransmitters/neuromodulators other than HCRT or MCH. Evidence suggests that local glutamatergic neurones in PF-LHA regulate the excitability of HCRT and other PF-LHA neurones (Li et al. 2002; Baldo et al. 2004) and it is possible that some of the non-HCRT/non-MCH neurones that exhibited Fos-IR in response to bicuculline are wake-active glutamatergic neurones. Evidence suggests that GABA receptors are present on glia (Lin & Bergles, 2004). Although the role of glia in GABA-mediated neuronal signalling leading to sleep–wake changes is yet to be established, it is possible that some of the Fos-IR observed in the presence of bicuculline may be in the glial cells.
A significantly larger number of HCRT neurones, as compared to MCH neurones, exhibited Fos-IR in response to bicuculline (41 ± 5%versus 8 ± 1%) during the lights-on period, although during aCSF perfusion, when the animals were predominantly sleeping, fewer HCRT and MCH neurones exhibited Fos-IR. However, during the lights-off period when rats were kept awake, the number of HCRT neurones exhibiting Fos-IR increased substantially while the number of MCH neurones exhibiting Fos-IR remained very low. These findings are consistent with our hypothesis that HCRT neurones are under stronger GABAergic inhibition during sleep as compared to MCH neurones. MCH neurones exert potent inhibitory influences on the synaptic activity of the PF-LHA neurones and have been implicated in the facilitation of sleep (Gao & van den Pol, 2001; Verret et al. 2003). The minimal GABAergic influence on MCH neurones found in this study is consistent with the sleep-associated role of MCH neurones.
Recent evidence from our laboratory suggests that most of the sleep-active neurones within median preoptic nucleus (MnPN) of the POA region are GABAergic and MnPN constitutes a significant source of afferents to PF-LHA (Gong et al. 2002, 2004). Recently we found that MnPN electrical stimulation suppressed the discharge activity in the majority of PF-LHA neurones suggesting that at least a subset of PF-LHA neurones are under direct MnPN inhibitory control during sleep (Suntsova et al. 2003). Although the present study cannot determine whether bicuculline-induced increase in Fos-IR in PF-LHA neurones was due to the blockade of GABAergic inputs from MnPN sleep-active neurones or the local interneurones, it is reasonable to believe that both GABAergic sources may have been involved.
In conclusion, the present study suggests that focal blockade of GABAergic transmission in PF-LHA activates HCRT, MCH and other PF-LHA neurones leading to the suppression of non-REM and REM sleep and induction of arousal. Given the well-documented role of HCRT and other PF-LHA neurones in behavioural arousal and wakefulness, these results support the hypothesis that the wake-promoting PF-LHA system is subject to increased endogenous GABAergic inhibition during sleep. However, bicuculline caused minimal changes in the number of MCH neurones expressing Fos-IR suggesting that, as compared to other PF-LHA neurones, MCH neurones are under weaker GABAergic control during sleep.
Acknowledgments
This work was supported by grants from the National Institutes of Health, MH-61354 (M.N.A.), NS-050939 (M.N.A.), MH-47489 (D.M.), HL-60296 (D.M.), and MH-63323 (R.S.).
References
- Abrahamson EE, Moore RY. The posterior hypothalamic area: chemoarchitecture and afferent connections. Brain Res. 2001;889:1–22. doi: 10.1016/s0006-8993(00)03015-8. 10.1016/S0006-8993(00)03015-8. [DOI] [PubMed] [Google Scholar]
- Alam MN, Gong H, Alam T, Jaganath R, McGinty D, Szymusiak R. Sleep-waking discharge patterns of neurons recorded in the rat perifornical lateral hypothalamic area. J Physiol. 2002;538:619–631. doi: 10.1113/jphysiol.2001.012888. 10.1113/jphysiol.2001.012888. [DOI] [PMC free article] [PubMed] [Google Scholar]
- Alam MN, Mallick BN. Differential acute influence of medial and lateral preoptic areas on sleep-wakefulness in freely moving rats. Brain Res. 1990;525:242–248. doi: 10.1016/0006-8993(90)90870-h. 10.1016/0006-8993(90)90870-H. [DOI] [PubMed] [Google Scholar]
- Backberg M, Ultenius C, Fritschy JM, Meister B. Cellular localization of GABA receptor alpha subunit immunoreactivity in the rat hypothalamus: relationship with neurones containing orexigenic or anorexigenic peptides. J Neuroendocrinol. 2004;16:589–604. doi: 10.1111/j.1365-2826.2004.01207.x. [DOI] [PubMed] [Google Scholar]
- Baldo BA, Gual-Bonilla L, Sijapati K, Daniel RA, Landry CF, Kelley AE. Activation of a subpopulation of orexin/hypocretin-containing hypothalamic neurons by GABAA receptor-mediated inhibition of the nucleus accumbens shell, but not by exposure to a novel environment. Eur J Neurosci. 2004;19:376–386. doi: 10.1111/j.1460-9568.2004.03093.x. [DOI] [PubMed] [Google Scholar]
- Beuckmann CT, Yanagisawa M. Orexins: from neuropeptides to energy homeostasis and sleep/wake regulation. J Mol Med. 2002;80:329–342. doi: 10.1007/s00109-002-0322-x. [DOI] [PubMed] [Google Scholar]
- Bittencourt JC, Presse F, Arias C, Peto C, Vaughan J, Nahon JL, Vale W, Sawchenko PE. The melanin-concentrating hormone system of the rat brain: an immuno and hybridization histochemical characterization. J Comp Neurol. 1992;319:218–245. doi: 10.1002/cne.903190204. [DOI] [PubMed] [Google Scholar]
- Bourgin P, Huitron-Resendiz S, Spier AD, Fabre V, Morte B, Criado JR, Sutcliffe JG, Henriksen SJ, de Lecea L. Hypocretin-1 modulates rapid eye movement sleep through activation of locus coeruleus neurons. J Neurosci. 2000;20:7760–7765. doi: 10.1523/JNEUROSCI.20-20-07760.2000. [DOI] [PMC free article] [PubMed] [Google Scholar]
- Broberger C, De Lecea L, Sutcliffe JG, Hokfelt T. Hypocretin/Orexin and melanin-concentrating hormone-expressing cells form distinct populations in the rodent lateral hypothalamus: relationship to the neuropeptide Y and agouti gene-related protein systems. J Comp Neurol. 1998;402:460–474. [PubMed] [Google Scholar]
- Chemelli RM, Willie JT, Sinton CM, Elmquist JK, Scammell T, Lee C, et al. Narcolepsy in orexin knockout mice: molecular genetics of sleep regulation. Cell. 1999;98:437–451. doi: 10.1016/s0092-8674(00)81973-x. [DOI] [PubMed] [Google Scholar]
- Dalal MA, Schuld A, Pollmacher T. Undetectable CSF level of orexin A (hypocretin-1) in a HLA-DR2 negative patient with narcolepsy-cataplexy. J Sleep Res. 2002;11:273. doi: 10.1046/j.1365-2869.2002.00307.x. 10.1046/j.1365-2869.2002.00307.x. [DOI] [PubMed] [Google Scholar]
- Eggermann E, Bayer L, Serafin M, Saint-Mleux B, Bernheim L, Machard D, Jones BE, Muhlethaler M. The wake-promoting hypocretin-orexin neurons are in an intrinsic state of membrane depolarization. J Neurosci. 2003;23:1557–1562. doi: 10.1523/JNEUROSCI.23-05-01557.2003. [DOI] [PMC free article] [PubMed] [Google Scholar]
- Elias CF, Lee CE, Kelly JF, Ahima RS, Kuhar M, Saper CB, Elmquist JK. Characterization of CART neurons in the rat and human hypothalamus. J Comp Neurol. 2001;432:1–19. doi: 10.1002/cne.1085. 10.1002/cne.1085. [DOI] [PubMed] [Google Scholar]
- Espana RA, Baldo BA, Kelley AE, Berridge CW. Wake-promoting and sleep-suppressing actions of hypocretin (orexin): basal forebrain sites of action. Neuroscience. 2001;106:699–715. doi: 10.1016/s0306-4522(01)00319-0. 10.1016/S0306-4522(01)00319-0. [DOI] [PubMed] [Google Scholar]
- Espana RA, Valentino RJ, Berridge CW. Fos immunoreactivity in hypocretin-synthesizing and hypocretin-1 receptor-expressing neurons: effects of diurnal and nocturnal spontaneous waking, stress and hypocretin-1 administration. Neuroscience. 2003;121:201–217. doi: 10.1016/s0306-4522(03)00334-8. 10.1016/S0306-4522(03)00334-8. [DOI] [PubMed] [Google Scholar]
- Estabrooke IV, McCarthy MT, Ko E, Chou TC, Chemelli RM, Yanagisawa M, Saper CB, Scammell TE. Fos expression in orexin neurons varies with behavioral state. J Neurosci. 2001;21:1656–1662. doi: 10.1523/JNEUROSCI.21-05-01656.2001. [DOI] [PMC free article] [PubMed] [Google Scholar]
- Forray C. The MCH receptor family: feeding brain disorders? Curr Opin Pharmacol. 2003;3:85–89. doi: 10.1016/s1471-4892(02)00013-9. 10.1016/S1471-4892(02)00013-9. [DOI] [PubMed] [Google Scholar]
- Franken P, Malafosse A, Tafti M. Genetic determinants of sleep regulation in inbred mice. Sleep. 1999;22:155–169. [PubMed] [Google Scholar]
- Gao XB, van den Pol AN. Melanin concentrating hormone depresses synaptic activity of glutamate and GABA neurons from rat lateral hypothalamus. J Physiol. 2001;533:237–252. doi: 10.1111/j.1469-7793.2001.0237b.x. 10.1111/j.1469-7793.2001.0237b.x. [DOI] [PMC free article] [PubMed] [Google Scholar]
- Gerashchenko D, Blanco-Centurion C, Greco MA, Shiromani PJ. Effects of lateral hypothalamic lesion with the neurotoxin hypocretin-2-saporin on sleep in Long-Evans rats. Neuroscience. 2003;116:223–235. doi: 10.1016/s0306-4522(02)00575-4. 10.1016/S0306-4522(02)00575-4. [DOI] [PubMed] [Google Scholar]
- Gerashchenko D, Kohls MD, Greco M, Waleh NS, Salin-Pascual R, Kilduff TS, Lappi DA, Shiromani PJ. Hypocretin-2-saporin lesions of the lateral hypothalamus produce narcoleptic-like sleep behavior in the rat. J Neurosci. 2001;21:7273–7283. doi: 10.1523/JNEUROSCI.21-18-07273.2001. [DOI] [PMC free article] [PubMed] [Google Scholar]
- Gerashchenko D, Shiromani PJ. Different neuronal phenotypes in the lateral hypothalamus and their role in sleep and wakefulness. Mol Neurobiol. 2004;29:41–59. doi: 10.1385/MN:29:1:41. 10.1385/MN:29:1:41. [DOI] [PubMed] [Google Scholar]
- Gong H, McGinty D, Guzman-Marin R, Chew KT, Stewart D, Szymusiak R. Activation of c-fos in GABAergic neurones in the preoptic area during sleep and in response to sleep deprivation. J Physiol. 2004;556:935–946. doi: 10.1113/jphysiol.2003.056622. 10.1113/jphysiol.2003.056622. [DOI] [PMC free article] [PubMed] [Google Scholar]
- Gong H, McGinty D, Szymusiak R. Projections from the median preoptic nucleus to hypocretin and forebrain cholinergic arousal systems. Sleep. 2002;25:A7. [Google Scholar]
- Hagan JJ, Leslie RA, Patel S, Evans ML, Wattam TA, Holmes S, et al. Orexin A activates locus coeruleus cell firing and increases arousal in the rat. Proc Natl Acad Sci U S A. 1999;96:10911–10916. doi: 10.1073/pnas.96.19.10911. 10.1073/pnas.96.19.10911. [DOI] [PMC free article] [PubMed] [Google Scholar]
- Hara J, Beuckmann CT, Nambu T, Willie JT, Chemelli RM, Sinton CM, Sugiyama F, Yagami K, Goto K, Yanagisawa M, Sakurai T. Genetic ablation of orexin neurons in mice results in narcolepsy, hypophagia, and obesity. Neuron. 2001;30:345–354. doi: 10.1016/s0896-6273(01)00293-8. 10.1016/S0896-6273(01)00293-8. [DOI] [PubMed] [Google Scholar]
- Huang ZL, Qu WM, Li WD, Mochizuki T, Eguchi N, Watanabe T, Urade Y, Hayaishi O. Arousal effect of orexin A depends on activation of the histaminergic system. Proc Natl Acad Sci U S A. 2001;98:9965–9970. doi: 10.1073/pnas.181330998. 10.1073/pnas.181330998. [DOI] [PMC free article] [PubMed] [Google Scholar]
- Kilduff TS, Peyron C. The hypocretin/orexin ligand-receptor system: implications for sleep and sleep disorders. Trends Neurosci. 2000;23:359–365. doi: 10.1016/s0166-2236(00)01594-0. 10.1016/S0166-2236(00)01594-0. [DOI] [PubMed] [Google Scholar]
- Kiyashchenko LI, Mileykovskiy BY, Maidment N, Lam HA, Wu MF, John J, Peever J, Siegel JM. Release of hypocretin (orexin) during waking and sleep states. J Neurosci. 2002;22:5282–5286. doi: 10.1523/JNEUROSCI.22-13-05282.2002. [DOI] [PMC free article] [PubMed] [Google Scholar]
- Koyama Y, Takahashi K, Kodama T, Kayama Y. State-dependent activity of neurons in the perifornical hypothalamic area during sleep and waking. Neuroscience. 2003;119:1209–1219. doi: 10.1016/s0306-4522(03)00173-8. 10.1016/S0306-4522(03)00173-8. [DOI] [PubMed] [Google Scholar]
- Krolicki L, Chodobski A, Skolasinska K. The effect of stimulation of the reticulo-hypothalamic-hippocampal systems on the cerebral blood flow and neocortical and hippocampal electrical activity in cats. Exp Brain Res. 1985;60:551–558. doi: 10.1007/BF00236941. [DOI] [PubMed] [Google Scholar]
- Lee M, Jones BE. Discharge of identified orexin neurons across the sleep-waking cycle. Soc Neurosci Abstr. 2004:841.1. doi: 10.1523/JNEUROSCI.1887-05.2005. [DOI] [PMC free article] [PubMed] [Google Scholar]
- Li Y, Gao XB, Sakurai T, van den Pol AN. Hypocretin/orexin excites hypocretin neurons via a local glutamate neuron-A potential mechanism for orchestrating the hypothalamic arousal system. Neuron. 2002;36:1169–1181. doi: 10.1016/s0896-6273(02)01132-7. 10.1016/S0896-6273(02)01132-7. [DOI] [PubMed] [Google Scholar]
- Lin JS, Sakai K, Vanni-Mercier G, Jouvet M. A critical role of the posterior hypothalamus in the mechanisms of wakefulness determined by microinjection of muscimol in freely moving cats. Brain Res. 1989;479:225–240. doi: 10.1016/0006-8993(89)91623-5. 10.1016/0006-8993(89)91623-5. [DOI] [PubMed] [Google Scholar]
- Lin SC, Bergles DE. Synaptic signaling between neurons and glia. Glia. 2004;47:290–298. doi: 10.1002/glia.20060. 10.1002/glia.20060. [DOI] [PubMed] [Google Scholar]
- Marsh DJ, Weingarth DT, Novi DE, Chen HY, Trumbauer ME, Chen AS, et al. Melanin-concentrating hormone 1 receptor-deficient mice are lean, hyperactive, and hyperphagic and have altered metabolism. Proc Natl Acad Sci U S A. 2002;99:3240–3245. doi: 10.1073/pnas.052706899. 10.1073/pnas.052706899. [DOI] [PMC free article] [PubMed] [Google Scholar]
- Methippara MM, Alam MN, Szymusiak R, McGinty D. Effects of lateral preoptic area application of orexin-A on sleep-wakefulness. Neuroreport. 2000;11:3423–3426. doi: 10.1097/00001756-200011090-00004. [DOI] [PubMed] [Google Scholar]
- Mochizuki T, Crocker A, McCormack S, Yanagisawa M, Sakurai T, Scammell TE. Behavioral state instability in orexin knock-out mice. J Neurosci. 2004;24:6291–6300. doi: 10.1523/JNEUROSCI.0586-04.2004. 10.1523/JNEUROSCI.0586-04.2004. [DOI] [PMC free article] [PubMed] [Google Scholar]
- Moragues N, Ciofi P, Lafon P, Tramu G, Garret M. GABAA receptor epsilon subunit expression in identified peptidergic neurons of the rat hypothalamus. Brain Res. 2003;967:285–289. doi: 10.1016/s0006-8993(02)04270-1. 10.1016/S0006-8993(02)04270-1. [DOI] [PubMed] [Google Scholar]
- Nelson LE, Guo TZ, Lu J, Saper CB, Franks NP, Maze M. The sedative component of anesthesia is mediated by GABA(A) receptors in an endogenous sleep pathway. Nat Neurosci. 2002;5:979–984. doi: 10.1038/nn913. 10.1038/nn913. [DOI] [PubMed] [Google Scholar]
- Nishino S, Ripley B, Overeem S, Nevsimalova S, Lammers GJ, Vankova J, Okun M, Rogers W, Brooks S, Mignot E. Low cerebrospinal fluid hypocretin (Orexin) and altered energy homeostasis in human narcolepsy. Ann Neurol. 2001;50:381–388. doi: 10.1002/ana.1130. 10.1002/ana.1130. [DOI] [PubMed] [Google Scholar]
- Nitz D, Siegel JM. GABA release in posterior hypothalamus across sleep-wake cycle. Am J Physiol. 1996;271:R1707–R1712. doi: 10.1152/ajpregu.1996.271.6.R1707. [DOI] [PMC free article] [PubMed] [Google Scholar]
- Paxinos G, Watson C. The Rat Brain: in Stereotaxic Coordinates. 4. Academic Press, San Diego; 1998. [Google Scholar]
- Peyron C, Faraco J, Rogers W, Ripley B, Overeem S, Charnay Y, et al. A mutation in a case of early onset narcolepsy and a generalized absence of hypocretin peptides in human narcoleptic brains. Nat Med. 2000;6:991–997. doi: 10.1038/79690. 10.1038/79690. [DOI] [PubMed] [Google Scholar]
- Peyron C, Tighe DK, van den Pol AN, de Lecea L, Heller HC, Sutcliffe JG, Kilduff TS. Neurons containing hypocretin (orexin) project to multiple neuronal systems. J Neurosci. 1998;18:9996–10015. doi: 10.1523/JNEUROSCI.18-23-09996.1998. [DOI] [PMC free article] [PubMed] [Google Scholar]
- Satoh S, Matsumura H, Fujioka A, Nakajima T, Kanbayashi T, Nishino S, Shigeyoshi Y, Yoneda H. FOS expression in orexin neurons following muscimol perfusion of preoptic area. Neuroreport. 2004;15:1127–1131. doi: 10.1097/00001756-200405190-00009. 10.1097/00001756-200405190-00009. [DOI] [PubMed] [Google Scholar]
- Siegel JM. Hypocretin (orexin): role in normal behavior and neuropathology. Ann Rev Psychol. 2004;55:125–148. doi: 10.1146/annurev.psych.55.090902.141545. 10.1146/annurev.psych.55.090902.141545. [DOI] [PMC free article] [PubMed] [Google Scholar]
- Sinnamon HM, Karvosky ME, Ilch CP. Locomotion and head scanning initiated by hypothalamic stimulation are inversely related. Behav Brain Res. 1999;99:219–229. doi: 10.1016/s0166-4328(98)00106-5. 10.1016/S0166-4328(98)00106-5. [DOI] [PubMed] [Google Scholar]
- Stock G, Rupprecht U, Stumpf H, Schlor KH. Cardiovascular changes during arousal elicited by stimulation of amygdala, hypothalamus and locus coeruleus. J Auton Nerv Syst. 1981;3:503–510. doi: 10.1016/0165-1838(81)90083-7. 10.1016/0165-1838(81)90083-7. [DOI] [PubMed] [Google Scholar]
- Suntsova N, Guzman-Marin R, Alam MN, Szymusiak R, Shouse MN, McGinty D. EEG, behavioral and neuronal effects of median preoptic nucleus electrical stimulation. Sleep. 2003;26:A47. [Google Scholar]
- Thakkar MM, Ramesh V, Strecker RE, McCarley RW. Microdialysis perfusion of orexin-A in the basal forebrain increases wakefulness in freely behaving rats. Arch Ital Biol. 2001;139:313–328. [PubMed] [Google Scholar]
- Thannickal TC, Moore RY, Nienhuis R, Ramanathan L, Gulyani S, Aldrich M, Cornford M, Siegel JM. Reduced number of hypocretin neurons in human narcolepsy. Neuron. 2000;27:469–474. doi: 10.1016/s0896-6273(00)00058-1. 10.1016/S0896-6273(00)00058-1. [DOI] [PMC free article] [PubMed] [Google Scholar]
- Torterolo P, Yamuy J, Sampogna S, Morales FR, Chase MH. Hypocretinergic neurons are primarily involved in activation of the somatomotor system. Sleep. 2003;26:25–28. [PubMed] [Google Scholar]
- van den Pol AN, Acuna-Goycolea C, Clark KR, Ghosh PK. Physiological properties of hypothalamic MCH neurons identified with selective expression of reporter gene after recombinant virus infection. Neuron. 2004;42:635–652. doi: 10.1016/s0896-6273(04)00251-x. 10.1016/S0896-6273(04)00251-X. [DOI] [PubMed] [Google Scholar]
- Verret L, Goutagny R, Fort P, Cagnon L, Salvert D, Leger L, Boissard R, Salin P, Peyron C, Luppi PH. A role of melanin-concentrating hormone producing neurons in the central regulation of paradoxical sleep. BMC Neurosci. 2003;4:19. doi: 10.1186/1471-2202-4-19. 10.1186/1471-2202-4-19. [DOI] [PMC free article] [PubMed] [Google Scholar]


