

Abstract
The strong inward rectification of the whole cell Kir2.1 current, which is very similar to the cardiac inward rectifier K+ current (IK1), is caused by voltage-dependent blockade of outward currents by the intracellular polyamines spermine and spermidine. We recently showed that macroscopic Kir2.1 currents obtained from inside-out patches in the presence of various concentrations of cytoplasmic polyamines are well explained by the sum of the currents through two populations of channels that show differing susceptibilities to polyamine blockade. The outward currents obtained with 5–10 μm cytoplasmic spermine showed current–voltage relationships similar to those of IK1 and were considered to flow mostly through a small population of channels exhibiting lower spermine sensitivity. Here we used inside-out patches to examine the blockade of macroscopic Kir2.1 currents by cytoplasmic Mg2+ in the absence and presence of cytoplasmic spermine. Outward currents were blocked by 0.6 and 1.1 mm Mg2+ in a concentration-dependent manner, but a small fraction (∼0.1) of the macroscopic conductance was resistant to Mg2+ at those concentrations, suggesting there are two populations of Kir2.1 channels with different sensitivities to Mg2+. Furthermore, at those concentrations, Mg2+ blocked inward currents by inducing a shallow blocked state that differed from the deeper state causing the inward rectification. In the presence of 1.1 mm Mg2++ 5 μm spermine, Mg2+ blocked a substantial current component during depolarizing pulses and generated transient outward components, which is consistent with findings from earlier whole-cell experiments. In the steady state, Mg2+ blocked the currents at voltages around and negative to the reversal potential and induced sustained outward components. The steady-state and time-dependent current amplitudes and the fractional blockades caused by spermine and Mg2+ could be quantitatively explained by a model in which Mg2+ competes with spermine to block the high-affinity channel and induces three conductance states. The present results suggest that the outward IK1 flows through two populations of channels with different sensitivities to cytoplasmic blockers.
The strong inward rectifier K+ channels allow much larger inward currents to flow than outward currents. Under physiological conditions in which the external K+ concentrations are as low as ∼4–5 mm, however, the outward currents flowing through these channels play an important role in regulating the membrane potential of excitable cells, such as cardiac myocytes, skeletal muscle and neuronal cells.
The strong inward rectification of the channels composed of subunits from the Kir2 subfamily is mainly caused by voltage-dependent blockade of the outward currents by the intracellular polyamines spermine (SPM) and spermidine (SPD) (Nichols & Lopatin, 1997). Detailed studies of Kir2 channels have shown that the mechanism of the polyamine blockade is complicated, involving more than two blocked sites or states (Lopatin et al. 1995; Yang et al. 1995; Guo & Lu, 2000; Xie et al. 2002). Consequently, a simple model that can describe both the voltage dependence and polyamine concentration dependence of outward current amplitudes had not yet been proposed. Recently, we showed that the voltage dependences of the macroscopic Kir2.1 channel conductance obtained with various concentrations of cytoplasmic SPM and SPD are well described by the sum of the currents through two populations of channels with different susceptibilities to polyamine blockade (Ishihara & Ehara, 2004). Although the molecular mechanism underlying the difference between these two populations of Kir2.1 channels remains unclear, this finding does explain well the steady-state outward current amplitude of the cardiac strong inward rectifier K+ current, IK1, which plays a significant role in repolarizing the cardiac action potential (Shimoni et al. 1992).
The characteristics of the whole-cell currents indicate that cardiac IK1 and Kir2.1 channels make use of similar time-dependent gating mechanisms (Ishihara et al. 1989; Stanfield et al. 1994a) that involve channel blockade by intracellular SPM and its relief (Ishihara et al. 1996). It has been noted that outward IK1 and Kir2.1 currents cannot be explained by time-dependent gating, as that gating is maximally ‘closed’ at voltages where outward currents flow (Ishihara et al. 1989; Oliva et al. 1990). In addition, there is a minor instantaneous component of unknown origin that may account for the outward currents (Ishihara et al. 1996). Our study of the Kir2.1 channel strongly suggests that time-dependent gating reflects SPM blockade of high-affinity channels and that the majority of the outward IK1 flows through a small population of channels having low polyamine affinity (Ishihara & Ehara, 2004).
On the other hand, it has been shown that channel blockade by intracellular Mg2+ at physiological concentrations (0.5–1.2 mm; Murphy et al. 1991) interferes significantly with the time-dependent gating of both IK1 and Kir2.1 currents under whole-cell conditions, thereby generating the time dependence of the outward currents (Ishihara et al. 1989, 1996; Stanfield et al. 1994a; Ishihara & Ehara, 1998). This suggests that polyamines and Mg2+ act in concert to cause the strong inward rectification of Kir2.1 currents and IK1. This view raises questions as to whether there can be two populations of Kir2.1 channels with differing sensitivities to Mg2+ and whether the effects of intracellular Mg2+ on IK1 and Kir2.1 currents observed under the whole-cell conditions can be explained by two populations of channels with different sensitivities to both polyamines and Mg2+.
To address these questions, we expressed the Kir2.1 channel in human embryonic kidney (HEK) 293T cells and studied the macroscopic currents recorded from inside-out patches. We show that the inward rectification of the currents caused by 0.6 or 1.1 mm Mg2+ is mild because ∼0.1 of the macroscopic conductance is virtually insensitive to Mg2+ at those concentrations within the voltage range examined. In addition, when 0.6 or 1.1 mm Mg2+ is present together with 5 μm SPM, Mg2+ contributes significantly to blocking the Kir2.1 channels showing higher polyamine sensitivity, and the outward currents exhibit a time dependence and steady-state current–voltage (I–V) relationship similar to those of IK1 seen under whole-cell conditions in the presence of intracellular Mg2+. Finally, we show that a model incorporating two channel populations with different sensitivities to cytoplasmic SPM and Mg2+ reconstitutes well the observed currents and fractional blockades caused by SPM and Mg2+. Our results suggest that the steady-state I–V relationship of the cardiac IK1 is not greatly affected by internal Mg2+ because a small fraction of the channels, which exhibit a lower sensitivity to polyamines and primarily generate the outward currents, is also virtually insensitive to Mg2+.
Methods
Expression of Kir2.1 gene in HEK 293T cells
Mouse Kir2.1 cDNA (Kubo et al. 1993; kindly provided by Dr L. Y. Jan at University of California, San Francisco, USA), which we previously subcloned into the mammalian expression vector pCXN2 (Niwa et al. 1991; Ishihara et al. 1996), was transfected into HEK 293T cells (derived from HEK 293 cell line and containing the SV 40 large T antigen) together with pEGFP-N1 (Clontech) as described in detail elsewhere (Ishihara & Ehara, 2004). The cells expressing exogenous genes were identified by visualizing the EGFP fluorescence using the inverted fluorescence microscope.
Solutions
The pipette (extracellular) solution contained (mm): 145 KCl, 1 CaCl2 and 5 Hepes (pH 7.4 with ∼2 mm KOH). The bath solution used as the control Mg2+-free, polyamine-free cytoplasmic solution contained (mm): 125 KCl, 4 K2EDTA, 7.2 K2HPO4 and 2.8 KH2PO4 (pH 7.2 with ∼3 mm KOH). The free Mg2+ and Ca2+ concentrations in this solution were calculated to be at submicromolar levels (Fabiato & Fabiato, 1979), assuming that the amounts of Ca2+ and Mg2+ contained in the solution were ∼10 μm each. To prepare cytoplasmic solutions containing Mg2+, a 1 m MgCl2 stock solution (Kishida Chemical, Osaka, Japan) was diluted to the desired concentrations (see below) with the control cytoplasmic solution, after which the pH of the solution was re-adjusted. Cytoplasmic solutions containing 5 μm SPM were made from a 10 mm SPM stock solution, which was prepared by dissolving spermine-4HCl (Nacalai Tesque, Kyoto, Japan) in distilled water, and was stored in small aliquots at −20°C.
Determination of the free Mg2+ concentration in the cytoplasmic solutions
To simplify our experiments, we prepared cytoplasmic solutions containing Mg2+ by adding it to the control Mg2+-free, polyamine-free solution containing EDTA and phosphates. The concentrations of added MgCl2 required to obtain the desired free Mg2+ concentrations were determined by measuring the mag-indo-1 (tetrapotassium salt; Molecular Probes, Eugene, OR, USA) fluorescence using a spectrofluorophotometer (RF-5000, Shimadzu, Kyoto, Japan). The calibration curve shown in Fig. 1 was constructed using calibrating solutions containing 1 μm mag-indo-1. Calibrating solutions containing various concentrations of Mg2+ were prepared by mixing different ratios of the two stock solutions, one containing (mm) 150 KCl, 0.1 EGTA and 5 Hepes (pH 7.2 with KOH), and the other containing 100 MgCl2, 0.1 EGTA and 5 Hepes (pH 7.2 with KOH) (Csernoch et al. 1998). The ‘0 Mg2+’ calibrating solution contained (mm): 130 KCl, 4 EDTA and 5 Hepes (pH 7.2 with KOH). The relationship between the background-corrected value of the fluorescence ratio (R) and the Mg2+ concentration was fitted with the following theoretical equation (Grynkiewicz et al. 1985):
| (1) |
where [Mg] is the concentration of free Mg2+ ion, Rmin is the R value at 0 [Mg2+], and Rmax is the R value at saturating Mg2+. The curve fitting gave Rmin= 0.053, Rmax= 1.57, and K= 5.1 mm.
Figure 1. Calibration of mag-indo-1 fluorescence.

Ratios of the mag-indo-1 fluorescence excited at 395 nm and 465 nm (F395/F465) are plotted against [Mg]. Data are the means of three independent measurements. Error bars were not shown because they were smaller than the symbols. The superimposed curve was obtained by fitting the data with eqn (1) in Methods.
The R values of the cytoplasmic solutions containing 5 mm and 6 mm Mg2+ (pH re-adjusted to 7.2) were 0.21 ± 0.01 (n = 3) and 0.32 ± 0.02 (n = 3), respectively, which corresponded to the free Mg2+ concentrations of about 0.6 and 1.1 mm, respectively. The osmolality of the solutions used to obtain the mag-indo-1 fluorescence was between 261 and 272 mosmol (kg H2O)−1, determined with a freezing-point depression osmometer (OM801, Vogel, Germany).
Current recordings from HEK 293T cells expressing Kir2.1 channel
The method used for recording the currents under the voltage-clamp condition from HEK 293T cells expressing Kir2.1 channels was described in detail previously (Ishihara & Ehara, 2004). Briefly, on the day of transfection, the cells were seeded onto small pieces of collagen-coated coverglass (Asahi Techno Glass Corporation, Tokyo Japan). Within 24–56 h after transfection, a piece of coverglass was placed in a recording chamber mounted on the stage of an inverted fluorescence microscope (TMD300, Nikon, Tokyo, Japan), and currents were recorded from excised inside-out patches using the patch-clamp technique (Hamill et al. 1981) with a patch-clamp amplifier (Axopatch 200B, Axon Instruments; or EPC-8, HEKA). Patch electrodes made from borosilicate glass capillaries (1.65 mm o.d., 0.165 mm wall thickness; Hilgenberg GmbH, Malsfeld, Germany) were coated near their tips with silicone (Shin-Etsu Chemical, Tokyo, Japan) and then heat-polished. The resistance of the electrodes was 1.8–2.5 MΩ when filled with the pipette solution. Currents were filtered at 5–10 kHz and recorded onto a PC hard disc along with membrane potentials through an AD converter (Digidata, Axon Instruments) sampling at 25–50 kHz using pCLAMP8 software (Axon Instruments). Capacitive currents were compensated for as much as possible with the voltage-clamp amplifier. The effects of Mg2+ and SPM were examined after the native inward rectification had been removed to as great an extent as possible in the control Mg2+-free, polyamine-free cytoplasmic solution. All experiments were conducted at room temperature (24–26°C).
Data analysis and statistics
Current amplitudes shown in the I–V relationships were measured ∼200 ms after the onset of each test pulse. To evaluate Kir2.1 channel blockade by Mg2+ and SPM, we used the chord conductance (G) values calculated from the I–V relationships using the equation G = I/(V−Vrev), where Vrev is the reversal potential of the currents. Vrev values were always near 0 mV (0–2 mV), which is in agreement with the K+ equilibrium potential of ∼1 mV predicted from the experimental conditions. The conductance values were normalized with respect to the maximum value in the hyperpolarized membrane (Gmax), which was obtained using large negative pulses in the absence of Mg2+ and SPM, or in the presence of low concentrations (≤ 5 μm) of SPM that little affected the inward currents in the hyperpolarized membrane (Ishihara & Ehara, 2004). That the single Kir2.1 channel currents exhibited an ohmic unitary current–voltage relationship in the presence of symmetrical [K+] (data not shown) suggests the relative conductance (G/Gmax) values may reflect the unblocked fraction of the currents. Least-squares fits were carried out using the algorithms incorporated in pCLAMP and Origin (ver. 6, OriginLab Corp., Northampton, MA, USA) software. The statistical values were given as the means ± s.e.m.
Simulation of time-dependent currents
First-order differential equations describing the kinetic model were solved using the Euler iteration technique. Computation was carried out using Microsoft Visual BASIC (ver. 6).
Results
Inward rectification of Kir2.1 currents caused by cytoplasmic Mg2+
The currents shown in Fig. 2A were all obtained from the same patch membrane excised from a HEK 293T cell expressing the Kir2.1 channel. Test pulses to various voltages were applied following a hyperpolarizing prepulse to −40 mV. When the cytoplasmic solution was switched from control polyamine-free, Mg2+-free solution to one containing 0.6 or 1.1 mm Mg2+, which are physiological levels of cytoplasmic free Mg2+, the amplitudes of the outward currents decreased significantly, and those of the inward currents were also reduced to some extent. Both effects were immediately observed upon the application of Mg2+ and were reversed by its removal (Fig. 2A, upper panel). The I–V relationships of the currents obtained with Mg2+ (Fig. 2B) did not show the negative slope conductance in the outward current region that is characteristic of the cardiac IK1. The inward rectification was mild, and outward currents of significant amplitude flowed even at +80 mV more positive than Vrev. These currents were largely suppressed by adding 5 μm SPM after removing Mg2+, however (Fig. 2Af and B).
Figure 2. Inward rectification of macroscopic Kir2.1 currents caused by cytoplasmic Mg2+.

A, currents recorded from an inside-out patch in the absence and presence of Mg2+. The upper panel shows the time course of changes in current amplitude at +40 mV (•) and −40 mV (○) observed on application and removal of 0.6 mm Mg2+, 1.1 mm Mg2+ or 5 μm SPM. Superimposed in a–f are currents recorded using test pulses from −80 to +80 mV in 20 mV steps at the times indicated in the upper panel. Control currents (a, c and e) were obtained in polyamine-free, Mg2+-free cytoplasmic solution. Currents shown in b, d and f were obtained in the presence of 0.6 mm Mg2+, 1.1 mm Mg2+, and 5 μm SPM, respectively. B, I–V relationships in the presence of 0.6 (▴) or 1.1 (□) mm Mg2+. The dotted line is the I–V relationship obtained with 5 μm SPM. C, G–V relationships of Kir2.1 currents obtained with 0.6 (▴) or 1.1 (□) mm Mg2+. Shown are the mean values obtained from 6 experiments. Error bars were not shown because they were smaller than the symbols. The G–V relationship in the presence of 5 μm SPM (dotted line) was reconstructed using the theoretical equation (Ishihara & Ehara, 2004). G/Gmax= 0.5 is shown by a dotted line to indicate the half-blocking voltages.
Figure 2C shows the average G–V relationships obtained with 0.6 and 1.1 mm Mg2+. The G/Gmax value became progressively smaller with larger depolarizations, and the relationship was shifted leftward by increasing the Mg2+ concentration, which is consistent with a voltage-dependent blockade of the currents by Mg2+; the half-blocking voltages were 0 mV and −16 mV with 0.6 and 1.1 mm Mg2+, respectively. On the other hand, the G/Gmax values in the positive voltage range approached the limit of ∼0.1 at both Mg2+ concentrations, indicating that a fraction of the macroscopic conductance was resistant to Mg2+ blockade. For comparison, the G–V relationship obtained with 5 μm SPM is superimposed in Fig. 2C. In the presence of Mg2+, the conductances of the hyperpolarized membrane were reduced in a concentration-dependent manner; the G/Gmax values at −100 mV were 0.90 ± 0.009 (n = 6) and 0.84 ± 0.013 (n = 5) with 0.6 and 1.1 mm Mg2+, respectively.
Macroscopic Kir2.1 currents recorded from inside-out patches in the presence of cytoplasmic Mg2+ and SPM
We recently showed that the I–V relationship for the macroscopic outward currents through the Kir2.1 channel obtained with 5 μm cytoplasmic SPM is similar to that for the whole-cell IK1. The results shown in Fig. 2 indicate that the inward rectification of the Kir2.1 currents caused by 0.6 or 1.1 mm cytoplasmic Mg2+ alone is significantly weaker than that caused by 5 μm SPM. Figure 3 shows the effects of 1.1 mm Mg2+ on outward currents obtained in the presence of 5 μm SPM. When test pulses were applied after a hyperpolarizing prepulse, time-dependent components, which were absent in the presence of SPM alone (Fig. 3Aa), appeared in the outward currents during the test pulses (Fig. 3Ab). These time-dependent components were not evoked when the test pulses were applied from a holding potential (HP) of +40 mV (superimposed currents in Fig. 3Ab), and their amplitude became smaller and the time course of their decay phase became significantly slower as the test potential (VTest) was made more positive (Fig. 3Ab and B). Notably, these findings are the same as those obtained with whole-cell Kir2.1 currents and IK1 in the presence of 0.5–1 mm intracellular free Mg2+ (Ishihara et al. 1996; Ishihara, 1997; K. Ishihara unpublished observation for IK1). Repolarizing test pulses following a large depolarizing pulse applied after a hyperpolarizing prepulse induced transient outward currents (Fig. 4A), as was previously shown with whole-cell Kir2.1 currents and IK1 (Ishihara, 1997; Ishihara & Ehara, 1998). The amplitudes of both the depolarization- and repolarization-induced time-dependent outward components showed a strong inward rectification (Figs 3B and 4B), which is again consistent with earlier whole-cell experiments.
Figure 3. Effects of cytoplasmic Mg2+ on outward Kir2.1 currents in the presence of cytoplasmic SPM.

A, outward currents recorded from the same patch in the presence of 5 μm SPM (a) and SPM 5 μm+ Mg2+ 1.1 mm (b). On each panel, currents obtained using test pulses applied after a short hyperpolarizing prepulse to −40 mV and from a HP of +40 mV were superimposed. Voltages of VTest were +30 mV (top row), +50 mV (middle row) and +70 mV (bottom row). Time-dependent outward currents are induced by using a hyperpolarizing prepulse in b. Fits of a single exponential curve to the decay phase of the slow outward components are also superimposed in b (time constants were 22, 139 and 412 ms at +30, +50 and +70 mV, respectively). Initial values of the fitted exponentials are indicated by the arrows. B, I–V relationship of the time-dependent outward components observed with SPM 5 μm+ Mg2+ 1.1 mm. Amplitudes were determined as the difference between the initial amplitudes of the time-dependent components obtained from the fitted exponentials and the steady-state amplitudes. C, steady-state I–V relationships of the outward currents in the presence of 5 μm SPM (○) and 5 μm SPM +1.1 mm Mg2+ (•). Shown are the current amplitudes obtained using test pulses applied from a HP of +40 mV. Current amplitudes in B and C were normalized with respect to the inward current amplitude at −40 mV obtained with 5 μm SPM alone, which had little effect on the current at −40 mV (I/I−40).
Figure 4. Transient outward currents observed using repolarizing pulses in the presence of 5 μm SPM + 1.1 mm Mg2+.

A, currents obtained using the repolarizing pulse protocol shown on the top. Repolarizing steps to +30, +50 and +70 mV were applied after a 100-ms depolarizing pulse to +80 mV that followed a short hyperpolarizing prepulse to −40 mV. B, I–V relationship of the transient outward components. Shown current amplitudes are the difference between the peak and the steady-state current amplitudes. Current amplitudes were normalized with respect to the inward current amplitude at −40 mV obtained with 5 μm SPM alone, which had little effect on the current at −40 mV (I/I−40).
The I–V relationships for the steady-state outward currents obtained using test pulses applied from a HP of +40 mV in the presence of 5 μm SPM or 5 μm SPM + 1.1 mm Mg2+ (Fig. 3C) were similar to those for whole-cell IK1: they showed a peak at about +20 mV more positive than Vrev and showed a negative slope conductance at more positive voltages (Ishihara & Ehara, 1998; Ishihara et al. 2002). Furthermore, we consistently (n > 30) observed that outward current amplitudes were larger in the presence of SPM + Mg2+ than with Mg2+ alone (Fig. 3A and C), indicating that Mg2+ induced not only the transient component but also the sustained component of the outward currents.
By contrast, Mg2+ dose-dependently reduced inward current amplitudes in the presence of 5 μm SPM (Fig. 5A and B), which was also seen with Mg2+ alone (Fig. 2). This effect made the slopes of the G–V relationships significantly less steep than was observed with SPM alone (Fig. 5C). When the G–V relationships were normalized to the values at around −50 mV, which enabled comparison with those of IK1, the slope of the relationships obtained with 0.6 or 1.1 mm Mg2+ plus 5 μm SPM was close to that of IK1 (Fig. 5D). Thus, the macroscopic Kir2.1 currents obtained from inside-out patches with 0.6 or 1.1 mm Mg2+ plus 5 μm SPM in the cytoplasmic solution reconstituted the properties of the whole-cell Kir2.1 currents and IK1.
Figure 5. Effects of cytoplasmic Mg2+ on inward Kir2.1 currents in the presence of SPM.

A, blockade of inward currents caused by 0.6 and 1.1 mm Mg2+. Currents were recorded from the same patch in the presence of 5 μm SPM (a), 5 μm SPM + 0.6 mm Mg2+ (b), 5 μm SPM + 1.1 mm Mg2+ (c) and 5 μm SPM (d) in chronological order. Superimposed are the currents obtained with voltage steps from −60 to +80 mV in 20 mV steps. B, I–V relationship of the currents shown in A. C, G–V relationships in the presence of 0.6 mm (a) or 1.1 mm (b) Mg2+ plus 5 μm SPM. Superimposed in a are the relationships obtained with 5 μm SPM (○), 0.6 mm Mg2+ (line) and 5 μm SPM + 0.6 mm Mg2+ (▴). Superimposed in b are those with 5 μm SPM (○), 1.1 mm Mg2+ (line) and 5 μm SPM + 1.1 mm Mg2+ (▪). D, G–V relationships of Kir2.1 currents obtained in the presence of 5 μm SPM + 0.6 mm Mg2+ (▴) and 5 μm SPM + 1.1 mm Mg2+ (▪). Shown are the mean values obtained from 3 experiments. Error bars were not shown because they were smaller than symbols. G/Gmax values in this plot were normalized with the values at around −50 mV to enable the comparison of G–V relationships with that of the cardiac IK1 obtained using perforated-patch recordings (dashed line; Ishihara et al. 2002). IK1 data recorded in the presence of 5.4 mm external [K+] were plotted against the deviation of the voltage from Vrev at −83 mV.
Steady-state blockades caused by cytoplasmic SPM and Mg2+
In the experiment summarized in Fig. 6, steady-state blockades caused by SPM and Mg2+ were estimated by analysing tail currents obtained at −30 mV following test pulses applied from a HP of +40 mV. With 5 μm SPM alone (Fig. 6Aa), the amplitude of the single exponential component (ITime) increased as VTest was made more positive. Our recent study strongly suggested that the exponential component reflects the relief of the SPM block in the high-affinity mode (Ishihara & Ehara, 2004). According to this view, the proportion of the exponential component amplitude relative to that of the maximum tail current amplitude (ITime/IMax) is indicative of the fractional high-affinity SPM block at VTest (Fig. 6Ba, filled circles). The difference between the blocked fraction of the current at VTest obtained from the conductance measurements (1 −G/Gmax; Fig. 6Ba, open circles) and the ITime/IMax value was considered to reflect the fractional SPM block in the low-affinity mode, which was relieved much faster than the high-affinity SPM block (Fig. 6Ba, filled triangles; Ishihara & Ehara, 2004).
Figure 6. Steady-state Mg2+ and SPM blockades in the presence of Mg2+ plus SPM.

A, analysis of tail currents at −30 mV observed following test pulses applied from a HP of +40 mV in the presence of 5 μm SPM (a) and 5 μm SPM + 1.1 mm Mg2+ (b). Superimposed in a and b are the data obtained from the same patch with VTest at −20, −10, 0, +35 and +80 mV. The top row shows original currents plotted versus time after applying a voltage step to −30 mV. Amplitude of the time-dependent components increased as VTest was made more positive, and showed an apparent saturation at > 0 mV in a and at > +35 mV in b. The middle row shows the natural logarithm of the differences between amplitudes of the original current and the maximum inward current (IMax). Straight lines show fittings with a single exponential function (time constants were 0.6 and 1.04 ms in a and b, respectively). The bottom row shows the exponential component of tail currents at −30 mV (ITime) reconstructed using the fitted exponentials. B, fractional blockades obtained from the tail current analysis in the presence of 5 μm SPM alone (a) and 5 μm SPM + 1.1 mm Mg2+ (b). The fractional high-affinity SPM block at VTest (•) was obtained from the exponential fraction of the tail currents at −30 mV (ITime/IMax). The difference (▴) between the fractional blockade of current at VTest (1 −G/Gmax; ○) and the ITime/IMax value (•) may reflect the fractional low-affinity SPM block in a and the sum of the fraction of Mg2+ blockade of high-affinity channel and that of the Mg2+ and SPM blockades of low-affinity channel in b.
When both 1.1 mm Mg2+ and 5 μm SPM were present, the exponential fraction of the tail currents was reduced in the voltage range around Vrev (Fig. 6Ab). Under this condition, the time course of the exponential component was slowed: in the experiment shown, the time constants were 0.6 ms in the presence of SPM alone and 1.04 ms in the presence of SPM + Mg2+, which reflects a ∼9 mV shift in the voltage dependence of the exponential component to more negative voltages (data not shown; see Stanfield et al. 1994b; Ishihara et al. 1996). Moreover, tail current amplitudes were smaller in the presence of SPM + Mg2+ than SPM alone because the inward currents were blocked by Mg2+ at −30 mV (Fig. 5). Nevertheless, if we assume that as the channels open they were instantaneously equilibrated with the blocked states by Mg2+, because at −30 mV the Mg2+ block of the inward currents showed no significant time dependence (Figs 2A and 5A), the ITime/IMax values may still give estimates of the fractional high-affinity SPM block.
In the presence of SPM + Mg2+, the voltage dependence of the ITime/IMax values became weaker, and the relationship shifted rightward (Fig. 6Bb, filled circles), indicating that the fractional high-affinity SPM block was diminished in the voltage range around Vrev. Under this condition, the difference between the blocked fraction of the current obtained from the conductance measurements (1 −G/Gmax; Fig. 6Bb, open circles) and that obtained from the ITime/IMax value may reflect the sum of the fractions of the Mg2+ block of the high-affinity channel (the channel showing higher polyamine sensitivity) and the Mg2+ and SPM block of the low-affinity channel (the channel showing lower polyamine sensitivity) at each VTest (Fig. 6Bb, filled triangles). Comparison of this component with that obtained with SPM alone (Fig. 6Ba, filled triangles) indicated that in the steady state Mg2+ blocked a significant fraction of the current flowing through the high-affinity channels at voltages around and negative to Vrev in the presence of 1.1 mm Mg2++ 5 μm SPM.
Mg2+ blockade of the high-affinity channel underlies the time-dependent outward components
When we examined the relation between the time-dependent outward currents (Fig. 3Ab) and the blockades caused by SPM and Mg2+, we confirmed that they are induced by Mg2+ blockade of the channel, as was previously seen with the whole-cell Kir2.1 currents (Ishihara, 1997). For example, when tail currents were obtained using 100-ms test pulses applied after a hyperpolarizing prepulse, the exponential fraction reflecting relief of the high-affinity SPM block was significantly reduced as VTest was made more positive at voltages ≥+35 mV (Fig. 7Aa). Since the relief of the Mg2+ block was virtually instantaneous (Fig. 7Ab), this phenomenon is most likely indicative of the increase in the contribution made by Mg2+ to the blockade of the high-affinity channels at the positive voltages (see also Ishihara et al. 1989, 1996). Figure 7B shows the difference between the ITime/IMax values obtained using 100-ms pulses applied from a HP of +40 mV (open squares) and after a hyperpolarizing prepulse (filled circles). Because the currents at voltages ≥+35 mV are largely blocked even when using a hyperpolarizing prepulse (open circles), the difference between the two values (filled triangles) may indicate the isochronal distribution of the Mg2+ block induced by the hyperpolarizing prepulse. The isochronal outward I–V relationships at the end of 100-ms pulses (Fig. 7C) indicated that the time-dependent components flowed at ≥+35 mV, voltages at which the Mg2+ block was present. It is now our view that these findings indicate that the time-dependent outward currents were caused by Mg2+ blockade of the high-affinity channel.
Figure 7. Mg2+ blockade and time-dependent outward currents induced by a hyperpolarizing prepulse.

A, tail currents at −30 mV following 100-ms test pulses applied after a hyperpolarizing prepulse in the presence of 5 μm SPM + 1.1 mm Mg2+ (a) and 1.1 mm Mg2+ alone (b). Superimposed in a and b are the data obtained from the same patch with VTest at +35, +55 and +90 mV. The top row shows original currents plotted versus time after applying a step to −30 mV. In a, amplitude of the time-dependent components decreased as VTest was made more positive. The middle panel shows the natural logarithm of the difference between the amplitudes of original currents and the maximum inward current (IMax). Straight lines show fittings with a single exponential function (time constant was 1.3 ms). The bottom panel shows exponential components of tail currents (ITime) reconstructed using the fitted exponentials. B, fractional Mg2+ blockade induced by a hyperpolarizing prepulse. Fractional high-affinity SPM block (ITime/IMax) obtained using test pulses applied from a HP of +40 mV (□) and after a hyperpolarizing prepulse (•) are shown. The difference between the two values, which reflects the fractional Mg2+ block induced by a hyperpolarizing prepulse, increased at voltages ≥+35 mV (▴). The fractional block at VTest obtained from the conductance measurements (1 –G/Gmax) is also shown (○). C, isochronal I–V relationships at the end of 100-ms test pulses applied from a HP of +40 mV (□) and after a hyperpolarizing prepulse (•). These relationships indicate that the time-dependent outward currents flowed at ≥+35 mV 100 ms after the onset of the pulses applied after a hyperpolarizing pulse. Data in Figs 6 and 7 were obtained from different patches.
A model for Mg2+ block of the Kir2.1 channel
In our recent study, we demonstrated that the voltage dependences of the macroscopic conductances of the Kir2.1 channel obtained in the presence of various concentrations of SPM and SPD are well described by the sum of the conductances of channel populations with different sensitivities to these polyamines. If the conductances in the positive voltage range, which showed little voltage dependence in the presence of 0.6 or 1.1 mm Mg2+ (Fig. 2C), were those of channels that exhibit a lower sensitivity to Mg2+ blockade and are thus virtually insensitive to Mg2+ at these concentrations in the voltage range examined, the G/Gmax values in the equilibrium at different voltages may be described by the equation:
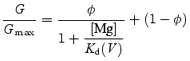 |
(2) |
where Kd(V) is the voltage-dependent equilibrium dissociation constant (Kd) for the Mg2+ block of the high-affinity channel, and Φ is the maximum fractional conductance generated by the high-affinity channels.
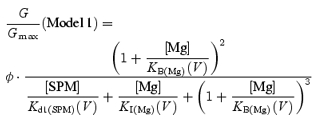
The G–V relationships obtained at the two Mg2+ concentrations could be fitted using eqn (2) with similar Φ values (which were near 0.9) and Kd(V) values (Fig. 8A, symbols), supporting the usage of this equation. The Φ value of 0.9 is in good agreement with the estimated proportion of the channels showing high susceptibility to SPM blockade in the presence of 0.1–10 μm SPM (Ishihara & Ehara, 2004). However, the voltage dependence of the Kd(V) values contained two components. We thus incorporated two Mg2+-blocked states into the model of the high-affinity channel:
| (Model 1) |
where IMg is a shallow blocked state and BMg is a deeper blocked state that is the chief cause of the inward rectification of the currents. In this case, the equilibrium G/Gmax values at different voltages are described by the equation:
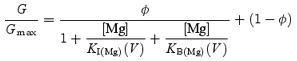 |
(3) |
where KI(Mg)(V) and KB(Mg)(V) are the voltage-dependent Kd values for the Mg2+ block in the IMg and BMg states, respectively. The KI(Mg)(V) and KB(Mg)(V) values determined (the dashed and continuous lines in Fig. 8A, respectively) are given by the following equations:
| (4) |
| (5) |
where KI(Mg)(V) and KB(Mg)(V) are in millimolar, and V is the membrane potential in millivolts. Figure 8B shows the G–V relationships calculated using eqns (3), (4) and (5) and a Φ value of 0.9; the conductances were explained by the sum of the conductances of the high- (dotted line) and low- (dashed line) affinity channels. In this model, currents flowing through the high-affinity channels show strong inward rectification in the presence of 0.6–1.1 mm Mg2+ (Fig. 8D). The mild inward rectification of the macroscopic currents (Fig. 8C) is explained by the presence of currents flowing through the low-affinity channels (Fig. 8D).
Figure 8. A model simulating Mg2+ blockade of macroscopic Kir2.1 currents.

A, Kd values for the Mg2+ block of the high-affinity channel at shallow and deep blocking states (IMg and BMg) at different voltages. Symbols show Kd(V) values obtained by fitting the G–V relationships with eqn (2) (▴, 0.6 mm; □, 1.1 mm Mg2+). From these Kd(V) values, KI(Mg)(V) (dashed line) and KB(Mg)(V) (continuous line) in Model (1) were determined (given by eqns (4) and (5), respectively), which were adjusted to give better fits to the time dependence of outward currents using Model (3) (Fig. 10). B, calculations of G–V relationships with 0.6 mm (upper panel) and 1.1 mm (lower panel) Mg2+. G/Gmax values of the high-affinity (dotted line), low-affinity (dashed line) and total (continuous line) channels were calculated with eqn (3) using a Φ value of 0.9. Symbols are the data values shown in Fig. 2C. The G/Gmax values calculated using eqn (6) gives slightly better fits to the G/Gmax values (not shown). C, calculations of I–V relationships in the presence of 0.6 mm (dashed line) and 1.1 mm (continuous line) cytoplasmic Mg2+. Compare these relationships with those shown in Fig. 2B. D, calculation of the outward current amplitudes of the high-affinity (dotted line) and low-affinity (dashed line) channels in the presence of 1.1 mm Mg2+. Continuous line shows amplitudes of total channels. Current amplitudes shown in C and D were normalized with respect to the calculated inward current amplitude of the total channels at −40 mV in the absence of Mg2+ (I/I−40).
A model that explains the steady-state Kir2.1 currents in the presence of cytoplasmic Mg2+ and SPM
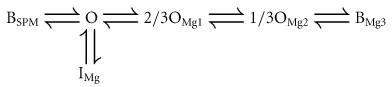
The ‘long lasting and transient’ increase in the outward currents induced by internal Mg2+ and its unique voltage dependence, which shows slower decay at more positive voltages (Figs 3 and 4), are well explained by the following model (Ishihara & Ehara, 1998):
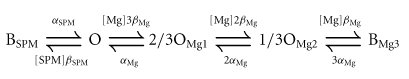 |
(Model 2) |
where [SPM] is the cytoplasmic free SPM concentration, and β and α are the voltage-dependent block and unblock rate constants, respectively, for SPM (βSPM and αSPM) and Mg2+ (βMg and αMg). In this model, an open channel (open state; O) can accommodate either one SPM molecule or up to three Mg2+ ions at three independent Mg2+-binding sites. Channels bound by one Mg2+ ion (2/3OMg1) or two Mg2+ ions (1/3OMg2) show two-thirds or one-third of the unit conductance, respectively, while channels holding three Mg2+ ions BMg3 or one SPM molecule BSPM become non-conductive. By incorporating three Mg2+-binding sites, the chance that SPM will occupy a ‘vacant’ channel becomes small, even if the affinity with which Mg2+ binds is much weaker than that with which SPM binds. This makes the development of the SPM block during depolarizing pulses significantly slower at more positive voltages, just as observed experimentally. For example, the state distribution reached a steady state after ∼200 ms at Vrev+50 mV and later than 1 s at Vrev+90 mV (Ishihara et al. 1989, 1996). The accompanying decrease in the number of channels in the O, 2/3OMg1 and 1/3OMg2 states generates time-dependent outward currents that are qualitatively similar to those observed experimentally (Ishihara & Ehara, 1998). Because we now attribute the time-dependent outward components to the properties of the high-affinity channel (Fig. 7), we applied Model (2) to the model of the high-affinity channel (designated also as the Mode 1 channel below) and examined whether a model involving two populations of Kir2.1 channels with different sensitivities to Mg2+/SPM can account for the steady-state currents.
Incorporating the shallow state of the Mg2+ block (IMg) into Model (2) gives the following:
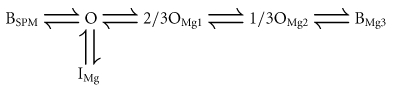 |
(Model 3) |
Here, the relative conductances of the Mode 1 channels in the steady state are calculated by summing the conductances of the channels in the O, 2/3OMg1 and 1/3OMg2 states (see Appendix):
 |
(6) |
where Kd1(SPM)(V) is the voltage-dependent Kd values for the Mode 1 SPM block.
Figure 9Aa shows the G–V relationships for the Mode 1 channel calculated for 5 μm SPM, 1.1 mm Mg2+, and 1.1 mm Mg2++ 5 μm SPM using eqn (6) with KI(Mg)(V), KB(Mg)(V) and Kd1(SPM)(V) values given by eqns (4), (5) and (7). Because we found that in the presence of SPM plus 1.1 mm or 0.6 mm Mg2+ the voltage dependence of the exponential inward currents shifted to more negative voltages by ∼9 and ∼5 mV, respectively, the Kd1(SPM)(V) values we recently obtained in the absence of Mg2+ (Ishihara & Ehara, 2004) were modified as follows:
| (7) |
where Kd1(SPM)(V) is in micromolar and [Mg] in millimolar. Even with this modification, which made the potency of the SPM block higher in the presence of Mg2+, conductances through the Mode 1 channel at voltages more positive than Vrev were larger with 5 μm SPM + 1.1 mm Mg2+ than with SPM alone, as a result of channels distributed in the 2/3OMg1 and 1/3OMg2 states (Fig. 9Ab).
Figure 9. A model reconstructing steady-state inward rectification of Kir2.1 currents in the presence of Mg2+ plus SPM.

A, steady-state G–V relationships of the Mode 1 (high-affinity; a, upper panel) and Mode 2 (low-affinity; a, lower panel) channels in the presence of 5 μm SPM alone (dotted line), 1.1 mm Mg2+ alone (dashed line) or 5 μm SPM + 1.1 mm Mg2+ (continuous line). These calculations were obtained using eqns (6) and (8) with a Φ value of 1 and Φ, respectively. Conductances of Mode 1 channels generated by respective conductive states in the presence of 5 μm SPM + 1.1 mm Mg2+ are shown in b (dotted line, O; dashed line, 2/3OMg1; dot-dashed line, 1/3OMg2). B, calculations of steady-state G–V relationships for total channels. Maximum fractional conductances of the Mode 1 and Mode 2 channels were set to 0.9 and 0.1, respectively (Φ= 0.9); the meanings of the lines are the same as in Aa. Compare these relationships with the data shown in Fig. 5C, lower panel. C, calculations of outward I–V relationships of the Mode 1 (a) and the total (b) channels in the presence of 5 μm SPM (dotted line) or 5 μm SPM + 1.1 mm Mg2+ (continuous line). The I–V relationship of the Mode 2 channel in the presence of 5 μm SPM + 1.1 mm Mg2+ is also shown in a (dashed line). The current amplitudes shown were all normalized with respect to the inward current amplitude of the total channels in the absence of Mg2+ and SPM at −40 mV. D, calculations of the steady-state fractional blockades in the presence of 5 μm SPM (a) or 5 μm SPM + 1.1 mm Mg2+ (b): dotted line, Mode 1 SPM; dashed line, Mode 2 SPM; and dot-dashed line, Mode 1 Mg2+. The continuous line is the total fractional blockade obtained as the sum of the components. See Appendix for the equations used to calculate the fractional Mode 1 SPM and Mode 1 Mg2+ blocks. The fractional Mode 2 SPM block was obtained using eqn (8). The fractional Mode 1 Mg2+ block caused by the respective states in Model (3) are separately shown in c: dotted line, IMg; dashed line, 2/3OMg1; dot-dashed line, 1/3OMg2; continuous line, BMg3 states. See Appendix for some of the equations used for the calculations shown in this figure.
The conductances of the low-affinity channel (designated also as the Mode 2 channel below) were assumed to be determined only by the SPM block, even when Mg2+ was also present. Assuming a first order reaction for SPM blockade, the relative conductances at equilibrium were calculated using the equation (Fig. 9Aa, lower panel):
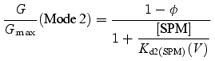 |
(8) |
The voltage-dependent Kd value for the Mode 2 SPM block, Kd2(SPM)(V), is given by the equation (Ishihara & Ehara, 2004):
| (9) |
where Kd2(SPM)(V) is in micromolar. When the conductances of the Mode 1 and Mode 2 channels were summed using a Φ value of 0.9 (Fig. 9B), the G–V relationships obtained experimentally (Fig. 5C) were well reconstituted, and the sustained outward currents induced by cytoplasmic Mg2+ (Fig. 3C) were explained by the properties of the Mode 1 (high-affinity) channel (Fig. 9C).
The steady-state blockades caused by the Mode 1 SPM and Mg2+ blocks, calculated by the model (Fig. 9Db; see Appendix for the equations) were similar to those estimated from the tail currents (Fig. 6Bb); i.e. the voltage dependence of the Mode 1 SPM block became slightly weaker and was shifted rightward by the addition of Mg2+ due to the contribution of the Mode 1 Mg2+ block at voltages around and negative to Vrev (cf. Fig. 9Da). The distribution of the channels in the respective states of the Mode 1 Mg2+ block is illustrated in Fig. 9Dc. This calculation suggests that the IMg state does not contribute substantially to the blockade of outward currents in the steady state.
Discussion
In the present study, we showed that outward Kir2.1 currents are blocked by 0.6 and 1.1 mm cytoplasmic Mg2+ in a concentration-dependent manner, but that a small fraction (∼0.1) of the macroscopic conductance is not blocked by Mg2+ at these concentrations, which is analogous to our recent finding that ∼0.1 of the macroscopic conductance showed a comparatively low susceptibility to SPM blockade. Our analysis of the currents obtained in the presence of 5 μm SPM + 1.1 mm Mg2+ indicates that Mg2+ contributes significantly to the blockade of Kir2.1 channels showing higher SPM sensitivity in the voltage range around and negative to Vrev in the steady state and in the positive voltage range during depolarizing pulses, and thereby induces sustained and transient outward current components, respectively. The Kir2.1 currents obtained from inside-out patches with 5 μm SPM + 1.1 mm Mg2+ reconstituted both the steady-state I–V relationships and the time dependence of the outward Kir2.1 currents and cardiac IK1 observed under whole-cell conditions in the presence of intracellular Mg2+ (Ishihara, 1997; Ishihara & Ehara, 1998). We also showed that a model considering two Kir2.1 channel populations with different sensitivities to both Mg2+ and SPM accounts well for the observed steady-state Kir2.1 currents. In the following discussion, we will demonstrate that this model can quantitatively explain the time-dependent outward components induced by the presence of Mg2+ with SPM.
Two Kir2.1 channel populations exhibiting distinct sensitivities to cytoplasmic Mg2+
The inward rectification of Kir2.1 currents caused by 1 mm internal Mg2+ is comparatively mild, as outward currents in the positive voltage range are not completely blocked by Mg2+ at that concentration (Yang et al. 1995; Fujiwara & Kubo, 2002). We hypothesized that a small population of channels are insensitive to Mg2+ blockade, and estimated the voltage-dependent Kd values for the Mg2+ block of the high-affinity channels using data obtained with 0.6 and 1.1 mm Mg2+ (Fig. 8). As we have discussed previously (Ishihara & Ehara, 2004), the Kir2.1 currents obtained using control Mg2+-free, polyamine-free cytoplasmic solution with symmetrical 150 mm[K+] showed a weak inward rectification due to a slow gating of unknown origin (e.g. Fig. 2A). With 0.6 or 1.1 mm Mg2+, we believe that this slow gating had little effect on Mg2+ blockade, since its time course was virtually instantaneous (Fig. 2A). At lower concentrations (e.g. 0.1 mm), however, the Mg2+ block exhibited a slow time course, and the gating observed in the control cytoplasmic solution did appear to interfere with the Mg2+ block. For that reason, we excluded data obtained at lower Mg2+ concentrations. In addition, we were unable to obtain Kd values for the low-affinity Mg2+ block using higher concentrations of Mg2+ because irreversible run down of the currents (Huang et al. 1998) hampered the analysis.
Yang et al. (1995) previously examined the dose–response relationships of the polyamine and Mg2+ blockades of Kir2.1 channels expressed in Xenopus oocytes at +40 mV with symmetrical 140 mm[K+]. They expressed the relationships as the sum of two Hill equations, which is consistent with our view that there are two populations of Kir2.1 channels with different sensitivities to cytoplasmic blockers. On the other hand, the Kd values they reported for the high- and low-affinity sites were 17 μm and 2.17 mm, respectively, whereas we estimated the Kd value for the high-affinity block to be 61 μm at a voltage of +40 mV.
That the effects of intracellular Mg2+ on whole-cell Kir2.1 currents and IK1 are very similar (Ishihara et al. 1996) implies that the susceptibilities of the Kir2.1 and IK1 channels to Mg2+ blockade are comparable. At the single-channel level, moreover, outward currents through the Kir2.1 and IK1 channels examined with internal Mg2+ at micromolar concentrations showed similar subconductance levels (Matsuda, 1988; Omori et al. 1997). On the other hand, the Kd values for the Mg2+ block of the IK1 channel are small enough to cause strong inward rectification of IK1 (Kd= 1.7 μm at +70 mV (Matsuda, 1988) and 10.5 μm at +30 mV (Matsuda, 1991)), and are even smaller than the Kd values for the high-affinity Mg2+ block of the Kir2.1 channel that we and Yang et al. (1995) obtained. This finding would seem to contrast with the observation that outward macroscopic Kir2.1 currents show significant amplitudes at positive voltages in the presence of ∼1 mm Mg2+, but the discrepancy may be explained if the single IK1 channels examined were the type that show higher Mg2+ sensitivity.
Mg2+-induced shallow blockade
Our analysis indicates that at physiological concentrations Mg2+ would block inward Kir2.1 currents not only by inducing the state that primarily causes inward rectification, but also by inducing a shallower blocking state (Fig. 8A). We incorporated this shallower state into the model of the high-affinity channel and examined whether it could be of physiological importance. Our calculation suggests that the shallow state does not contribute substantially to the blockade of outward currents in the steady state (Fig. 9Dc). It was previously shown that relatively high concentrations of polyamines can also block inward Kir2.1 and Kir2.3 currents by inducing a shallow blocking state that differs from the deeper state causing the strong inward rectification of the currents (Lopatin et al. 1995; Xie et al. 2002). The SPM-induced shallow block apparently involves a shift in the I–V relationship of the unitary currents to more negative voltages that probably occurs when polyamines bind to negatively charged residues (E224 and E299) in the cytoplasmic pore of the channel (Xie et al. 2002, 2003). Xie et al. (2003) proposed that the binding of polyamines at E224 and E299 may pre-position the polyamines prior to blocking the channel at a deeper state. The mechanism of the Mg2+-induced shallow block may be similar and closely related to the Mg2+-induced negative shift of the voltage dependence of the SPM block (Stanfield et al. 1994b; Ishihara et al. 1996; eqn (7) in this study). This point will be investigated further in a future study.
Molecular basis for the model of the Kir2.1 channel
Kir2.1 and IK1 channels show similar subconductance levels in the presence of micromolar concentrations of internal Mg2+ (Omori et al. 1997). We have assumed that the high-affinity channel possesses three Mg2+-binding sites, based on the finding that the distribution of single IK1 channel currents in the full, 2/3, 1/3 and no conductance states show an apparently binomial distribution (Matsuda, 1988). The site responsible for the Mg2+-induced subconductance states has been localized to an aspartate residue (D172) situated in the M2 transmembrane segment lining the pore of the Kir2.1 channel (Oishi et al. 1998), ∼12 Å internal to the narrow K+ selectivity filter (Kuo et al. 2003). Lu et al. (1999) showed that the inner pore of the Kir2.1 channel is sufficiently wide at D172 (> 12 Å) to be occupied simultaneously by up to three Mg2+ ions or a polyamine molecule and that partial occupancy induces distinct subconductance states, which are consistent with our proposed model. However, if D172 forms the actual Mg2+ binding-sites, the number of sites may be four because Kir channels are tetramers of pore-forming subunits (Raab-Graham & Vandenberg, 1998). Alternatively, Oishi et al. (1998) proposed that the binding of one Mg2+ ion to a pair of D172 residues reduces the unit conductance to two-thirds and the binding of two Mg2+ ions to two pairs of the residues reduces the unit conductance to one-third. They further proposed that full blockade by Mg2+ may require binding to a site other than D172; one candidate in the Kir2.1 channel is a site formed by S165 (Fujiwara & Kubo, 2002). Whatever the molecular basis is, Mg2+ apparently reacts with the high-affinity Kir2.1 channel in a manner described by Model (2).
We estimated the proportion of Kir2.1 channels that are susceptible to blockade in the high-affinity mode (Φ value) to be 0.9 for both 0.6 and 1.1 mm Mg2+, which is the same as the value we recently obtained with 0.1–10 μm SPM (Ishihara & Ehara, 2004). In that study, however, we showed that the ratio of high-affinity to low-affinity channels is smaller in the presence of cytoplasmic SPD (1–100 μm) than in the presence of SPM (0.1–10 μm): the Φ value was 0.75 with 10–100 μm SPD and between 0.9 and 0.75 when SPM and SPD were applied together. This suggests that the Kir2.1 channel can fluctuate between two conformational states with different sensitivities to cytoplasmic blockers, and that the binding of polyamines to an intracellular regulatory site separate from the blocking site, though likely situated on the Kir2.1 channel complex (Leonoudakis et al. 2004), alters the equilibrium between the two conformational states. We further showed that the Φ values obtained at various SPM-to-SPD concentration ratios could be explained if the dissociation constant for the interaction between SPD and the regulatory site is ∼25-fold larger than that between SPM and the site (Ishihara & Ehara, 2004). Although the existence of the two Kir2.1 channel states with different polyamine/Mg2+ sensitivities is yet to be demonstrated by single-channel recordings, many types of ion channel show discrete modes of single channel activity, presumably corresponding to different channel conformations (Smith & Ashford, 1998; Yakubovich et al. 2000; Luvisetto et al. 2004). Moreover, single channel currents through Kir2.1 channels expressed in Xenopus oocytes and HEK cells show a variety of unit conductances, and the rate constant for Cs+ block is reduced for the small-amplitude channels (Picones et al. 2001), indicating that the Kir2.1 channel assumes differing conformations in the pore region. A more complete understanding of the molecular basis of the two modes of blockade caused by polyamines/Mg2+ will require more study of single channel currents.
A model that quantitatively reconstitutes the macroscopic Kir2.1 currents in the presence of SPM and Mg2+
We have shown that the time dependences and steady-state I–V relationships of outward whole-cell Kir2.1 currents and IK1 observed in the presence of intracellular Mg2+ can be reconstituted using the Kir2.1 channel with cytoplasmic 1.1 mm Mg2++ 5 μm SPM (Figs 3, 4, 5). Although outward whole-cell IK1 and Kir2.1 currents are virtually ‘time independent’ in the absence of intracellular Mg2+, they do show a significant time dependence in the presence of physiological concentrations of Mg2+ (Ishihara, 1997; Ishihara & Ehara, 1998). The effects of intracellular Mg2+ on the steady-state amplitudes of outward IK1 or Kir2.1 currents have been difficult to determine using whole-cell recordings because the effect is not great enough to rule out the involvement of changes in intracellular factors other than the Mg2+ concentration (K. Ishihara, unpublished observation; see Silver & DeCoursey, 1990). In the present study, we found that physiological concentrations of cytoplasmic Mg2+ consistently, although not greatly, increased the steady-state amplitudes of outward Kir2.1 currents obtained in the presence of 5 μm SPM, while decreasing the amplitudes of the inward currents (Figs 3C and 5).
We previously demonstrated that the time dependence of the outward currents and the accompanying time-dependent changes in the fractional SPM block (the fraction closed by a time-dependent gating mechanism) and the fractional Mg2+ block (the fraction closed by instantaneous gating) of IK1 and Kir2.1 currents are qualitatively well explained by Model (2), which assumes three independent Mg2+-binding sites per channel and subconductance states induced by partial occupancy of those sites (Ishihara & Ehara, 1998). This model fails, however, to predict the steady-state outward IK1 flowing in the voltage range up to near Vrev+∼60 mV because the amplitudes of the outward currents in the steady state are chiefly determined by a time-dependent mechanism that we now ascribe to the high-affinity SPM block (Ishihara et al. 1989). In our recent study, we found that Kir2.1 currents contain a minor instantaneous component that may reflect the low-affinity SPM block and explain the steady-state amplitude of the outward IK1, and the present study suggests this component is nearly insensitive to Mg2+ at physiological concentrations. Using the Kd(V) values we obtained for the Mg2+ and SPM block of the high-affinity Kir2.1 channel, Model (3) (or (2)) nicely predicts the sustained outward components and the steady-state blockades of the high-affinity channel observed in the presence of SPM + Mg2+ (Fig. 9). Thus, a model involving two Kir2.1 channel populations with different sensitivities to SPM or Mg2+ explains well the steady-state Kir2.1 currents obtained with 5 μm SPM + 1.1 mm Mg2+, which show an I–V relationship similar to that of IK1.
Figure 10A shows a simulation of the time-dependent changes in outward Kir2.1 currents observed during depolarizing and repolarizing test pulses with 5 μm SPM +1.1 mm Mg2+. The state probabilities for the Mode 1 (high-affinity) channel at the voltage preceding the test pulses were calculated using eqns (A4)–(A9) (see Appendix), assuming that the state distribution was in the steady state. These were then assigned as the initial values for the state distribution at the onset of the test pulse. The time-dependent changes in the state distribution of the Mode 1 channel were calculated using eqns (A10)–(A14) with the rate constants αSPM, βSPM, αMg and βMg given by eqns (A15)–(A18) (see Appendix). The rate constants were determined so that the αSPM/βSPM and αMg/βMg values at each voltage were similar to Kd1(SPM)(V) and KB(Mg)(V) given by eqns (7) and (5), respectively (see below). When the voltage preceding the test pulses was set at −40 mV, the IMg state probability at that voltage was added to the O state probability at the pulse onset, and was ignored for the state distribution during test pulses. This treatment of the IMg state may be justified because at positive voltages the affinity of Mg2+ for the IMg state is much lower than that for the BMg state (Fig. 8A). The state distribution of the Mode 2 (low-affinity) channel was assumed to reach equilibrium immediately upon a voltage change.
Figure 10. Simulation of the time dependence of outward Kir2.1 currents in the presence of 5 μm SPM + 1.1 mm Mg2+.

A, time-dependent outward currents during depolarizing (a) and repolarizing (b) pulses (second row). Test pulses (continuous line, +30 mV; dashed line, +50 mV; and dotted line, +70 mV) were applied directly from a HP of −40 mV (a) or following a 100-ms depolarizing pulse to +80 mV (b). Current amplitudes were obtained from the relative conductances of the Mode 1 (high-affinity) and Mode 2 (low-affinity) channels, which were calculated as described in the text and Appendix. Compare the reconstructed currents with those shown in Figs 3A and 4A. Shown in the third and bottom rows are the changes in the state probabilities at +50 and +30 mV, respectively: continuous line, BSPM; dashed line, BMg3; and dotted line, 1/3OMg2. The probabilities in the 2/3OMg1 and O states are not shown because they were much smaller than those in the BSPM, BMg3 and 1/3OMg2 states. B, amplitudes of transient outward components during depolarizing (▪) and repolarizing (□) pulses calculated by the model. Depolarizing pulses to various voltages were applied from a HP of −40 mV and repolarizing ones were applied following a 100-ms pulse at +80 mV. The differences between the peak and steady-state amplitudes are shown. Compare these relationships with those shown in Figs 3B and 4B. C, reconstruction of the experimental results shown in Fig. 7B and C. Outward current amplitudes (a) and the fractional Mode 1 SPM block of the total channels (b) at the end of 100-ms pulses applied from HPs of +40 (○) and −40 mV (▪) were calculated. Current amplitudes in this figure were all expressed with respect to that in the absence of Mg2+ and SPM at −40 mV (I/I-40).
The time course of the outward currents observed experimentally (Figs 3A and 4A) are reconstituted by the slow decrease in the probability that the high-affinity channel will be in a conductive state (the 1/3OMg2, 2/3OMg1 or O state) caused by the substitution of Mg2+ blockade with SPM blockade (Fig. 10A). The amplitudes of the time-dependent components (Figs 3B and 4B) are also well reconstituted (Fig. 10B). In our model, the instantaneous amplitudes on repolarization roughly reflect the instantaneous redistribution of the channels among the O, 2/3OMg1, 1/3OMg2 and BMg3 states due to the fast relief of Mg2+ blockade (Matsuoka et al. 2003). Accordingly, the strong inward rectification and the negative slope in the I–V relationship of the repolarization-induced transient components seen experimentally (Fig. 4B) may lend strong support to the view that the Mg2+ block causes a strong rectification of the currents flowing through the high-affinity channels. The calculations shown in Fig. 10C reconstruct the experimental results shown in Fig. 7. This model thus quantitatively simulates the time-dependent changes in both the state distribution and outward current amplitudes.
The rate constants αSPM, βSPM, αMg and βMg used in the calculations are shown in Fig. 11A. The time constants for the SPM block calculated using αSPM and βSPM show a bell-shaped relation (Fig. 11B) and are similar to those obtained experimentally at voltages below ∼+30 mV (data not shown). At voltages more positive than +30 mV, however, the decay phase of the outward currents observed experimentally shows a complicated time course, requiring at least three exponentials to fit, and the time constants of the main component apparently shows a saturation at larger values (data not shown, but see Lopatin et al. 1995). Since our model calculation postulates a fast SPM block at positive voltages, the mechanism underlying this discrepancy needs to be investigated in more detail.
Figure 11.

A, rate constants αSPM, βSPM, αMg and βMg in Model (3) used in the simulation. The βSPM and βMg values shown are those for 5 μm SPM and 1.1 mm Mg2+, respectively. B, time constants, 1/(αSPM+βSPM), calculated for various SPM concentrations: continuous line, 0.1 μm; dashed line, 1 μm; and dotted line, 5 μm.
Physiological implications of Kir2 channel blockade in cardiac cells
Because whole-cell Kir2.1 currents are very similar to the IK1 in cardiac ventricular cells (Stanfield et al. 1994a; Ishihara et al. 1996), we expect that the view we obtained by studying Kir2.1 currents also holds for the IK1 channel. We think that the I–V relationship of the outward IK1 is chiefly determined by the blockade of the low-affinity IK1 channel by cytoplasmic SPM, and that internal Mg2+ blocks the high-affinity IK1 channels, causing subconductance states, which increases outward IK1 amplitudes by inducing both transient and sustained current components. The role of internal SPD is thought to be minor, at least in the steady-state I–V relationship (Ishihara & Ehara, 2004).
Recent studies have shown that IK1 channels may be composed of the closely related subunits Kir2.1, Kir2.2 and Kir2.3 (Liu et al. 2001; Zaritsky et al. 2001; Preisig-Müller et al. 2002). Although the Kir2.2 channel shows a slightly larger single-channel conductance than the Kir2.1 channel (Takahashi et al. 1994), whole-cell Kir2.2 currents are almost indistinguishable from Kir2.1 currents, and macroscopic Kir2.2 currents obtained from inside-out patches in the presence of cytoplasmic polyamines and Mg2+ are essentially very similar to Kir2.1 currents (K. Ishihara, unpublished observation). We therefore think that the same scheme – i.e. the existence of two populations of channels with different sensitivities to cytoplasmic blockers – also applies to the Kir2.2 channel, and that the heteromerization of the Kir2.1 and Kir2.2 subunits would not change the view we obtained by studying the Kir2.1 channel. On the other hand, the Kir2.3 channel is unique in that it is highly sensitive to external pH (Coulter et al. 1995). A strong external pH sensitivity is not usually found with the cardiac IK1 (Ito et al. 1992), and little is known about the role of the Kir2.3 subunit in the cardiac IK1.
The outward IK1 plays a key role in repolarization of cardiac action potentials. We showed in an earlier study that the transient components of the outward IK1 may contribute to the repolarization at relatively positive voltages (Ishihara & Ehara, 1998). In computer models of the cardiac action potential, IK1 is often described as a ‘time-independent background current’ and only its steady-state amplitude is calculated using an empirical equation without incorporating blockade by polyamines and Mg2+ (e.g. Luo & Rudy, 1994). A focus of our future studies will be the influence of IK1 dynamics caused by competition between internal polyamines and Mg2+ for blockade of the channel on cardiac action potential repolarization and on the occurrence of early afterdepolarization during repolarization, which is a major cause of cardiac arrhythmia. One approach to these questions may be to incorporate the voltage-dependent kinetics of IK1 into a simulation model of cardiac action potential.
Acknowledgments
We thank Dr A. Noma (Kyoto University, Japan) and Dr M. Nohmi (Saga University) for invaluable suggestions. This work was supported by the Grants-in-Aid for Scientific Research from the Ministry of Education, Culture, Sports, Sciences, and Technology of Japan.
Appendix
The detailed description of the equations used for calculating Kir2.1 currents is as follows. We assume two populations of Kir2.1 channels with different sensitivities to blockade by cytoplasmic SPM or Mg2+. The high- and low-affinity channels are designated as the Mode 1 and Mode 2 channels, respectively. The Φ value gives the proportion of the channels that are in Mode 1. We found that a Φ value of 0.9 accounts well for the macroscopic currents obtained with 0.1–10 μm SPM alone, 0.6–1.1 mm Mg2+ alone, and 5–10 μm SPM +0.6−1.1 mm Mg2+. Model (3) was used for the Mode 1 channel:
 |
The relative conductance (G/Gmax) and the fractional Mg2+ block (FMgBlock) and SPM block (FSPMBlock) of the Mode 1 channels were calculated by:
| (A1) |
| (A2) |
| (A3) |
where PSPM, PIMg, PO, POMg1, POMg2 and PBMg3 are the probabilities of being in the BSPM, IMg, O, 2/3OMg1, 1/3OMg2 and BMg3 states, respectively. The 2/3OMg1 and 1/3OMg2 states show two-thirds and one-third of the unit conductance, respectively. The steady-state probabilities of being in the respective states were calculated by the following equations:
| (A4) |
| (A5) |
| (A6) |
| (A7) |
| (A8) |
| (A9) |
The KI(Mg)(V), KB(Mg)(V), and Kd1(SPM)(V) values are given by eqns (4), (5) and (7), respectively.
The time-dependent changes in the state probabilities of the Mode 1 channel were calculated by solving the following differential equations:
| (A10) |
| (A11) |
| (A12) |
| (A13) |
| (A14) |
The rate constants are given by (Fig. 11A):
| (A15) |
| (A16) |
| (A17) |
| (A18) |
where [Mg] is in mm.
A simple first order reaction was assumed for the SPM block of the Mode 2 channel. The Mode 2 channel was considered to be insensitive to the Mg2+ block. Thus, the fraction of the SPM block of the Mode 2 channels at equilibrium was calculated by:
| (A19) |
Kd2(SPM)(V) values are given by eqn (9), and the relative conductance of the Mode 2 channels, G/Gmax(Mode 2), was calculated by eqn (8). When calculating the time-dependent changes of the currents, the state distribution of the Mode 2 channel was assumed to reach steady state immediately upon a voltage change (Fig. 10).
References
- Coulter KL, Périer F, Radeke CM, Vandenberg CA. Identification and molecular localization of a pH-sensing domain for the inward rectifier potassium channel HIR. Neuron. 1995;15:1157–1168. doi: 10.1016/0896-6273(95)90103-5. [DOI] [PubMed] [Google Scholar]
- Csernoch L, Bernengo JC, Szentesi P, Jacquemond V. Measurements of intracellular Mg2+ concentration in mouse skeletal muscle fibers with the fluorescent indicator mag-indo-1. Biophys J. 1998;75:957–967. doi: 10.1016/S0006-3495(98)77584-8. [DOI] [PMC free article] [PubMed] [Google Scholar]
- Fabiato A, Fabiato F. Calculator programs for computing the composition of the solutions containing multiple metals and ligands used for experiments in skinned muscle cells. J Physiol Paris. 1979;75:463–505. [PubMed] [Google Scholar]
- Fujiwara Y, Kubo Y. Ser165 in the second transmembrane region of the Kir2.1 channel determines its susceptibility to blockade by intracellular Mg2+ J Gen Physiol. 2002;120:677–692. doi: 10.1085/jgp.20028663. 10.1085/jgp.20028663. [DOI] [PMC free article] [PubMed] [Google Scholar]
- Grynkiewicz G, Poenie M, Tsien RY. A new generation of Ca2+ indicators with greatly improved fluorescence properties. J Biol Chem. 1985;260:3440–3450. [PubMed] [Google Scholar]
- Guo D, Lu Z. Mechanism of IRK1 channel block by intracellular polyamines. J Gen Physiol. 2000;115:799–813. doi: 10.1085/jgp.115.6.799. 10.1085/jgp.115.6.799. [DOI] [PMC free article] [PubMed] [Google Scholar]
- Hamill OP, Marty A, Neher E, Sakmann B, Sigworth FJ. Improved patch-clamp techniques for high-resolution current recording from cells and cell-free membrane patches. Pflugers Arch. 1981;391:85–100. doi: 10.1007/BF00656997. 10.1007/BF00656997. [DOI] [PubMed] [Google Scholar]
- Huang CL, Feng S, Hilgemann DW. Direct activation of inward rectifier potassium channels by PIP2 and its stabilization by Gβγ. Nature. 1998;391:803–806. doi: 10.1038/35882. 10.1038/35882. [DOI] [PubMed] [Google Scholar]
- Ishihara K. Time-dependent outward currents through the inward rectifier potassium channel IRK1. The role of weak blocking molecules. J Gen Physiol. 1997;109:229–243. doi: 10.1085/jgp.109.2.229. 10.1085/jgp.109.2.229. [DOI] [PMC free article] [PubMed] [Google Scholar]
- Ishihara K, Ehara T. A repolarization-induced transient increase in the outward current of the inward rectifier K+ channel in guinea-pig cardiac myocytes. J Physiol. 1998;510:755–771. doi: 10.1111/j.1469-7793.1998.755bj.x. 10.1111/j.1469-7793.1998.755bj.x. [DOI] [PMC free article] [PubMed] [Google Scholar]
- Ishihara K, Ehara T. Two modes of polyamine block regulating the cardiac inward rectifier K+ current IK1 as revealed by a study of the Kir2.1 channel expressed in a human cell line. J Physiol. 2004;556:61–78. doi: 10.1113/jphysiol.2003.055434. 10.1113/jphysiol.2003.055434. [DOI] [PMC free article] [PubMed] [Google Scholar]
- Ishihara K, Hiraoka M, Ochi R. The tetravalent organic cation spermine causes the gating of the IRK1 channel expressed in murine fibroblast cells. J Physiol. 1996;491:367–381. doi: 10.1113/jphysiol.1996.sp021222. [DOI] [PMC free article] [PubMed] [Google Scholar]
- Ishihara K, Mitsuiye T, Noma A, Takano M. The Mg2+ block and intrinsic gating underlying inward rectification of the K+ current in guinea-pig cardiac myocytes. J Physiol. 1989;419:297–320. doi: 10.1113/jphysiol.1989.sp017874. [DOI] [PMC free article] [PubMed] [Google Scholar]
- Ishihara K, Yan D-H, Yamamoto S, Ehara T. Inward rectifier K+ current under physiological cytoplasmic conditions in guinea-pig cardiac ventricular cells. J Physiol. 2002;540:831–841. doi: 10.1113/jphysiol.2001.013470. [DOI] [PMC free article] [PubMed] [Google Scholar]
- Ito H, Vereecke J, Carmeliet E. Intracellular protons inhibit inward rectifier K+ channel of guinea-pig ventricular cell membrane. Pflugers Arch. 1992;422:280–286. doi: 10.1007/BF00376214. 10.1007/BF00376214. [DOI] [PubMed] [Google Scholar]
- Kubo Y, Baldwin TJ, Jan YN, Jan LY. Primary structure and functional expression of a mouse inward rectifier potassium channel. Nature. 1993;362:127–133. doi: 10.1038/362127a0. 10.1038/362127a0. [DOI] [PubMed] [Google Scholar]
- Kuo A, Gulbis JM, Antcliff JF, Rahman T, Lowe ED, Zimmer J, Cuthbertson J, Ashcroft FM, Ezaki T, Doyle DA. Crystal structure of the potassium channel KirBac1.1 in the closed state. Science. 2003;300:1922–1926. doi: 10.1126/science.1085028. 10.1126/science.1085028. [DOI] [PubMed] [Google Scholar]
- Leonoudakis D, Conti LR, Radeke CM, McGuire LM, Vandenberg CA. A multiprotein trafficking complex composed of SAP97, CASK, Veli, and Mint1 is associated with inward rectifier Kir2 potassium channels. J Biol Chem. 2004;279:19051–19063. doi: 10.1074/jbc.M400284200. 10.1074/jbc.M400284200. [DOI] [PubMed] [Google Scholar]
- Liu GX, Derst C, Schlichthörl G, Heinen S, Seebohm G, Brüggemann A, Kummer W, Veh RW, Daut J, Preisig-Müller R. Comparison of cloned Kir2 channels with native inward rectifier K+ channels from guinea-pig cardiomyocytes. J Physiol. 2001;532:115–126. doi: 10.1111/j.1469-7793.2001.0115g.x. 10.1111/j.1469-7793.2001.0115g.x. [DOI] [PMC free article] [PubMed] [Google Scholar]
- Lopatin AN, Makhina EN, Nichols CG. The mechanism of inward rectification of potassium channels: ‘long-pore plugging’ by cytoplasmic polyamines. J Gen Physiol. 1995;106:923–955. doi: 10.1085/jgp.106.5.923. 10.1085/jgp.106.5.923. [DOI] [PMC free article] [PubMed] [Google Scholar]
- Lu T, Nguyen B, Zhang X, Yang J. Architecture of a K+ channel inner pore revealed by stoichiometric covalent modification. Neuron. 1999;22:571–580. doi: 10.1016/s0896-6273(00)80711-4. 10.1016/S0896-6273(00)80711-4. [DOI] [PubMed] [Google Scholar]
- Luo CH, Rudy Y. A dynamic model of the cardiac ventricular action potential. I. Simulations of ionic currents and concentration changes. Circ Res. 1994;74:1071–1096. doi: 10.1161/01.res.74.6.1071. [DOI] [PubMed] [Google Scholar]
- Luvisetto S, Fellin T, Spagnolo M, Hivert B, Brust PF, Harpold MM, Stauderman KA, Williams ME, Pietrobon D. Modal gating of human CaV2.1 (P/Q-type) calcium channels. I. The slow and the fast gating modes and their modulation by β subunits. J Gen Physiol. 2004;124:445–461. doi: 10.1085/jgp.200409034. 10.1085/jgp.200409034. [DOI] [PMC free article] [PubMed] [Google Scholar]
- Matsuda H. Open-state substructure of inwardly rectifying potassium channels revealed by magnesium block in guinea-pig heart cells. J Physiol. 1988;397:237–258. doi: 10.1113/jphysiol.1988.sp016998. [DOI] [PMC free article] [PubMed] [Google Scholar]
- Matsuda H. Magnesium gating of the inwardly rectifying K+ channel. Annu Rev Physiol. 1991;53:289–298. doi: 10.1146/annurev.ph.53.030191.001445. 10.1146/annurev.ph.53.030191.001445. [DOI] [PubMed] [Google Scholar]
- Matsuoka S, Sarai N, Kuratomi S, Ono K, Noma A. Role of individual ionic current systems in ventricular cells hypothesized by a model study. Jpn J Physiol. 2003;53:105–123. doi: 10.2170/jjphysiol.53.105. 10.2170/jjphysiol.53.105. [DOI] [PubMed] [Google Scholar]
- Murphy E, Freudenrich CC, Lieberman M. Cellular magnesium and Na/Mg exchange in heart cells. Annu Rev Physiol. 1991;53:273–287. doi: 10.1146/annurev.ph.53.030191.001421. 10.1146/annurev.ph.53.030191.001421. [DOI] [PubMed] [Google Scholar]
- Nichols CG, Lopatin AN. Inward rectifier potassium channels. Annu Rev Physiol. 1997;59:171–191. doi: 10.1146/annurev.physiol.59.1.171. 10.1146/annurev.physiol.59.1.171. [DOI] [PubMed] [Google Scholar]
- Niwa H, Yamamura K, Miyazaki J. Efficient selection for high-expression transfectants by a novel eukaryotic vector. Gene. 1991;108:193–199. doi: 10.1016/0378-1119(91)90434-d. 10.1016/0378-1119(91)90434-D. [DOI] [PubMed] [Google Scholar]
- Oishi K, Omori K, Ohyama H, Shingu K, Matsuda H. Neutralization of aspartate residues in the murine inwardly rectifying K+ channel IRK1 affects the substate behaviour in Mg2+ block. J Physiol. 1998;510:675–683. doi: 10.1111/j.1469-7793.1998.675bj.x. 10.1111/j.1469-7793.1998.675bj.x. [DOI] [PMC free article] [PubMed] [Google Scholar]
- Oliva C, Cohen IS, Pennefather P. The mechanism of rectification of iK1 in canine Purkinje myocytes. J Gen Physiol. 1990;96:299–318. doi: 10.1085/jgp.96.2.299. 10.1085/jgp.96.2.299. [DOI] [PMC free article] [PubMed] [Google Scholar]
- Omori K, Oishi K, Matsuda H. Inwardly rectifying potassium channels expressed by gene transfection into the green monkey kidney cell line COS-1. J Physiol. 1997;499:369–378. doi: 10.1113/jphysiol.1997.sp021934. [DOI] [PMC free article] [PubMed] [Google Scholar]
- Picones A, Keung E, Timpe LC. Unitary conductance variation in Kir2.1 and in cardiac inward rectifier potassium channels. Biophys J. 2001;81:2035–2049. doi: 10.1016/S0006-3495(01)75853-5. [DOI] [PMC free article] [PubMed] [Google Scholar]
- Preisig-Müller R, Schlichthörl G, Goerge T, Heinen S, Brüggemann A, Rajan S, Derst C, Veh RW, Daut J. Heteromerization of Kir2.x potassium channels contributes to the phenotype of Andersen's syndrome. Proc Natl Acad Sci U S A. 2002;99:7774–7779. doi: 10.1073/pnas.102609499. 10.1073/pnas.102609499. [DOI] [PMC free article] [PubMed] [Google Scholar]
- Raab-Graham KF, Vandenberg CA. Tetrameric subunit structure of the native brain inwardly rectifying potassium channel Kir 2.2. J Biol Chem. 1998;273:19699–19707. doi: 10.1074/jbc.273.31.19699. 10.1074/jbc.273.31.19699. [DOI] [PubMed] [Google Scholar]
- Shimoni Y, Clark RB, Giles WR. Role of an inwardly rectifying potassium current in rabbit ventricular action potential. J Physiol. 1992;448:709–727. doi: 10.1113/jphysiol.1992.sp019066. [DOI] [PMC free article] [PubMed] [Google Scholar]
- Silver MR, DeCoursey TE. Intrinsic gating of inward rectifier in bovine pulmonary artery endothelial cells in the presence or absence of internal Mg2+ J Gen Physiol. 1990;96:109–133. doi: 10.1085/jgp.96.1.109. 10.1085/jgp.96.1.109. [DOI] [PMC free article] [PubMed] [Google Scholar]
- Smith MA, Ashford MLJ. Mode switching characterizes the activity of large conductance potassium channels recorded from rat cortical fused nerve terminals. J Physiol. 1998;513:733–747. doi: 10.1111/j.1469-7793.1998.733ba.x. 10.1111/j.1469-7793.1998.733ba.x. [DOI] [PMC free article] [PubMed] [Google Scholar]
- Stanfield PR, Davies NW, Shelton PA, Khan IA, Brammar WJ, Standen NB, Conley EC. The intrinsic gating of inward rectifier K+ channels expressed from the murine IRK1 gene depends on voltage, K+ and Mg2+ J Physiol. 1994a;475:1–7. doi: 10.1113/jphysiol.1994.sp020044. [DOI] [PMC free article] [PubMed] [Google Scholar]
- Stanfield PR, Davies NW, Shelton PA, Sutcliffe MJ, Khan IA, Brammar WJ, Conley EC. A single aspartate residue is involved in both intrinsic gating and blockage by Mg2+ of the inward rectifier, IRK1. J Physiol. 1994b;478:1–6. doi: 10.1113/jphysiol.1994.sp020225. [DOI] [PMC free article] [PubMed] [Google Scholar]
- Takahashi N, Morishige K, Jahangir A, Yamada M, Findley I, Koyama H, Kurachi Y. Molecular cloning and functional expression of cDNA encoding a second class of inward rectifier potassium channels in the mouse brain. J Biol Chem. 1994;269:23274–23279. [PubMed] [Google Scholar]
- Xie LH, John SA, Weiss JN. Spermine block of the strong inward rectifier potassium channel Kir2.1: dual roles of surface charge screening and pore block. J Gen Physiol. 2002;120:53–66. doi: 10.1085/jgp.20028576. 10.1085/jgp.20028576. [DOI] [PMC free article] [PubMed] [Google Scholar]
- Xie LH, John SA, Weiss JN. Inward rectification by polyamines in mouse Kir2.1 channels: synergy between blocking components. J Physiol. 2003;550:67–82. doi: 10.1113/jphysiol.2003.043117. 10.1113/jphysiol.2003.043117. [DOI] [PMC free article] [PubMed] [Google Scholar]
- Yakubovich D, Pastushenko V, Bitler A, Dessauer CW, Dascal N. Slow modal gating of single G protein-activated K+ channels expressed in Xenopus oocytes. J Physiol. 2000;524:737–755. doi: 10.1111/j.1469-7793.2000.00737.x. 10.1111/j.1469-7793.2000.00737.x. [DOI] [PMC free article] [PubMed] [Google Scholar]
- Yang J, Jan YN, Jan LY. Control of rectification and permeation by residues in two distinct domains in an inward rectifier K+ channel. Neuron. 1995;14:1047–1054. doi: 10.1016/0896-6273(95)90343-7. 10.1016/0896-6273(95)90343-7. [DOI] [PubMed] [Google Scholar]
- Zaritsky JJ, Redell JB, Tempel BL, Schwarz TL. The consequences of disrupting cardiac inwardly rectifying K+ current (IK1) as revealed by the targeted deletion of the murine Kir2.1 and Kir2.2 genes. J Physiol. 2001;533:697–710. doi: 10.1111/j.1469-7793.2001.t01-1-00697.x. 10.1111/j.1469-7793.2001.t01-1-00697.x. [DOI] [PMC free article] [PubMed] [Google Scholar]