

Abstract
The relationship between cell volume (Vc) and membrane potential (Em) in Rana temporaria striated muscle fibres was investigated under different conditions of intracellular acidification. Confocal microscope xz-scanning monitored the changes in Vc, whilst conventional KCl and pH-sensitive microelectrodes measured Em and intracellular pH (pHi), respectively. Applications of Ringer solutions with added NH4Cl induced rapid reductions in Vc that rapidly reversed upon their withdrawal. These could be directly attributed to the related alterations in extracellular tonicity. However: (1) a slower and persistent decrease in Vc followed the NH4Cl withdrawal, leaving Vc up to 10% below its resting value; (2) similar sustained decreases in resting Vc were produced by the addition and subsequent withdrawal of extracellular solutions in which NaCl was isosmotically replaced with NH4Cl; (3) the same manoeuvres also produced a marked intracellular acidification, that depended upon the duration of the preceding exposure to NH4Cl, of up to 0.53 ± 0.10 pH units; and (4) the corresponding reductions in Vc similarly increased with this exposure time. These reductions in Vc persisted and became more rapid with Cl− deprivation, thus excluding mechanisms involving either direct or indirect actions of pHi upon Cl−-dependent membrane transport. However they were abolished by the Na+,K+-ATPase inhibitor ouabain. The Em changes that accompanied the addition and withdrawal of NH4+ conformed to a Nernst equation modified to include realistic NH4+ permeability terms, and thus the withdrawal of NH4+ restored Em to close to control values despite a persistent change in Vc. Finally these Em changes persisted and assumed faster kinetics with Cl− deprivation. The relative changes in Vc, Em and pHi were compared to predictions from the recent model of Fraser and Huang published in 2004 that related steady-state values of Vc and Em to the mean charge valency (zx) of intracellular membrane-impermeant anions, X−i. By assuming accepted values of intracellular buffering capacity (βi), intracellular acidification was shown to produce quantitatively predictable decreases in Vc. These findings thus provide experimental evidence that titration of the anionic zx by increased intracellular [H+] causes cellular volume decrease in the presence of normal Na+,K+- ATPase activity, with Cl−-dependent membrane fluxes only influencing the kinetics of such changes.
Regulation of cell volume (Vc) is of fundamental physiological importance, particularly in cell types that show marked variations in activity and therefore in intracellular solute concentrations (Lang et al. 1998a). In addition, excitable cells in particular must also regulate their resting membrane potential (Em). However, changes in Vc and most volume regulatory mechanisms necessarily influence the precise intracellular ion concentrations that determine Em. Fraser & Huang (2004) therefore recently quantified the factors that might determine and regulate Vc and Em and explored the relationships between them. In particular, their work highlighted the central importance of the osmotic activity of membrane-impermeant intracellular constituents (X−i) and the mean charge valency of X−i (zX) in the determination of resting values of Vc and Em. Thus it was suggested that changes in X−i content would cause proportional changes in Vc, while changes in zX would influence the steady-state values of both Vc and Em in a more complex fashion summarized in Fig. 1. Normal physiological values for Na+,K+-ATPase density and membrane ion permeabilities in amphibian skeletal muscle, summarized in the legend, lead to the prediction that small alterations in zX from expected physiological levels (∼−1.65) significantly influence Vc but exert less influence upon Em (Fraser & Huang, 2004). Thus the predicted influences of changes in zX contrast with the marked effects of Cl−-dependent transport processes upon Em whilst largely sparing Vc. For example, processes that increase [Cl−]i above its equilibrium level cause depolarization of skeletal muscle with little influence upon Vc (Ferenczi et al. 2004; Fraser & Huang, 2004).
Figure 1. The predicted influence of zX upon Vc and Em, from the model of Fraser & Huang (2004).

The continuous line shows Em while the dashed line shows relative cell volume, Vc. The normal value of zX is approximately −1.65, and therefore Vc at this value of zX is assigned the value of 1. Note that small alterations in zX from this physiological level significantly influence Vc but have relatively less influence upon Em. Membrane ion permeabilities were (cm s−1): PNa: 0.8 × 10⁻⁹, PK: 4 × 10⁻⁸, PCl: 12 × 10−8 and sodium pump density was 5 × 10⁻¹² mol cm−2. [X−]i at Vc= 1 was 86 mm. Note that the initial values of [Na+]i, [K+]i and [Cl−]i have no influence on the eventual stable values of Vc or Em (Fraser & Huang, 2004).
The symbol X−i represents a wide range of diffusible and non-diffusible intracellular constituents including proteins, amino acids, nucleotides, organic phosphates and inorganic phosphates (Maughan & Recchia, 1985; Maughan & Godt, 2001), the functions of which are diverse. However, many of these constituents have pKa values close to physiological values of intracellular pH (pHi), and thus provide a significant intracellular non-bicarbonate buffering capacity in a variety of species (Abe, 2000) including frog (Curtin, 1987) and human (Harris et al. 1990) of between 40 and 80 Slykes (mmol H+ per kg wet weight of tissue required to reduce pH by 1 unit at pH 7). By definition, such buffering capacity signifies that small increases in intracellular free [H+] must reflect very much larger increases in the intracellular [H+] that is bound to intracellular proton buffers thus making zX less negative. Thus if zX is, as suggested by Fraser & Huang (2004), a primary determinant of resting cellular volume, it follows that intracellular acidification would result in cellular volume decrease. However, such a relationship assumes that the decrease in the magnitude of zX is not accompanied by an increase in the cellular content of X−, as might occur during certain acidification processes if intracellular dissociation of the acid species produced a membrane-impermeant anionic base.
Such an influence of pHi upon Vc would have important implications in both physiological and pathological conditions. For example, significant intracellular acidification occurs during muscle fatigue: reductions in pHi of ∼0.5 units in man (Kowalchuk et al. 1988; Sullivan et al. 1994) and ∼0.8 units in frog (Krause & Wegener, 1996) have been reported. Furthermore, many cell types show changes in pHi following cellular volume changes: typically, pHi decreases in response to osmotic cell swelling and frequently increases in response to shrinkage (Hoffmann & Simonsen, 1989; Lang et al. 1998a; Jakab et al. 2002). Yet possible effects of pHi upon Vc and the mechanisms by which this might be achieved have received little attention. Furthermore, Fraser & Huang (2004) suggested that a reduction in the magnitude of zX would reduce Vc by reducing the maximum attainable steady-state intracellular free cation content and thereby causing a net efflux of K+. This contrasts with Vc decreases due to increased extracellular osmolality, where cellular K+ content might remain relatively constant. In humans, for example, more than 70% of total body K+ is contained within skeletal muscle at rest and therefore changes in skeletal muscle K+ content have important implications for circulating K+ levels (McDonough et al. 2002; Gosmanov et al. 2003a). This predicted influence of pHi upon Vc in skeletal muscle therefore has considerable significance for whole-body physiology. Indeed, a range of relatively common acidaemic states, including respiratory (hypercapnic) acidosis and end-stage uraemic acidosis, are predictably associated with hyperkalaemia and although acidosis-induced hyperkalaemia is known to result from cellular K+ efflux, the underlying cause of this efflux is not fully understood (Waddell & Bates, 1969; Perez et al. 1981).
The present study is therefore intended as an experimental investigation of the prediction that intracellular acidification would cause cellular volume decrease. The present experiments employed an amphibian muscle preparation that permitted measurement of Vc, Em and intracellular pH, and which is known not to perform significant regulatory volume increase (RVI) following osmotic shrinkage (Blinks, 1965; Ferenczi et al. 2004). Intracellular acidification was achieved using a standard experimental protocol of NH4Cl addition and subsequent withdrawal (Boron & De Weer, 1976; Putnam et al. 1986; Vaughan-Jones & Wu, 1990). The degree of acidification could be varied by altering the duration of exposure to NH4Cl and was quantified using a two-electrode technique. Thus fibres were simultaneously impaled with a pH-sensitive microelectrode and a standard microelectrode, permitting the measurement of both pH and Em in each fibre studied. Cell volume (Vc) changes were assessed using laser confocal microscope xz-plane scanning, which permitted rapid measurements of changes in fibre cross-sectional area with time in a whole-muscle preparation of fixed length (Ferenczi et al. 2004).
NH4Cl withdrawal was shown to result in both intracellular acidification and a net volume decrease, such that all treated fibres reached final volumes that were significantly less than their initial pretreatment volumes. The possible mechanisms of this volume decrease were then investigated by comparing the observed pHi, Em and Vc changes under various conditions with simulations based on the charge-difference model of Fraser & Huang (2004).
Methods
The experiments used sartorius and cutaneous pectoris muscles from cold-adapted Rana temporaria frogs (Blades Biological, Kent, UK) killed by concussion followed by pithing (in accordance with UK legislation).
The control extracellular solutions used were (mm): (A) standard Cl−-Ringer solution: 115 NaCl, 2.5 KCl, 1.8 CaCl2, 3 Hepes; (B) standard SO42−-Ringer solution: 75 Na2SO4, 1.25 K2SO4, 8 CaSO4, 3 Hepes. The experiments first explored the effects of direct additions of 10, 20, 30 and 40 mm NH4Cl to the standard Cl−-Ringer solution without osmotic compensation. In subsequent studies, a quantity of the principal solute in either solution A or solution B was substituted for 40 mm NH4+ to maintain the total osmolality. This was verified using a calibrated vapour pressure osmometer to give the following test solutions: (C) isosmotic 40 mm NH4+, Cl−-containing Ringer solution: 40 NH4Cl, 75 NaCl, 2.5 KCl, 1.8 CaCl2, 3 Hepes; (D) isosmotic 40 mm NH4+-containing, Cl−-free Ringer solution: 20 (NH4)2SO4, 55 Na2SO4, 1.25 K2SO4, 8 CaSO4, 3 Hepes. All solutions were titrated to pH 7.1 (measured with a combination pH electrode, standardized at pH 7) and experiments conducted at 22°C. The reagents used in this study, NH4Cl, (NH4)2SO4, sulforhodamine B, ouabain, chlorothiazide and bumetanide, were obtained from Sigma-Aldrich, UK.
Cell volume (Vc) measurements involved dissection of the cutaneous pectoris muscle in solution A. For those experiments conducted under conditions of Cl− deprivation, the muscle was then gradually equilibrated with Cl−-free solutions by successively halving the Cl− content of the bathing solution approximately every 5 min before a final transfer from 1 mm Cl−-Ringer to Cl−-free Ringer solution. This procedure permitted a reduction in intracellular [Cl−] to negligible levels whilst avoiding the depolarization and consequent contractions associated with rapid [Cl−] efflux (Adrian, 1956; Hodgkin & Horowicz, 1959). The muscle was then mounted, with ventral side uppermost, onto a coverslip that formed the base of a 0.5 ml microscope chamber. The ventral aspect of the muscle was perfused with sulforhodamine B (lissamine rhodamine B200: 75%) in solutions A or B depending on the experiment, at a concentration of 62.5 μg ml−1 (Ferenczi et al. 2004). This membrane-impermeant dye stained the extracellular space, highlighting muscle fibre edges without influencing membrane electrophysiological properties (Gallagher & Huang, 1997). A Zeiss LSM-510 laser-scanning confocal microscope, incorporating an Axiovert 100M inverted microscope, was used to obtain images of fibres in the xz-plane using a × 40 oil immersion objective. The sulforhodamine B was activated with a 543 nm wavelength laser and fluorescence emission captured at > 560 nm. This generated images with fluorescent extracellular space and dark fibre cross-sections.
Initial scanning in the xy-plane was performed to ensure that the x-axis of the xz scans ran perpendicular to the long axes of the fibres. Images were then obtained every 5–60 s in the xz-plane and in-house image analysis software was used to calculate the cross-sectional areas. This analysis initially involved the correction of fluorescence attenuation that was generated as the scanning progressed into the deeper fibre areas (z-direction) using control data described by Ferenczi et al. (2004), to provide the necessary calibrations relating to distances. This was achieved by applying a × 4 multiplication factor to the fluorescence signal of the ventral aspect of the muscle, and progressively adjusting this to a unity correction of the areas closest to the objective. A noise filter and a threshold function were then applied so that any pixels lighter than the threshold were transformed to white and those darker to black. Software then calculated the cross-sectional area of each individual fibre in the field of view by a pixel-counting method. These areas were standardized relative to mean steady-state values obtained in solutions A or B over an initial ≥ 10-min period. Since the muscle was pinned out to a constant length throughout each experiment, these results provided a direct indication of relative fibre volume (Vc). Measured Vc changes could then be compared to predicted volumes, Vp: assuming simple passive osmotic behaviour, ![]() , where
, where ![]() denotes extracellular osmolality and the subscripts denote the experimental states before (a) and after (b) a given solution change.
denotes extracellular osmolality and the subscripts denote the experimental states before (a) and after (b) a given solution change.
The experimental procedure for the cell volume measurements involved an initial equilibration of a cutaneous pectoris muscle in solution A or B for 30 min to confirm stable resting values of Vc. An NH4+-containing solution was then added for a specified duration, and finally solution A or B was restored, thus returning the cell to its original conditions. This procedure was done for Cl−-containing (A and C) and Cl−-free (B and D) conditions. Additionally, the experiments in Cl−-containing solutions were repeated in the presence of 10 μm ouabain (Na+,K+-ATPase inhibitor) throughout.
The pHi and membrane potential (Em) measurements were obtained from sartorius muscles dissected in solution A and pinned out to ∼1.5 times their original length in an earthed bath of volume ∼5 ml. Use of sartorius for such measurements provided a far greater number of fibres than would be the case for a cutaneous pectoris preparation, permitting each fibre to be impaled with recording electrodes only once during the course of an experiment. The Em recordings used standard glass microelectrodes containing 3 m KCl (tip potential < 5 mV, and resistances 6–24 MΩ). They were connected to the electrical readout equipment via bridges containing standard Cl−-Ringer solution in contact with balanced Ag/AgCl reference junctions. The Em recordings were obtained in 10 min time bins, with six electrode insertions into different superficial fibres per time bin to obtain means and standard errors of mean (s.e.m.). Measurements were obtained in solution A for the first 30 min to establish the baseline resting values of Em. This was then replaced with solution C for 100 min of NH4+ exposure and returned to solution A for a final 100 min of recording. In Cl−-free conditions, there was an additional 30 min of measurements in solution B before addition of NH4+ to permit depletion of fibre Cl−. The subsequent NH4+ addition used solution D and upon its removal, the final solution used was solution B. The Cl−-containing conditions were repeated in the continued presence of the cation–Cl− cotransport inhibitors 10 μm bumetanide and 10 μm chlorothiazide and in the presence of the Na+,K+-ATPase inhibitor ouabain (10 μm).
Measurements of pHi used borosilicate glass capillary tubes, drawn into electrodes with tip diameter ∼0.5 μm. The backs were then fire-polished. Under a microscope, electrode tips were gently tapped against a glass tube to produce a diameter of 1–2 μm. Next they were silanized, as described by Thomas (2002). The microelectrodes were then back-filled to the tip with Cl−-Ringer solution at pH 7.1. Each filled electrode was then front-filled to ∼150 μm with Hydrogen Ionophore II-Cocktail A (Fluka Chemika).
The experimental set-up for recording pHi involved an AgCl-coated silver wire placed within the pH electrode with the other end attached to a high impedance input amplifier that connected to a digital readout to give voltage values in millivolts, and an oscilloscope (Hameg, Germany) that monitored voltages. Each electrode was calibrated against two earthed solutions at pH 6.75 and 7.25. During the experiment, the voltage in the bath solution was zeroed to account for extracellular potentials and pH. The tip was then inserted into muscle fibres to record membrane potential and pHi potential. The recorded voltages from such electrodes gradually increased as they approached the sartorius muscle fibres, consistent with a surface alkalinization. They then sharply dropped with further electrode advance, and thereby gave rise to clear-cut cell impalements that yielded readings reflecting voltage contributions from both pHi and membrane potential Em. The latter was corrected for by recording Em from simultaneous impalements of the same cell with a separate voltage-sensitive microelectrode visualized using × 40 magnifications to obtain a tip separation of 50–100 μm. The insertion of the second electrode produced an artefact on the trace from the first that provided confirmation that both were in the same cell. pHi was then calculated using the equation: pHi= pHs− (Es−EpH)/S, where pHs is the pH of a standard solution, Es represents the voltage recorded in that standard solution, EpH is the recorded potential after accounting for membrane potential and S is the slope (mV per pH unit) of the straight line between the two standards (Boron & De Weer, 1976).
Several recordings of pHi and membrane potential were obtained from random superficial fibres in solution A, 10 min before and after NH4+ addition. The muscle was then exposed to NH4Cl (Solution C) for a range of time periods varying from 25 min to 100 min. Further recordings were then obtained for the 10 min preceding and following NH4Cl withdrawal and continued for a further 10 min to form averages. Such measurements were repeated with 10 μm ouabain present throughout, and in Cl−-free conditions using NH4+ exposure periods of 60 min. To ensure that intracellular acidification was comparable between muscle types, the above pHi measurement procedure was repeated with cutaneous pectoris using an exposure period of 25 min. Electrophysiological recordings were obtained from at least two muscles for each experimental condition to confirm reproducibility of results. All comparisons were performed with Student's two-tailed t test to a significance level of P = 0.05.
Results
Fibre volume changes following exposure to hyperosmotic NH4Cl-containing solutions
Figure 2A follows changes in mean relative fibre volume, Vc (± standard errors of the mean, s.e.m.; n = 6) during addition (a) and subsequent withdrawal (b) of NH4Cl from a normal Ringer bathing solution. Vc was derived from measurements of the cross sectional areas of cutaneous pectoris fibres of fixed length, attained using xz-plane scanning confocal microscopy. The muscles were initially placed in standard Cl−-Ringer solution (points before a). Fibres were then exposed for a period of ∼30 min to an extracellular Cl−-Ringer solution to which 30 mm NH4Cl had been added (a). This addition of test solution produced a rapid and significant (P≪ 0.01) volume decrease to a relative volume (Vc) of 0.849 ± 0.004, close to the predicted volume, Vp (see Methods) of 0.85 given the increased osmolality of the test solution of 0.267 ± 0.0015 osmol kg−1 (n = 3) compared to 0.228 ± 0.0012 osmol kg−1 (n = 3) for standard Cl−-Ringer solution. This rapid volume decrease on NH4Cl addition could therefore be attributed to a passive volume change in response to the increased osmolality of the test solution. Withdrawal of NH4+ at point b similarly produced an initial rapid recovery of volume to its original level in standard Cl−-Ringer, consistent with this return to isosmotic conditions. Figure 2B summarizes the mean relative volumes (± s.e.m.) of fibres shortly after the introduction of extracellular Cl−-Ringer solutions that contained varying concentrations of NH4Cl (10 mm, n = 3; 20 mm, n = 4; 30 mm, n = 6; and 40 mm, n = 3 fibres), plotted against the reciprocals of their resulting osmolalities. This demonstrates a linear relationship, the gradient of which (0.241 ± 0.015 osmol kg−1: regression coefficient 0.994; P-value against zero slope < 0.01) agreed with earlier suggestions that Vc in amphibian muscle varies passively with the osmotic properties of the surrounding extracellular fluid (Blinks, 1965; Ferenczi et al. 2004).
Figure 2. The influence of NH4Cl upon cell volume.


A, cell volumes, Vc, were measured using confocal microscope xz-scanning as 30 mm NH4Cl was first added (a) and then withdrawn (b) from the extracellular bathing solution. Cells were initially bathed in normal Ringer solution, and the mean relative volume (± s.e.m., n = 6) compared to these initial volumes is shown against time. Rapid volume changes can be seen at the point of NH4Cl addition and withdrawal and can be attributed to the change in extracellular osmolality. In addition, the fibres underwent a slower volume decrease on withdrawal of NH4Cl, to volumes significantly smaller than those at the start of the experimental period, despite being bathed in identical isotonic solutions at both start and end. B, a summary of the relationship between minimum relative volume (± s.e.m.), immediately following addition of NH4Cl in standard Cl−-Ringer, and 1/osmolality of the extracellular solution  . The relationship is a straight line, demonstrating an initial simple osmotic response of fibre volumes to extracellular osmolality on addition of NH4Cl.
However, although Vc immediately after exposure to the test solutions was inversely proportional to extracellular osmolality, it thereafter showed changes that differed significantly from such straightforward osmotic predictions. Thus, the initial reduction in volume that was observed in response to addition of the test solution was followed by a more gradual but generally significant (P < 0.05) volume increase. For example, the fibres shown in Fig. 2A showed a 3.78 ± 0.68% volume increase (P < 0.01) that extended over 10 min, in contrast to the simple monotonic changes in Vc that were reported following exposures to extracellular solutions made hyperosmotic using impermeant sucrose (Ferenczi et al. 2004). However, Vc did not eventually return to baseline values as it would after sufficient time for the transmembrane equilibration of an uncharged semipermeant solute such as glycerol (Nakajima et al. 1969, 1973). Instead Vc then began to decline, eventually decreasing by 2.91 ± 0.71% (P < 0.01) from its value 10 min after NH4+ addition. The possible explanations for these volume changes are explored below, in the context of the Em and pHi recordings made during similar additions and withdrawals of NH4Cl (see Fig. 7). Nevertheless, Vc was close to the predicted value for the prevailing extracellular osmolality towards the end of each NH4Cl-loading step. Thus in Fig. 2A, Vc rapidly returned to its baseline value when the fibres were returned to normal Ringer (point b), following simple osmotic predictions.
Figure 7. A comparison of the influence of NH4+ addition and withdrawal in an experimental preparation and a simulation using the model of Fraser & Huang (2004).


A, the upper panel shows the mean relative volume (± s.e.m.) of fibres in a typical muscle initially bathed in normal Cl−-Ringer solution, exposed to a Ringer solution with 20 mm NH4Cl added (point a) for 80 min, and finally returned to normal Cl−-Ringer solution (point b). The lower two panels show the values of Vc, Em, [Na+]i, [K+]i, [Cl−]i, [X−]i, [NH4+]i, zX and pHi in a model cell during an identical protocol. [NH3]i is not shown: however, its value peaked at 5.6 × 10⁻⁴m. Note that the Vc changes in the experimental preparation and the model are strikingly similar, thus the model suggests possible mechanisms for the volume changes that occur on NH4+ addition and withdrawal. B, this shows the same simulation as in A, but extended until the model reached stability. Note that despite the significant changes in all modelled variables, including zX and pHi, during NH4+ addition and withdrawal, each returned precisely to its original value on restoration of basal extracellular conditions, despite the lack of mechanisms that specifically respond to any of these parameters.
However, Fig. 2A additionally shows that after this rapid recovery of Vc to its original pretreatment value, the fibres then gradually shrank over the next 20 min, such that fibres eventually reached relative volumes of 0.936 ± 0.05, significantly (P≪ 0.01) smaller than their original resting volumes. The possible causes of this significant net decrease in cell volume were investigated further.
The relationship between intracellular pH (pHi) changes and cell volume (Vc)
Previous studies in other cell types have attributed physiological changes associated with addition and withdrawal of extracellular NH4+ to changes in pHi (Aickin, 1986; Putnam et al. 1986; Vaughan-Jones & Wu, 1990). For example, Loligo giant axons showed an initial rapid intracellular alkalinization following addition of extracellular NH4+ (Boron & De Weer, 1976) compatible with an initial passive influx of NH3 and subsequent intracellular formation of NH4+ and reduction in [H+]i. This initial alkalinization was followed by a net intracellular acidification, compatible with slower but eventually greater NH4+ entry and its intracellular dissociation into NH3 and H+. Subsequent removal of extracellular NH4+ then produced further acidification to pHi levels below baseline as a result of a rapid and sustained NH3 efflux that thereby drove further dissociation of intracellular NH4+ into NH3 and H+. Boron & De Weer (1976) additionally demonstrated that the extent of cellular acidification that was associated with NH4+ withdrawal depended not only upon the extracellular [NH4+] but also upon the duration of the preceding exposure to NH4+. Thus, longer exposures permitted greater build-up of intracellular [NH4+] and thus greater net acidification upon its eventual withdrawal from the bathing solutions.
The present studies accordingly explored the extent to which similar manoeuvres might produce comparable changes in pHi within amphibian skeletal muscle and the extent to which these might be responsible for the changes in Vc observed above. As Boron & De Weer (1976) obtained pHi reductions of only 0.07 ± 0.02 pH units in Loligo giant axon following the termination of a 8–25 min incubation of cells in 10 mm NH4Cl, the present studies employed longer exposures to higher extracellular [NH4Cl] (40 mm). The experiments recorded pHi and Em simultaneously from doubly impaled single fibres within a whole muscle preparation using pHi-sensitive and standard microelectrodes, respectively.
Thus Table 1 shows the recordings of pHi during and after exposures to 40 mm NH4+ of various durations in Cl−-containing or Cl−-free solutions, and in Cl−-containing solutions in the presence of ouabain (10 μm). The initial values of resting pHi that were obtained in normal Cl−-Ringer solutions prior to such exposure were consistent throughout all the muscle groups tested, only ranging from 7.26 ± 0.03 (n = 6) to 7.31 ± 0.05 (n = 4). The addition of NH4Cl in each case produced an immediate intracellular alkalinization of 0.09 ± 0.05 pH units (mean ± s.e.m., P < 0.05) that was then followed by gradual acidification over the remaining course of NH4Cl exposure. The subsequent return to normal Cl−-Ringer then produced marked acidification, to pHi values that ranged from ∼7.06 ± 0.04 (n = 6) with 25 min exposures to ∼6.78 ± 0.09 (n = 7) with an exposure time of 100 min.
Table 1.
Intracellular pH before, during and after exposures to NH4+ of various durations and under different conditions
| 40 mm NH4+ exposure | |||||
|---|---|---|---|---|---|
| Time in NH4+ (min) | Ringer 1 | Early | Late | Ringer 2 | Significance |
| 25 | 7.26 ± 0.03 (6) | 7.27 ± 0.02 (6) | 7.13 ± 0.08 (5) | 7.06 ± 0.04 (6) | P < 0.01 (S) |
| 45 | 7.27 ± 0.03 (5) | 7.37 ± 0.04 (4) | 7.12 ± 0.06 (5) | 6.88 ± 0.03 (7) | P ≪ 0.01 (S) |
| 60 | 7.26 ± 0.03 (5) | 7.42 ± 0.02 (4) | 7.04 ± 0.07 (4) | 6.79 ± 0.06 (8) | P ≪ 0.01 (S) |
| 100 | 7.31 ± 0.05 (4) | 7.46 ± 0.05 (6) | 7.22 ± 0.04 (5) | 6.78 ± 0.09 (7) | P ≪ 0.01 (S) |
| 60 Cl−-free | 7.11 ± 0.01 (2) | 7.15 ± 0.06 (3) | 7.07 ± 0.01 (2) | 6.82 ± 0.06 (5) | P < 0.05 (S) |
| 60 Ouabain | 7.40 ± 0.05 (4) | 7.37 ± 0.03 (7) | 7.14 ± 0.03 (6) | 7.04 ± 0.04 (13) | P ≪ 0.01 (S) |
Data are expressed as means ± s.e.m. (n). The columns designated 'Ringer 1' and 'Ringer 2' list values of pHi in fibres bathed in Ringer solution before and after exposures to NH4+, respectively, while those designated 'Early' and 'Late' show pHi values obtained in the first and last 10 min of the NH4+ exposure, respectively. The column designated 'Significance' shows the result of an unpaired two-tailed t test to assess the significance or otherwise of the difference between pHi in Ringer 1 and Ringer 2. N/S represents not significant and S represents significant.
These findings were based upon pHi recordings from sartorius muscle, as this muscle provided many more fibres than the cutaneous pectoris preparation, allowing each fibre to be impaled with the paired electrodes only once during the course of the experiments. However, as the far smaller cutaneous pectoris muscle was necessary to obtain the recordings of Vc, control experiments were performed to ensure that both absolute resting values and changes in pHi were comparable between these muscles. An exposure period of 25 min to 40 mm NH4Cl demonstrated that cutaneous pectoris had initial resting pHi values of 7.21 ± 0.10 (n = 6) that reached a maximum alkalinization to pH 7.31 ± 0.07 during NH4+ loading, and finally reached a value of 6.91 ± 0.09 (n = 5) following NH4Cl withdrawal, creating an overall significant (P < 0.05) net acidification of 0.30 ± 0.14 units. All three values were in agreement with corresponding values obtained with sartorius muscles (P > 0.05 in each case).
The final stable values of pHi after withdrawal of NH4+ following exposures of different durations in Cl−-containing solutions are summarized in Fig. 3A. It plots the pHi changes that were obtained following NH4Cl withdrawal, relative to the initial baseline recordings that were obtained prior to any NH4Cl exposure, against the duration of the actual NH4+ exposure. It demonstrates that longer exposure periods resulted in greater intracellular acidification, although with a less marked trend at the longest exposure times (∼100 min). These findings thus demonstrated that it is possible to alter pHi in amphibian skeletal muscle, and to partially vary the extent of such perturbations by varying the time periods over which fibres were exposed to such standard concentrations of extracellular NH4+. The pHi changes following NH4+ exposures of various durations may then be compared to the volume changes following a similar range of exposure times (Fig. 3B). In each case, Vc was not significantly different (P > 0.05 in each case) from its initial resting value immediately prior to NH4+ withdrawal, and therefore for clarity Vc is shown only from the point of NH4+ withdrawal in each case. The durations of the preceding NH4Cl exposures were 25 min (n = 4), 45 min (n = 7), 60 min (n = 6) and 100 min (n = 3), respectively, and fibres would therefore have undergone correspondingly increasing degrees of intracellular acidification (Fig. 3A). Figure 3 therefore demonstrates that longer durations of exposure to NH4Cl were associated with both greater volume decrease and greater degrees of intracellular acidification upon its subsequent withdrawal. Furthermore, in each case these reductions persisted over the remainder of the recording period consistent with sustained alterations in Vc.
Figure 3. The influence of the duration of exposure to 40 mm NH4Cl upon the intracellular pH and volume changes that follow its subsequent withdrawal.


A, the mean change in intracellular pH (± s.e.m., n≥ 6 in each case) in fibres returned to normal Ringer solutions following exposures of various durations to 40 mm NH4Cl-containing solutions, compared to intracellular pH prior to NH4Cl exposure. B, the mean relative cell volume, Vc (± s.e.m., n≥ 4) against time for fibres in four muscles following 40 mm NH4Cl exposures of different durations. Time zero is the point of NH4Cl addition, and each plot begins at the point of NH4Cl withdrawal, following exposures to NH4Cl of (left to right) 25, 45, 60 and 100 min, respectively. Exposure to, followed by withdrawal of, extracellular NH4Cl causes intracellular acidification and cellular volume decrease. The magnitudes of each of these changes may be increased by lengthening the duration of the NH4Cl exposure.
The influences of extracellular tonicity, Cl−-dependant processes and Na+,K+-ATPase activity upon NH4+ withdrawal-induced Vc changes
Although Fig. 3 shows that the magnitudes of both the intracellular acidification and the Vc decrease upon NH4+ withdrawal were related to the duration of previous NH4+ exposure, it plainly does not in isolation prove the causal relationship between pHi and Vc that was predicted by Fraser & Huang (2004). However, it is possible to explore the various alternative hypotheses that might explain such a reduction in resting cell volume under conditions of NH4+ addition and withdrawal.
The additions and withdrawals of NH4+ shown in Fig. 2 involved the exposure of muscle fibres to hypertonic Cl−-containing bathing solutions. To date, the mechanisms contributing to regulation of Vc have most often been studied in non-excitable cells such as erythrocytes following exposure to anisosmotic extracellular solutions. In most such cell types, Cl−-dependent transport processes contribute importantly to the regulatory volume decreases (RVDs) and increases (RVIs) that follow osmotically induced cell swelling and cell shrinkage, respectively (Nilius et al. 1996; Strange et al. 1996; Lang et al. 1998b). Thus it must be considered whether the volume decrease on NH4+ withdrawal might occur due to the influence of Cl−-dependent transporters or depend upon the passive Cl− permeability found within striated muscle. However, conditions of Cl− deprivation would then abolish all such Cl−-dependent fluxes and should therefore abolish the close relationship between pHi and Vc. Furthermore, it was possible to expose muscle fibres to NH4+ without simultaneous alterations of extracellular osmolality, in order to exclude processes that might be triggered by passive osmotic alterations in cell volume. Finally, Fraser & Huang (2004) emphasized that pHi would influence the set-point of Vc through its influence on zX, and not that changes in zX would necessarily result in immediate volume changes. The distinction is that the set-point of Vc was defined as the stable volume that would be attained after sufficient time, assuming stable ion permeabilities and a stable and adequate sodium pump density. In the absence of adequate sodium pump activity, this set-point volume could not be attained, and thus inhibition of the sodium pump would be expected to prevent the volume decrease stimulated by NH4+ withdrawal were the mechanism to be as suggested by Fraser & Huang (2004). In contrast, regulatory volume decrease by K+–Cl− cotransport, as has been described in many other cell types, would not be expected to demonstrate such a sharp sodium pump dependency (Lauf, 1988; Lauf & Adragna, 2000). Thus the possible influences of hypertonicity, and Cl−-dependent and sodium pump-dependent processes upon cell volume following NH4+ withdrawal were assessed.
Accordingly, Fig. 4 shows the influence of NH4+ additions and withdrawals under isosmotic conditions using either Cl−-containing (A and C) or Cl−-free (B) solutions in which the principal solute concentration (NaCl or Na2SO4) was reduced according to the added [NH4Cl] or [(NH4)2SO4], respectively (cf. Suput, 1984). Ouabain (10 μm) was present throughout the experiment depicted in Fig. 4C. Solution osmolalities were checked with a calibrated vapour-pressure osmometer (see Methods).
Figure 4. The influences of extracellular tonicity, Cl− and sodium pump activity upon the volume changes induced by NH4Cl withdrawal.


Each panel shows mean relative volume, Vc (± s.e.m., n≥ 4) with time during an initial period in isotonic Ringer solution and following 40 mm NH4+ addition (a) and withdrawal (b). In each case, NH4+ replaced Na+ in the extracellular solution isosmotically such that all bathing solutions were isosmotic to normal Ringer solution. The three panels show fibres exposed to such isosmotic NH4+ containing solutions in normal Cl−-containing solutions (A); Cl−-free SO42−-containing solutions (B); and normal Cl−-containing solutions (C) in the presence of the sodium pump inhibitor, ouabain (10 μm) throughout the time period shown. The periods with no data points are a result of movement of muscle fibres elsewhere in the muscle sheet: some spontaneous mechanical activity was commonly observed during NH4+ loading in the presence of ouabain. NH4+ withdrawal results in significant volume decrease despite constant extracellular osmolality (A). This volume decrease persisted with accelerated kinetics under Cl−-depleted conditions (B), although reached a similar eventual magnitude. However, ouabain (10 μm) abolished this volume decrease (C).
Figure 4A illustrates typical results from fibres (n = 6) that were exposed to an isotonic test solution that contained 40 mm NH4Cl, with an isosmotic reduction in [NaCl]e. Addition of this test solution (point a) produced no significant change in Vc over the 100 min exposure period, whereas its withdrawal (point b) produced a gradual and sustained decline in Vc to 0.885 ± 0.012 (P≪ 0.01) over the remaining 50 min, relative to the initial volumes obtained prior to the experimental manoeuvres. Thus, although the rapid reductions and recoveries in Vc that immediately followed the additions and withdrawals of NH4+ (Fig. 2) could be attributed to extracellular osmolality changes that directly resulted from addition of NH4Cl to the standard Cl−-Ringer, the latter more gradual changes, and in particular the decrease in Vc that followed the eventual withdrawal of NH4+, were neither a consequence of the alteration in extracellular tonicity nor a consequence of a reduction in the principal solute concentration (cf. Figs 2 and 4A).
Figure 4B additionally demonstrates the independence of the volume decrease upon NH4+ withdrawal from Cl− dependent processes. It shows the volume changes recorded in fibres (n = 4) that were exposed to 40 mm NH4+ for ∼60 min (from point a) in solutions that were isosmotic to normal Ringer solution but which substituted extracellular SO42− for Cl−. Following NH4+ withdrawal (point b): fibres underwent a reduction in Vc over a period of ∼20 min to stable values of 0.897 ± 0.005, representing a significant (P≪ 0.01) net decrease in cell volumes below baseline resting values. This was not significantly different (P > 0.05) from the final decrease in Vc resulting from withdrawal of NH4+ following an exposure of similar duration that involved Cl−-containing solutions (Fig. 3B). Furthermore, as was shown in Table 1, the pHi recordings from muscles exposed to NH4+ under identical conditions of Cl− deprivation showed a net intracellular acidification of 0.24 ± 0.06 pH units, indicating that the pHi changes also persisted in the absence of Cl−.
Figure 4C demonstrates the sodium pump dependence of the volume decrease that otherwise resulted from withdrawals of NH4+ (cf. Fig. 4A and B). Muscles were exposed to a similar experimental protocol to that depicted in Fig. 4A, but with 10 μm ouabain present in each solution. Figure 4C shows Vc from the point of ouabain addition following an initial 10-min period in normal Ringer solution to obtain baseline volumes. Thus fibres were equilibrated for 20 min in standard Cl−-Ringer solution with 10 μm ouabain before this was then replaced at point a with a Ringer solution containing 10 μm ouabain in which NaCl was isosmotically substituted with 40 mm NH4Cl for a period of 60 min. Finally, the fibre was returned to the standard Cl−-Ringer solution containing 10 μm ouabain at point b. During the experiment, cell volumes gradually increased by a mean of 11.43 ± 0.299% (n = 6, P≪ 0.05). Withdrawal of NH4Cl now failed to reduce cell volume, despite the net intracellular acidification of 0.36 ± 0.06 pH units that this experimental protocol nevertheless produced (Table 1).
Finally, Fig. 4 also demonstrates a difference in the kinetics of the Vc decrease upon NH4+ withdrawal depending on whether such withdrawal occurred in the presence or absence of Cl−. Thus while the mean half-time of the Vc decrease induced by NH4+ withdrawal was ∼20 min in the presence of normal levels of Cl− (Figs 2A, 3B and 4A), it was ∼5 min under conditions of Cl− deprivation (Fig. 4B) despite a volume decrease of similar eventual magnitude.
Membrane potential changes associated with cell acidification
Figure 4 demonstrates that NH4+ withdrawal (point b) in both Cl−-containing (Fig. 4A) and Cl−-free (Fig. 4B) solutions, resulted in a decrease in Vc to significantly below its initial resting value (P < 0.01), but this volume decrease was inhibited by ouabain (Fig. 4C). These findings were thus in qualitative agreement with the predictions of Fraser & Huang (2004). In order to investigate these predictions quantitatively, the present study went on to investigate membrane potential (Em) values during the addition and subsequent withdrawal of NH4+. The interrelationships between Vc and Em have received recent attention, and highlight the need to consider these two fundamental cellular parameters together (Geukes Foppen et al. 2002; Ferenczi et al. 2004; Fraser & Huang, 2004). For example, depolarization of Em permits Cl− entry and cell swelling while, conversely, increases in [Cl−]i above electrochemical equilibrium are reflected by depolarization of Em due to the high Cl− permeability of skeletal muscle membrane (Hodgkin & Horowicz, 1959; Fraser & Huang, 2004). Thus Fig. 5 shows recordings of Em during NH4+ loading and withdrawal in Cl−-containing solutions (Fig. 5A), Cl−-free solutions (Fig. 5B), and in Cl−-containing solutions in the presence of the Na+–Cl− cotransporter inhibitor CTZ (10 μm) and the Na+–K+–2Cl− cotransporter inhibitor bumetanide (10 μm) (Fig. 5C) (Drewnowska & Baumgarten, 1991; Ferenczi et al. 2004). This permits an exploration of the possible influences of Em upon the Vc changes described above, and an investigation for possible Em regulation by Cl−-dependent processes, such as the Em stabilization reported in muscle fibres shrunken by exposures to hypertonic solutions (Geukes Foppen et al. 2002; van Emst et al. 2004; Ferenczi et al. 2004).
Figure 5. Mean resting potentials during 40 mm NH4Cl loading and withdrawal.


Plot of mean membrane potential (± s.e.m., n = 6 for each data point) against time during NH4+ addition (a) and subsequent withdrawal (b) under different conditions. In each case, NH4+ replaced Na+ in the extracellular solution isosmotically such that all bathing solutions were isosmotic to normal Ringer solution. Means were obtained from random superficial muscle fibres in 10 min time-bins, with 6 electrode insertions per time-bin. A, the influence of isosmotic NH4+ addition and withdrawal in Cl−-containing solutions. Note the gradual ∼20 mV depolarization on NH4Cl addition, and the gradual recovery to normal resting Em following its withdrawal. B, the influence of isosmotic NH4+ addition and withdrawal in Cl−-free solutions. Note that depolarization on NH4+ addition and repolarization on its withdrawal are of similar magnitude but much faster kinetics than in Cl−-containing solutions. C, the influence of isosmotic NH4+ addition and withdrawal in Cl−-containing conditions in the presence of 10 μm bumetanide (NKCC inhibitor) and 10 μm chlorothiazide (NCC inhibitor) throughout the time period shown. Note the gradual ∼20 mV depolarization on NH4Cl addition, and the gradual recovery to normal resting Em following its withdrawal. The kinetics of the Em changes are more similar to those in Cl−-containing than in Cl−-free solutions despite inhibition of cation-Cl−-cotransport, suggesting that passive Cl− redistribution rather than cation-Cl−-cotransport activity slows Em changes on NH4+ addition and withdrawal.
Figure 5A displays Em before (to point a), during (between points a and b) and after (from point b) such exposures to NH4+ in fibres studied in Cl−-containing solutions. The recordings were grouped into 10 min intervals, within each of which six cell impalements of superficial muscle fibres were made to yield a value for mean Em. Muscle cells first equilibrated in Cl−-Ringer solution for 30 min yielded a mean Em of −84.6 ± 0.9 mV (n = 18). Addition of NH4Cl produced a gradual depolarization of Em over ∼40 min to a steady level of −66.3 ± 0.6 mV (n = 18). Final replacement of NH4Cl by normal Cl−-Ringer solution returned Em to −83.3 ± 0.6 mV (n = 18), close to its baseline value (P > 0.05), although over a prolonged time course (> 60 min). Figure 5B demonstrates the corresponding results that were obtained in Cl−-free solutions, following an initial gradual equilibration with Cl−-free SO42−-Ringer solution. Introduction of 20 mm (NH4)2SO4 (i.e. 40 mm NH4+) then rapidly depolarized Em from −87.3 ± 1.0 mV (n = 12) to a steady level of −66.5 ± 0.9 mV (n = 18). Its withdrawal then produced a similarly prompt hyperpolarization to −87.1 ± 0.8 mV (n = 18), not significantly different from its baseline value (P≫ 0.05).
The depolarizations induced by NH4+ addition were therefore similar in magnitude whether performed in Cl−-free or Cl−-containing solutions. However, the changes in Em following both addition and withdrawal of NH4+ were considerably faster in the fibres studied in the Cl−-free solutions. Figure 5C separates the possible contributions of cation–Cl− cotransport and the passive re-equilibration of Cl− to these differences by showing NH4+ addition and withdrawal in the presence of cation–Cl− cotransport inhibitors but under conditions that would nevertheless permit passive Cl− movements. Thus a similar protocol to that used in Fig. 5A was followed in the presence of the cation–Cl− cotransport inhibitors chlorothiazide (CTZ, 10 μm) and bumetanide (10 μm). The isosmotic addition of 40 mm NH4Cl then produced depolarization of Em from −86.7 ± 1.9 mV (n = 18) to −66.2 ± 1.1 mV (n = 18) over ∼40 min and its withdrawal permitted recovery of Em back to −81.8 ± 1.9 mV (n = 18) within ∼60 min. The magnitude and time course of the changes in Em were each similar to those observed in Cl−-containing conditions. The slower kinetics of the Em changes in Cl−-containing (Fig. 5A and C) as opposed to Cl−-free (Fig. 5B) solutions therefore seem likely to be the consequence of passive re-equilibration of transmembrane Cl− gradients over time scales (approximately 30 min) similar to those reported on earlier occasions in skeletal muscle (Hodgkin & Horowicz, 1959; Geukes Foppen, 2004), rather than being due to alterations in cation–Cl− cotransport.
Finally, the influence of the Na+,K+-ATPase was investigated by following NH4+ addition and withdrawal in the presence of ouabain (10 μm). The cells, respectively, depolarized by 22.2 ± 1.3 mV on NH4+ addition (n = 18) to a value of −69.4 ± 1.1 mV, and then hyperpolarized by 16.2 ± 1.5 mV on its withdrawal. This hyperpolarization on NH4+ withdrawal in the presence of ouabain excluded direct participation of the Na+,K+-ATPase in the gross Em changes observed here. However, the magnitude of this repolarization was significantly smaller (P < 0.01) than that of the initial depolarization on addition of NH4+, reflecting a gradual deterioration of Em over the extended period of Na+,K+-ATPase inhibition.
Although NH4+ addition and withdrawal did not therefore produce any significant net change in Em except in the presence of ouabain, NH4+ addition alone produced significant depolarization of Em that was similar under a variety of conditions (Table 2). This depolarization, and the recovery of Em following NH4+ withdrawal, might be explicable in terms of a small, but nevertheless significant, membrane permeability to NH4+. This hypothesis was tested by calculating the NH4+ permeability that would explain the recorded Em changes and comparing it to literature values. Thus if the K+ equilibrium potential (EK) is the main determinant of Em in a quiescent membrane in which Cl− is either absent or in equilibrium, α is the permeability ratio PNH4/PK, R= 8314 J mmol−1 K−1, T= 293 K, F= 96 485 C mol−1, [K+]e= 2.5 mm, and [NH4+]e= 40 mm, the following modification of the Nernst equation allows estimation of the relative NH4+ permeability:
| (1) |
| (2) |
| (3) |
| (4) |
Table 2.
Membrane potential changes (± s.e.m.) following NH4+ addition and withdrawal under different conditions
| Condition | ΔEm upon NH4+ addition (mV) | ΔEm upon NH4+ withdrawal (mV) | Difference (mV) | Significance |
|---|---|---|---|---|
| Cl−-containing | 18.3 ± 1.0 | −17.0 ± 0.8 | 1.3 ± 1.3 | P > 0.05 (N/S) |
| Cl−-free | 20.8 ± 1.3 | −20.6 ± 1.2 | 0.2 ± 1.8 | P > 0.05 (N/S) |
| Cl−-containing with 10 μm CTZ & 10 μm bumetanide | 20.5 ± 2.2 | −15.5 ± 2.2 | 5.0 ± 3.1 | P > 0.05 (N/S) |
| Cl−-containing with 10 μM ouabain | 22.2 ± 1.3 | −16.2 ± 1.5 (n = 12) | 6.0 ± 2.0 | P < 0.01 (S) |
The table shows mean changes in Em, ΔEm (± s.e.m., n = 18 unless stated otherwise) upon NH4+ addition and withdrawal under a variety of conditions. All solutions contained 40 mm NH4+, and all NH4+ exposures were approximately 100 min. The column designated 'Difference' shows the difference between the magnitude of ΔEm upon addition of NH4+ and upon its subsequent withdrawal. The column designated 'Significance' shows the result of an unpaired two-tailed t test to assess the significance or otherwise of this difference. N/S represents not significant and S represents significant.
ΔEm was recorded under a variety of conditions (Fig. 5A–C, and in the presence of ouabain), and α, calculated from eqn (4) above, was similar in each case, within experimental error. The apparent mean value of α was thus 0.078 ± 0.005, ranging from 0.066 in Cl−-containing solutions to 0.088 in the presence of ouabain. This value was compatible with the range of values between α= 0.035 (inward rectifying K+ channels: Hagiwara & Takahashi, 1974) and α= 0.13–0.15 (delayed rectifying K+ channels: Hille, 1973; Reuter & Stevens, 1980) in existing reports.
This therefore supports the conclusion that addition and withdrawal of NH4+ shifted Em to extents that were simply explicable in terms of a small, though nevertheless significant, membrane permeability to NH4+. Furthermore, withdrawal of NH4+ reversed Em back towards its initial baseline values, corresponding to little or no net Em change, in contrast to the marked changes in Vc that were observed. This contrasts with a hypothesis that attributes the decrease in Vc to up-regulation of Na+,K+-ATPase activity, as this would demand a significant hyperpolarization to exclude additional Cl−. Additionally, the lack of a net alteration in Em despite the decrease in Vc in fibres studied in Cl−-free solutions contrasts with the hyperpolarization recently reported following osmotic fibre shrinkage under such conditions (Ferenczi et al. 2004). Nevertheless, these results are consistent with the predictions that a decline in the valency zX of intracellular impermeant anions should induce large reductions in Vc despite only small net depolarizations of Em (see Fig. 1 above; Fraser & Huang, 2004).
Implications of a titration of intracellular impermeant charge
The findings above demonstrate that NH4+ addition and withdrawal results in a consistent net decrease in cell volume, Vc, to significantly less than its normal resting value. It was shown that this volume decrease was not a result of changes in extracellular tonicity, was Cl− independent and was not associated with significant net alterations in Em. The magnitude of the volume decrease was increased by increases in the duration of exposure to NH4+, and abolished by inhibition of the sodium pump. NH4+ withdrawal was additionally associated with a decrease in pHi that was also dependent upon the duration of the preceding NH4+ exposure, as has been reported on previous occasions.
The hypothesis that the observed decreases in pHi and Vc upon NH4+ withdrawal might be causally related was further investigated by mapping the current experimental results onto the quantitative relationship between Vc and Em derived by Fraser & Huang (2004). This related the steady state (t = ∞) Vc to Em and zX through an assumption of passive Cl− distribution using the following equation:
 |
(5) |
where [X−]i(t= 0) denotes the initial (t= 0) concentration of this intracellular impermeant anion, zX its mean charge valency, ![]() the extracellular osmolality, and F, R and T have their usual meanings. [X−]i(t= 0) was taken to be 86 mm, and all other terms in eqn (5) apart from zX were directly available from the experimental data (Tables 1 and 2); zX was calculated assuming its titration against the measured experimental pHi changes as described below.
the extracellular osmolality, and F, R and T have their usual meanings. [X−]i(t= 0) was taken to be 86 mm, and all other terms in eqn (5) apart from zX were directly available from the experimental data (Tables 1 and 2); zX was calculated assuming its titration against the measured experimental pHi changes as described below.
zX was initially assigned the value −1.65 when Vc was 1 (Fraser & Huang, 2004). The value of zX was then assumed to become more positive with decreasing pHi (ΔpH) due to titration of negative charges resident upon X− by increased [H+]i. The change in free [H+]i (Δ[H+]free) in the cell was determined from the experimental pHi records (Table 1):
| (6) |
The change in total [H+]i ([H+]total) that would be required to cause this change in [H+]free depends on the intrinsic (nonbicarbonate) intracellular buffering capacity, βi. This is defined as:
| (7) |
| (8) |
The change in concentration of buffered H+ (Δ[H+]buff) following a given pH change is given by:
| (9) |
| (10) |
If qX denotes the total charge carried by X− per litre cell volume (=zX(old)[X−]i), then a change in H+ buffered by X− will alter zX:
| (11) |
The continuous lines in Fig. 6 show predictions of Vc derived from eqns (5) and (11), using the experimental values of pHi changes following NH4+ exposures of different durations, assuming four different values of βi within the physiological range for skeletal muscle of a variety of species (Abe, 2000): from top down the lines denote βi= 30, 40, 50 and 60 Slykes, respectively. It will be seen that for a given experimental pHi change the predicted volume change is proportional to the magnitude of βi. Also shown on Fig. 6 (filled squares) is the dependence of the changes in Vc upon the duration of the preceding exposure to NH4Cl. It can be seen that the experimental volumes map onto the predicted volumes for βi of between 40 and 60 Slykes, compatible with the 40–50 Slykes values reported for Xenopus skeletal muscle (Curtin, 1987).
Figure 6. Actual and predicted relative fibre volumes following exposures of fibres to 40 mm NH4Cl for different durations.

A comparison of the actual mean relative volumes with the volumes predicted by the hypothesis that intracellular acidification causes volume decrease by titrating the negative charge of intracellular anions. The filled squares show the eventual mean relative volumes, Vc (± s.e.m., n≥ 4) following exposures of different durations to 40 mm NH4Cl. These may be compared to the predicted volumes (continuous lines) calculated from the pH changes recorded following such exposures (Table 1), and assuming an intracellular buffering capacity, from top down of βi= 30, 40, 50 and 60 mm H+/pH unit, respectively. The standard errors of the predicted volume lines are not shown for clarity, but are very approximately ± 1 interline space.
The experimental findings therefore demonstrate a predictable relationship between pHi, the charge valency of intracellular impermeant anions and resting cell volume. They additionally provide a number of parameters necessary to model this system using the charge-difference method of Fraser & Huang (2004), and support the use of literature values for intracellular buffering capacity in such a simulation. Thus the model of Fraser & Huang (2004) was modified, as described in the Appendix, to permit the quantification of the influence of NH4+ addition and withdrawal upon Vc and Em. This model successfully reproduced the experimental Vc changes that followed addition and withdrawal of NH4Cl, thereby permitting further analysis of the possible mechanisms of the changes in Vc and Em in relation to the changing intracellular solute concentrations predicted by the model.
Thus Fig. 7A compares experimental findings (upper panel) during addition (point a) and subsequent withdrawal (point b) of 20 mm NH4Cl with results from the modified charge difference model of Fraser & Huang (2004) (centre and lower panels). These modifications, fully described in the Appendix, included the addition of equations to model the equilibration reaction NH4+⇌ NH3+ H+; NH4+, NH3 and H+ fluxes; Na+, H+ exchanger (NHE) activity; intracellular H+ buffering; and the influences of each of these processes upon Em.
Following the standard procedure for the Fraser & Huang (2004) model, the simulation was first initiated with semiarbitrary values for each intracellular solute concentration and allowed to run to its point of stability. Initial values were (m): [Na+]i: 0.05; [K+]i: 0.05; [Cl−]i: 0.05; [H+]i: 10−7; [X−]i: 0.03. Once the model was stable, Vc was assigned a value of 1, and all other solute concentrations were as shown at time zero in Fig. 7. Note that to achieve values of pHi similar to those recorded experimentally, simulation of Na+, H+ exchanger (NHE) activity was required (see Appendix). There is molecular and functional evidence for the presence of this transporter in skeletal muscle (Wakabayashi et al. 1997; Slepkov & Fliegel, 2002).
The simulation of NH4Cl addition produced a rapid passive volume decrease attributable to the increased extracellular osmolality. This was followed by a volume increase of ∼2% over the next 10 min. This could be attributed to two factors: an inward Cl− flux secondary to the depolarization of Em that resulted from NH4+ addition; and an increase in the magnitude of zX due to a rise in pHi. Together, these factors would tend to increase the total negative charge within the cell, permitting the influx of NH4+ to exceed the efflux of K+ that otherwise resulted from its entry into the cell. The contribution of NH3 entry to the volume change was insignificant: its concentration peaked at 5.6 × 10⁻⁴m. This volume increase was then followed by a volume decrease that was entirely attributable to a reduction in the magnitude of zX due to buffering of H+ as pHi fell and a resultant net cation loss from the cell. However, a Cl− influx secondary to depolarization of Em as [K+]i decreased then began to oppose and eventually exceed the influence of this process, resulting in the development of a further swelling phase. This depolarization was somewhat more pronounced than that observed in the experimental preparation. Note, however, that the activities of the Na+,K+-ATPase and the Na+, H+ exchanger (NHE) in the model were determined solely by their respective thermodynamics. Thus it is possible that the discrepancy between the modelled and experimental values of Em in the latter part of the NH4Cl loading phase reflects up-regulation of one or both of these transporters. In particular, up-regulation of the NHE under these conditions was shown to produce a significant hyperpolarizing influence by both reducing the net increase of [H+]i and by permitting increased Na+,K+-ATPase activity, which increased [K+]i and thus decreased [NH4+]i at steady state.
Withdrawal of NH4Cl then prompted a rapid volume recovery due to the passive osmotic influence of the solution change. This was followed by intracellular acidification and volume decrease over the next 20–30 min, the eventual magnitudes of which matched those observed experimentally. This volume decrease was attributable to intracellular acidification and the resultant decrease in the magnitude of zX. However, it should be noted that such changes in the magnitude of zX merely influence the Vc and Em set points of the cell, and thus continuing Na+,K+-ATPase activity was necessary to restore normal [K+]i, thus maintaining polarization of Em and hence maintaining the exclusion of [Cl−]i from the cell.
Finally, Fig. 7B shows a continuation of the traces from the middle panel of Fig. 7A, demonstrating that despite the gross changes to all modelled variables during NH4+ addition and withdrawal, the cell was able to return precisely to its original resting state after a sufficient period of time. However, the time required for such recovery was too great for its demonstration experimentally. Nevertheless, it supports the hypothesis of Fraser & Huang (2004) that Vc and Em each have a single set-point value which will be obtained after sufficient time, assuming stable transmembrane ion permeabilities and a stable and adequate Na+,K+-ATPase density. Furthermore, it extends that hypothesis by demonstrating that, under conditions of stable Na+–H+ exchanger density, pHi and zX additionally each have set-point values.
Discussion
The present study examined the effect of intracellular acidification on the relationship between cell volume (Vc) and membrane potential (Em) in striated muscle fibres of Rana temporaria. A possible relationship between intracellular pH (pHi), Vc and Em was suggested by the recent study of Fraser & Huang (2004). This study identified the total osmotic activity of intracellular membrane-impermeant osmolytes (X−i) and the mean charge valency of X−i (zX) as the chief determinants of steady state Vc and Em in an otherwise stable cell with a passive transmembrane Cl− distribution. However, many of the components of X−i, including proteins, amino acids, nucleotides and phosphorus-containing anions (Maughan & Recchia, 1985; Maughan & Godt, 2001), function as significant intracellular buffers at physiological pHi, and therefore changes in pHi would be expected to influence the precise value of zX. In particular, the hypothesis of Fraser & Huang (2004) would predict that intracellular acidification, through a reduction in the magnitude of zX, would cause a decrease in Vc while only slightly depolarizing Em if zX was initially in the physiological range (see Fig. 1).
Furthermore, Fraser & Huang (2004) suggested that changes in zX would influence Vc by changing intracellular cation content, and thus acidification-induced Vc decrease would be associated with a significant K+ efflux. Intracellular acidification of skeletal muscle occurs in vivo under both physiological and pathological conditions. For example, significant pHi decreases occur in vivo in exercising skeletal muscle (Sjogaard et al. 1985; Kowalchuk et al. 1988) and secondary to systemic acidoses (Waddell & Bates, 1969; Perez et al. 1981). In addition, osmotic Vc changes are frequently associated with changes in pHi and Na+, H+ exhanger activity (Decoursey, 2003): typically, pHi decreases in response to osmotic cell swelling and frequently increases in response to shrinkage (Hoffmann & Simonsen, 1989; Lang et al. 1998a; Jakab et al. 2002). However, skeletal muscle contains > 70% of total body K+ in humans (McDonough et al. 2002) and thus any such relationship between pHi and Vc would have significant implications for whole-body K+ homeostasis. Therefore the present study represents an experimental investigation of this predicted influence of pHi upon Vc and Em.
Intracellular acidification was brought about using a standard protocol of NH4Cl addition and withdrawal. Withdrawal of NH4Cl from a previously loaded fibre has been shown to generate considerable decreases in pHi (Aickin & Thomas, 1976, 1977), as the rapid outward diffusion of volatile NH3 and much slower efflux of NH4+ favours dissociation of the latter and hence a reduction in pHi. Furthermore, such intracellular acidification is not then associated with a corresponding increase in the intracellular content of impermeant anion, as might be the case for similar dissociation of non-volatile acid such as proprionic acid. The pHi and Em changes associated with NH4+ exposure and withdrawal were quantified for striated muscle using pH-sensitive and KCl microelectrodes, respectively. The present study thus confirmed that withdrawal of NH4Cl from amphibian skeletal muscle resulted in sustained intracellular acidification, the magnitude of which increased with the duration of preceding exposures to NH4Cl (Fig. 3A). Comparable pH changes were seen under conditions of Cl− deprivation and in the presence of ouabain (Table 1).
Muscle fibre volumes, Vc, were studied under similar conditions of NH4Cl addition and withdrawal using confocal xz-plane scanning (Ferenczi et al. 2004), thus allowing accurate and continuous measurement of fibre volume throughout the acidification protocol. Application of Ringer solutions to which NH4Cl was added induced rapid reductions in Vc that promptly reversed upon withdrawal of such solutions and could be directly attributed to the related alterations in extracellular tonicity. However, slower volume changes were also observed that could not be related to changes in extracellular tonicity, and indeed persisted during otherwise similar additions and withdrawals of NH4+ under isotonic conditions. Thus Vc gradually increased during the first ∼10 min of NH4+ exposure, after which a slow Vc decrease was generally observed that accelerated upon withdrawal of NH4+.
The slow volume increase upon NH4+ addition is likely to represent an influx of NH3 and NH4+. However, Vc did not eventually return to baseline values as it would after sufficient time for the transmembrane equilibration of an uncharged semipermeant solute such as glycerol (Nakajima et al. 1969, 1973). Instead Vc stabilized closer to the value that would be expected following exposure to an impermeant osmolyte such as sucrose (Blinks, 1965; Ferenczi et al. 2004). At pH 7.1, extracellular [NH3] would be < 0.3 mm when [NH4+]e was 39.7 mm, so despite the significant membrane permeability of NH3, passive NH3 influx could have little influence upon cell volume. Nevertheless, NH4+ is both positively changed and relatively membrane permeant (PNH4/PK= 0.07–0.08 from data in Table 2) and therefore an influx of NH4+ would be expected until [NH4+]i considerably exceeded [NH4+]e. However, a net influx of solute would be expected to result in osmotic swelling, so it was necessary to consider whether the lack of such swelling indicated a failure of NH4+ to enter the cell under the present experimental conditions. Cell modelling, using the charge-difference method of Fraser & Huang (2004), suggested that the majority of NH4+ influx would provoke an equimolar efflux of K+, thus would not be expected to increase the total osmolyte content, and hence the volume, of the cell. The small initial volume increase that followed the osmotic shrinkage on NH4Cl addition was explicable in terms of the depolarization and consequent Cl− influx that was caused by NH4+ addition.
These phenomena can also be explored by a simple consideration of electroneutrality constraints, which would suggest that any bulk NH4+ entry would result in an efflux of intracellular K+ and/or an influx of extracellular Cl−. Only if the Cl− influx was significant would there be a significant net solute influx and consequent volume increase. Yet it is to be expected that NH4+ influx would be primarily associated with K+ efflux, rather than a Cl− influx, as both K+ and Cl− are close to electrochemical equilibrium at steady state. Therefore while extracellular concentrations remain fixed, maintenance of the relationship [K+]e/[K+]i≈[Cl−]i/[Cl−]e (Hodgkin & Horowicz, 1959) requires far greater K+ shifts than Cl− shifts following any transient change in Em such as that which would result from the influx of NH4+. Thus the failure of cell volume to recover to baseline values despite NH4+ entry is likely to reflect a simultaneous K+ efflux and thus a lack of net solute uptake, while the small volume increase is likely to reflect a much smaller influx of Cl−. This was supported by the Em recordings during NH4+ addition, which showed an initial depolarization that would permit a small Cl− influx and thus a small Vc increase, but which then stabilized suggesting that [Cl−]i did not further increase to above its electrochemical equilibrium. Given the high PCl: PK ratio in skeletal muscle, any such increase in [Cl−]i from its normal resting value of ∼3 mm of sufficient magnitude to cause detectable volume change would be reflected by significant depolarization (Hodgkin & Horowicz, 1959; Geukes Foppen et al. 2002; Ferenczi et al. 2004).
The gradual volume decreases that occurred during the latter stages of NH4+ addition and following NH4+ withdrawal together reduced final Vc by up to 12% compared to its initial value at rest. Such volume decreases therefore occurred during the periods of intracellular acidification, and both the magnitude of eventual intracellular acidification and the magnitude of the eventual volume decrease were related to the duration of the preceding NH4+ exposure. However, although such an association between pHi and Vc followed qualitatively the predictions of Fraser & Huang (2004), other possible mechanisms of volume decrease were investigated in order to examine whether the pHi and Vc changes might be causally related, or whether the Vc changes represented some other influence of NH4+ addition and withdrawal.
The volume decreases on NH4+ withdrawal persisted under conditions of Cl− deprivation, thus excluding a possible role for Cl−-dependant fluxes including cation–Cl− cotransporters such as the K+–Cl− cotransporter, which is associated with regulatory volume decrease in a variety of other tissues (Lang et al. 1998a; Lauf & Adragna, 2000). Indeed, Cl− deprivation increased the rate of acidification-induced volume decrease. In the presence of Cl−, any Vc change would have to be accompanied by transmembrane redistribution of Cl− if this ion were to remain in electrochemical equilibrium, and the slower Vc changes in the presence of Cl− are consistent with previously reported kinetics of the passive redistribution of transmembrane Cl− gradients (Hodgkin & Horowicz, 1959; Geukes Foppen, 2004).
Electrophysiological studies followed Em in muscles exposed to 40 mm NH4+ for ∼100 min before its withdrawal. They demonstrated a significant depolarization on addition of NH4+, although such a change was explicable in terms of a Nernst equation modified to include a realistic NH4+ permeability term (PNH4/PK≈ 0.07–0.08). Withdrawal of NH4+ then resulted in a return of Em to approximately its original resting value, and Em then remained stable for at least 1 h. Thus despite the significant intracellular acidification and decrease in Vc that resulted from the withdrawal of NH4+, this manoeuvre produced no significant overall change in Em. This stability suggested that the observed alterations in Vc were not a result of cation–Cl− fluxes, as due to the high membrane PCl of skeletal muscle, any change in [Cl−]i away from its electrochemical equilibrium value would be reflected in a change in Em (Geukes Foppen et al. 2002; Ferenczi et al. 2004). Furthermore, Em changes of similar magnitude were observed whether the manoeuvres were performed using Cl− or Cl−-free Ringer solution, and in the presence of the cation–Cl− cotransport inhibitors bumetanide and chlorothiazide. However, the Em changes in Cl−-free solutions assumed much more rapid kinetics, consistent with the expected redistribution of transmembrane Cl− gradients in Cl−-containing solutions.
In contrast, ouabain abolished the acidification-induced volume decrease, and instead muscle fibres gradually swelled over time. On the one hand, this might suggest that the volume decrease on NH4+ withdrawal resulted from an increase in Na+,K+-ATPase activity. However, Fraser & Huang (2004) point out several reasons why increased Na+,K+-ATPase activity could not underlie such a volume decrease in the present preparation. (1) The Na+,K+-ATPase normally functions close to energetically unfavourable levels that might preclude such a significant up-regulation of activity. (2) Such energetic limits also imply that increases in Na+,K+-ATPase densities from their normal physiological levels would have little effect upon either Vc or Em. (3) Any increase in Na+,K+-ATPase activity could cause volume decrease only if it were able to produce a net efflux of solute. Thus in the absence of both membrane-permeant cations and anions, such as is the case in Cl−-free solutions, changes in Na+,K+-ATPase activity alone could not be expected to change Vc. Indeed, even in the presence of Cl−, equilibrium [Cl−]i is ∼3 mm when Em is −90 mV, precluding a net Cl− efflux of significant magnitude to produce detectable volume decrease. (4) If Cl− is passively distributed, its efflux can only occur following hyperpolarization of Em. However, while NH4+ addition and withdrawal reduced Vc to significantly below its initial resting value, Em did not demonstrate any net change.
In summary, the findings demonstrate that exposure to NH4+ and subsequent return to basal conditions causes intracellular acidification and a net decrease in cellular volume without detectable net changes in Em. Such cellular shrinkage, to less than normal resting volumes despite constant extracellular osmolality, cannot be explained by simple efflux of NH4+ or indeed of K+: skeletal muscle has an extremely low resting [Cl−]i of < 5 mm, and as this is the only significantly membrane-permeant anion in the normal state, it follows that there is insufficient mobile anion content to support significant net cation effluxes. The Cl− independence of this Vc decrease was confirmed by its persistence in Cl−-free SO42−-Ringer solutions, which lack significant concentrations of any membrane-permeant anions (Spurway, 1972). However, under certain conditions, regulatory volume decreases may involve effluxes of normally membrane-impermeant anions such as amino acids. (Schultz & Curran, 1970; Rasmusson et al. 1993; Pasantes-Morales et al. 2000; Pena-Rasgado et al. 2001). Whilst such an efflux cannot be entirely ruled out, such fluxes produce volume decreases that are not Na+,K+-ATPase dependent and may indeed be stimulated by Na+,K+-ATPase inhibition (Jackson & Strange, 1993; Fraser & Huang, 2004). In contrast, the volume decrease reported here on NH4+ withdrawal was abolished by ouabain.
The present study therefore demonstrates Vc decreases to below resting levels following addition and withdrawal of NH4+, which are associated with stable Em values, occur even in the absence of membrane-permeant anions, but which require a functional Na+,K+-ATPase. Therefore the most plausible explanation for the Vc decrease upon withdrawal of NH4+ is one in which the observed acidification titrates and thus reduces the magnitude of the mean valency, zX, of otherwise conserved intracellular anions, X−i (Fraser & Huang, 2004). This reduction in total intracellular anionic charge must result in either a reduction in cellular cation content or an increase in cellular Cl− content. In the presence of normal levels of Na+,K+-ATPase activity and hence a normal membrane potential, such a net Cl− influx would be energetically unfavourable, and therefore a net cation efflux would be expected (Fraser & Huang, 2004), thereby reducing the total intracellular osmolyte content and hence cell volume.
In the absence of any other changes, a reduction in the magnitude of zX thereby alters the volume set-point of the cell at which the net transmembrane ion fluxes (due to ion leakage and unregulated Na+,K+-ATPase activity) are zero. The findings therefore support qualitatively the hypothesis that the mean charge valency (zX) carried by a fixed intracellular content of membrane-impermeant ion (X−) is critical in the determination of resting cellular volume (Fraser & Huang, 2004).
However, it was additionally possible to explore the experimental findings quantitatively. The decreases in pHi following NH4+ exposures of various durations were used to predict the corresponding volume changes, assuming a range of realistic values of intracellular buffering capacity (βi). Thus it was assumed that the total charge carried by X− (mEq) was reduced by an amount equal to the quantity of H+ (mm) that must have been buffered given the experimentally determined pHi changes and various physiologically reasonable values of βi. The quantitative relationship between Vc, [X−]i, Em and extracellular tonicity described by Fraser & Huang (2004) was then used to predict the expected volume change following such a change in zX. The experimentally determined volume changes mapped onto values of Vc predicted in this way for βi between approximately 40 and 60 mm H+/pH unit (40–60 Slykes). This corresponds well with literature values for the skeletal muscle of a variety of other species, including mouse skeletal muscle (∼45 Slykes, Aickin & Thomas, 1977). This predictable relationship between the final values of pHi and Vc permitted a comparison of the experimental data with a modification of the charge-difference model of Fraser & Huang (2004). The model was able to reproduce the full sequence of volume changes that resulted from NH4+ addition and subsequent withdrawal. It additionally demonstrated that Na+, H+ exchanger activity was necessary to maintain physiological values of pHi and was sufficient to restore pHi and zX to their normal resting values after any perturbation, without any necessity for pHi-dependent regulation of its activity. This suggested that zX and pHi have apparent set-point values, in common with the parameters Em and Vc (Fraser & Huang, 2004).
Finally, these findings are in qualitative agreement with other observations. For example, cellular acidification is known to produce K+ efflux, such that hyperkalaemia is a well-recognized complication of most forms of acidosis (Perez et al. 1981). This is well explained by a loss of titratable charge upon intracellular membrane-impermeant anions. As reviewed in Lang et al. (1998a) and Jakab et al. (2002), it has been established that cell swelling generally induces intracellular acidification. This may partially counter the cell swelling, as reduction in the magnitude of zX would permit compensatory cell shrinkage. Conversely, hypertonicity promotes Na+, H+ exchanger activity in a variety of tissues (review: Wakabayashi et al. 1997), thereby increasing intracellular pH and hence potentially increasing cell volume via an increase in the magnitude of zX and thus K+ content, rather than primarily by an increase in [Na+]i as has previously been supposed: although influxes of Na+ might be expected to cause volume increase, this is not necessarily the case as Na+,K+-ATPase activity is significantly increased by increases in [Na+]i (Therien & Blostein, 2000). For example, inhibition of background Na+–K+–2Cl− cotransport in skeletal muscle does not influence cellular volume, despite the reduction in Na+ influx that might be expected following such inhibition (Gosmanov et al. 2003b; Fraser & Huang, 2004).
This study therefore supports the hypothesis that the osmotic activity of intracellular membrane-impermeant osmolytes (X−i) and the mean charge valency of X−i (zX) are central in the determination of resting cell volume, particularly in excitable cells. The relationship described here between intracellular pH and cell volume in skeletal muscle may have important implications for both cellular volume regulation and for K+ homeostasis in the whole organism.
Acknowledgments
We thank Paul Frost, Victoria Johnson and Jon Holdich for generous and skilled assistance. C.L.H.H. thanks the Medical Research Council for project (G9900365 and G0100188) and Co-operative Group Grants (G9900182 and G01001986, respectively), and the Wellcome Trust Joint Research Equipment Initiative (JREI: 055203/Z/98/Z/ST/RC) for equipment funding support. C.L.H.H. also thanks the Leverhulme Trust and the British Heart Foundation. J.A.F. holds a George Henry Lewes Studentship. J.A.U.-S. holds a Merck, Sharpe and Dohme Studentship and acknowledges additional support from the James Baird Fund. C.E.M. thanks the Physiological Society for a vacation research studentship. We thank Professor Roger C. Thomas for invaluable advice in some of the experiments and for helpful discussions.
Appendix
Modifications to the charge-difference model of Fraser & Huang (2004)
The charge-difference model described by Fraser & Huang (2004) was modified to permit an analysis of the influence of transmembrane NH4+ and NH3 fluxes and the resultant pHi changes upon cell volume (Vc) and membrane potential (Em). The additional equations are numbered below according to the order in which they were calculated during each iteration of the model. Equations numbered with whole numbers replace the same-numbered equation in Fraser & Huang (2004), whereas those numbered with decimals were inserted in the iteration sequence. Thus each iteration calculated the equations in the order (bold type denotes a new equation): A1, 2, A2.1, A2.2, A2.3, A2.4, A2.5, A2.6, A2.7, A2.8, A2.9, 3, A4.1, A4.2, A4.3, A5, and the next iteration started from A1 again.
J denotes a transmembrane flux, δ is used to denote changes in intracellular concentration other than those caused by transmembrane fluxes, [N] denotes [NH4+]+[NH3] and [H+]i(free) denotes unbuffered H+. Extracellular pH was set at 7.1, as for the experimental conditions, and extracellular NH4+ and NH3 concentrations ([NH4+]e and [NH3]e, respectively) were calculated from their equilibrium constant (thus [NH3]e= ([N]eKa(NH4))/([H+]e+Ka(NH4)), and so [NH4+]e=[N]e−[NH3]e). The basic constants used were as described in Fraser & Huang (2004). Additional constants are given in Table 3.
 |
(A1) |
The passive fluxes per unit area of membrane of NH4+, JNH4, and H+ flux, JH were calculated as for any other charged species (equation 2 in Fraser & Huang, 2004). The passive NH3 flux per unit area was given by:
| (A2.1) |
Table 3.
Parameters used in the modified Fraser & Huang (2004) model
| Parameter | Symbol | Value | Refs. (see legend) |
|---|---|---|---|
| Membrane NH4+ permeability | PNH4 | 2.8 × 10⁻⁹ cm s−1 | 1 |
| Membrane NH3 permeability | PNH3 | 1.0 × 10⁻⁵ cm s−1 | 2 |
| Membrane H+ permeability | PH | 4.0 × 10⁻⁵ cm s−1 | 3 |
| Membrane H2O permeability | PH2O | 1.56 × 10⁻⁴ cm s−1 | 4 |
| (Thus, ratio PK: PNH4: PNH3: PH: PH2O) | 1: 0.07:250: 1000: 3,900 | ||
| Relative NHE 'permeability' | PNHE | 50 000 | 5 |
| Equilibrium constant of buffer A | pKa(A) | 6.03 | 6 |
| Equilibrium constant of buffer B | pKa(B) | 7.57 | 7 |
See Fraser & Huang (2004) for other basic parameters. The parameters used here reflect normal physiological values for amphibian skeletal muscle, except for PNHE which was chosen to give pHi= 7.25 under control conditions. 1Derived from present experimental data given PK= 4 × 10⁻⁸ cm s−1 (Adrian, 1956); 2Boron & De Weer (1976); 3Decoursey (2003); 4Frigeri et al. (2004); 5chosen to give pHi= 7.25 under baseline conditions; 6, 7Leem et al. (1999).
In addition, Na+, H+ exchanger (NHE) activity was modelled in a similar fashion to the cation–Cl− cotransporters modelled by Fraser & Huang (2004). NHE activity proved critical for cellular stability as it was necessary to offset the passive inward leakage of H+ ions. However, although its activity is sharply pHi dependent in vivo (Slepkov & Fliegel, 2002), such dependence was not modelled in the present study as it proved unnecessary for stable values of pHi to be attained and subsequently maintained. Instead, it was assigned a range of ‘permeability’ values, PNHE, expressed relative to the membrane K+ permeability, PK, and its activity was then determined solely by its thermodynamics and expressed as JNHE. This permitted an investigation of the possible contribution of the NHE over a range of activities.
| (A2.2) |
Preliminary experiments showed that the highest pHi attainable through the action of this transporter with pHe= 7.1 was approximately 7.95 for any value of PNHE≥ 107, whereas pHi at the point of stability of the model in the absence of NHE activity was 5.63, demonstrating the critical nature of this membrane transport process for normal cellular function. The experimental pHi values of ∼7.25 could be reproduced with PNHE= 50 000 and therefore this was the value chosen for the simulations.
The fluxes were then multiplied by the membrane area per unit volume (Am) to give fluxes per unit volume. Next, the equilibration reaction [NH3]i+[H+]i (free)⇌[NH4+]i was modelled according to resultant calculated intracellular concentrations of each species and the current pHi, given Ka(NH4)= 5.688 × 10⁻¹⁰ at 25°C. This equilibration was assumed to occur at a sufficient rate compared to transmembrane ion fluxes that the equilibrium condition held at all times, thus:
| (A2.3) |
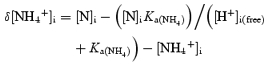 |
(A2.4) |
The resultant change in total intracellular H+ concentration (Δ[H+]i(total)) was then calculated:
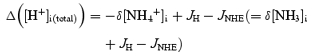 |
(A2.5) |
This change in total intracellular H+ was then considered to increase both the concentration of intracellularly buffered H+ ([H+]i(buff)) and free intracellular H+ ([H+]i(free)) according to the intracellular buffering capacity, βi, which was influenced by the prevailing intracellular pH (=−log[H+]i (free)) as shown in the following equation (Leem et al. 1999):
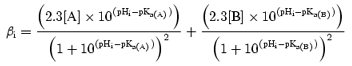 |
(A2.6) |
Thus the intracellular buffering capacity was modelled as two populations of buffer denoted A and B, where 3/10ths of the total charge carried by X−i (zX×[X−]i) was treated as buffer population A with a pKa of 6.03, and 6/10ths of the total charge carried by X−i was treated as population B, with a pKa of 7.57. The remaining 1/10th of the charge carried by X−i was not considered to act as a significant buffer. Although this formulation of Leem et al. (1999) was derived for guinea pig cardiac myocytes, it gave a value of βi at physiological pHi of 44 Slykes, within the range suggested by the present experimental results, and therefore seemed a suitable approximation for the present purposes. Then, from the definition of βi as mm H+/pH unit:
| (A2.7) |
Then:
| (A2.8) |
The buffering of H+ by membrane-impermeant anions (X−i) within the cell then changes their mean charge valency, zX, such that:
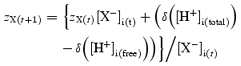 |
(A2.9) |
Finally, the handling of transmembrane water fluxes by the model was modified in order to model the effects of step changes in extracellular osmolarity, ![]() . Previously, the model simply made the assumption that membrane water permeability greatly exceeded ion permeabilities, and therefore ion movements were assumed to be accompanied by sufficient water to maintain equal intracellular and extracellular osmolarities. However, in order to model step changes in extracellular osmolarity, it was necessary to model transmembrane water fluxes explicitly. Thus a permeability term was introduced for H2O (PH2O) and transmembrane water movements were then modelled as for any other uncharged molecule. The equations described below replaced eqn (5) in Fraser & Huang (2004), and were calculated in the order that they are presented here.
. Previously, the model simply made the assumption that membrane water permeability greatly exceeded ion permeabilities, and therefore ion movements were assumed to be accompanied by sufficient water to maintain equal intracellular and extracellular osmolarities. However, in order to model step changes in extracellular osmolarity, it was necessary to model transmembrane water fluxes explicitly. Thus a permeability term was introduced for H2O (PH2O) and transmembrane water movements were then modelled as for any other uncharged molecule. The equations described below replaced eqn (5) in Fraser & Huang (2004), and were calculated in the order that they are presented here.
The concentration of H2O in pure water was taken as 55.55 m, and the osmotic coefficient of each ion was assumed to be unity. Therefore the extracellular and intracellular H2O concentrations ([H2O]e and [H2O]i, respectively) were given by:
| (A4.1) |
| (A4.2) |
![]() denotes total extracellular osmolarity, and was thus simply the sum of the concentrations of the extracellular ions. Thus at the end of each iteration cycle, inward water flux, JH2O was calculated:
denotes total extracellular osmolarity, and was thus simply the sum of the concentrations of the extracellular ions. Thus at the end of each iteration cycle, inward water flux, JH2O was calculated:
| (A4.3) |
Intracellular water was then assumed to occupy precisely the same volume per mole as in pure water, and therefore the change in cell volume, ΔVc, after each iteration was simply:
| (A5) |
References
- Abe H. Role of histidine-related compounds as intracellular proton buffering constituents in vertebrate muscle. Biochemistry (Mosc) 2000;65:757–765. [PubMed] [Google Scholar]
- Adrian RH. The effect of internal and external potassium concentration on the membrane potential of frog muscle. J Physiol. 1956;133:631–658. doi: 10.1113/jphysiol.1956.sp005615. [DOI] [PMC free article] [PubMed] [Google Scholar]
- Aickin CC. Intracellular pH regulation by vertebrate muscle. Annu Rev Physiol. 1986;48:349–361. doi: 10.1146/annurev.ph.48.030186.002025. 10.1146/annurev.ph.48.030186.002025. [DOI] [PubMed] [Google Scholar]
- Aickin CC, Thomas RC. Intracellular pH of mouse soleus muscle (abstract) J Physiol. 1976;260:25P–26P. [PMC free article] [PubMed] [Google Scholar]
- Aickin CC, Thomas RC. An investigation of the ionic mechanism of intracellular pH regulation in mouse soleus muscle fibres. J Physiol. 1977;273:295–316. doi: 10.1113/jphysiol.1977.sp012095. [DOI] [PMC free article] [PubMed] [Google Scholar]
- Blinks JR. Influence of osmotic strength on cross-section and volume of isolated single muscle fibres. J Physiol. 1965;177:42–57. doi: 10.1113/jphysiol.1965.sp007574. [DOI] [PMC free article] [PubMed] [Google Scholar]
- Boron WF, De Weer P. Intracellular pH transients in squid giant axons caused by CO2, NH3, and metabolic inhibitors. J General Physiol. 1976;67:91–112. doi: 10.1085/jgp.67.1.91. [DOI] [PMC free article] [PubMed] [Google Scholar]
- Curtin NA. Intracellular pH and buffer power of type 1 and 2 fibres from skeletal muscle of Xenopus laevis. Pflugers Arch. 1987;408:386–389. doi: 10.1007/BF00581133. [DOI] [PubMed] [Google Scholar]
- Decoursey TE. Voltage-gated proton channels and other proton transfer pathways. Physiol Rev. 2003;83:475–579. doi: 10.1152/physrev.00028.2002. [DOI] [PubMed] [Google Scholar]
- Drewnowska K, Baumgarten CM. Regulation of cellular volume in rabbit ventricular myocytes: bumetanide, chlorothiazide, and ouabain. Am J Physiol. 1991;260:C122–C131. doi: 10.1152/ajpcell.1991.260.1.C122. [DOI] [PubMed] [Google Scholar]
- Ferenczi EA, Fraser JA, Chawla S, Skepper JN, Schwiening CJ, Huang CL. Membrane potential stabilization in amphibian skeletal muscle fibres in hypertonic solutions. J Physiol. 2004;555:423–438. doi: 10.1113/jphysiol.2003.058545. 10.1113/jphysiol.2003.058545. [DOI] [PMC free article] [PubMed] [Google Scholar]
- Fraser JA, Huang CL. A quantitative analysis of cell volume and resting potential determination and regulation in excitable cells. J Physiol. 2004;559:459–478. doi: 10.1113/jphysiol.2004.065706. 10.1113/jphysiol.2004.065706. [DOI] [PMC free article] [PubMed] [Google Scholar]
- Gallagher FA, Huang CL. Osmotic ‘detubulation’ in frog muscle arises from a reversible vacuolation process. J Muscle Res Cell Motil. 1997;18:305–321. doi: 10.1023/a:1018670025321. 10.1023/A:1018670025321. [DOI] [PubMed] [Google Scholar]
- Geukes Foppen RJ. In skeletal muscle the relaxation of the resting membrane potential induced by K+ permeability changes is dependent on Cl− transport. Pflugers Arch. 2004;447:416–425. doi: 10.1007/s00424-003-1165-1. 10.1007/s00424-003-1165-1. [DOI] [PubMed] [Google Scholar]
- Geukes Foppen RJ, Van Mil HGJ, Van Heukelom JS. Effects of chloride transport on bistable behaviour of the membrane potential in mouse skeletal muscle. J Physiol. 2002;542:181–191. doi: 10.1113/jphysiol.2001.013298. 10.1113/jphysiol.2001.013298. [DOI] [PMC free article] [PubMed] [Google Scholar]
- Gosmanov AR, Lindinger MI, Thomason DB. Riding the tides: K+ concentration and volume regulation by muscle Na+-K+-2Cl− cotransport activity. News Physiol Sci. 2003a;18:196–200. doi: 10.1152/nips.01446.2003. [DOI] [PubMed] [Google Scholar]
- Gosmanov AR, Schneider EG, Thomason DB. NKCC activity restores muscle water during hyperosmotic challenge independent of insulin, ERK, and p38 MAPK. Am J Physiol. 2003b;284:R655–R665. doi: 10.1152/ajpregu.00576.2002. [DOI] [PubMed] [Google Scholar]
- Hagiwara S, Takahashi K. The anomalous rectification and cation selectivity of the membrane of a starfish egg cell. J Membr Biol. 1974;18:61–80. doi: 10.1007/BF01870103. [DOI] [PubMed] [Google Scholar]
- Harris RC, Marlin DJ, Dunnett M, Snow DH, Hultman E. Muscle buffering capacity and dipeptide content in the thoroughbred horse, greyhound dog and man. Comp Biochem Physiol A. 1990;97:249–251. doi: 10.1016/0300-9629(90)90180-z. 10.1016/0300-9629(90)90180-Z. [DOI] [PubMed] [Google Scholar]
- Hille B. Potassium channels in myelinated nerve. Selective permeability to small cations. J General Physiol. 1973;61:669–686. doi: 10.1085/jgp.61.6.669. 10.1085/jgp.61.6.669. [DOI] [PMC free article] [PubMed] [Google Scholar]
- Hodgkin AL, Horowicz P. The influence of potassium and chloride ions on the membrane potential of single muscle fibres. J Physiol. 1959;148:127–160. doi: 10.1113/jphysiol.1959.sp006278. [DOI] [PMC free article] [PubMed] [Google Scholar]
- Hoffmann EK, Simonsen LO. Membrane mechanisms in volume and pH regulation in vertebrate cells. Physiol Rev. 1989;69:315–382. doi: 10.1152/physrev.1989.69.2.315. [DOI] [PubMed] [Google Scholar]
- Jackson PS, Strange K. Volume-sensitive anion channels mediate swelling-activated inositol and taurine efflux. Am J Physiol. 1993;265:C1489–C1500. doi: 10.1152/ajpcell.1993.265.6.C1489. [DOI] [PubMed] [Google Scholar]
- Jakab M, Fuerst J, Gschwentner M, Botta G, Garavaglia ML, Bazzini C, Rodighiero S, Meyer G, Eichmueller S, Woell E, Chwatal S, Ritter M, Paulmichl M. Mechanisms sensing and modulating signals arising from cell swelling. Cell Physiol Biochem. 2002;12:235–258. doi: 10.1159/000067895. 10.1159/000067895. [DOI] [PubMed] [Google Scholar]
- Kowalchuk JM, Heigenhauser GJ, Lindinger MI, Sutton JR, Jones NL. Factors influencing hydrogen ion concentration in muscle after intense exercise. J Appl Physiol. 1988;65:2080–2089. doi: 10.1152/jappl.1988.65.5.2080. [DOI] [PubMed] [Google Scholar]
- Krause U, Wegener G. Exercise and recovery in frog muscle: metabolism of PCr, adenine nucleotides, and related compounds. Am J Physiol. 1996;270:R811–R820. doi: 10.1152/ajpregu.1996.270.4.R811. [DOI] [PubMed] [Google Scholar]
- Lang F, Busch GL, Ritter M, Volkl H, Waldegger S, Gulbins E, Haussinger D. Functional significance of cell volume regulatory mechanisms. Physiol Rev. 1998a;78:247–306. doi: 10.1152/physrev.1998.78.1.247. [DOI] [PubMed] [Google Scholar]
- Lang F, Busch GL, Volkl H. The diversity of volume regulatory mechanisms. Cell Physiol Biochem. 1998b;8:1–45. doi: 10.1159/000016269. 10.1159/000016269. [DOI] [PubMed] [Google Scholar]
- Lauf PK. Kinetic comparison of ouabain-resistant K:Cl fluxes (K:Cl [Co]-transport) stimulated in sheep erythrocytes by membrane thiol oxidation and alkylation. Mol Cell Biochem. 1988;82:97–106. doi: 10.1007/BF00242523. [DOI] [PubMed] [Google Scholar]
- Lauf PK, Adragna NC. K-Cl cotransport: properties and molecular mechanism. Cell Physiol Biochem. 2000;10:341–354. doi: 10.1159/000016357. 10.1159/000016357. [DOI] [PubMed] [Google Scholar]
- Leem CH, Lagadic-Gossmann D, Vaughan-Jones RD. Characterization of intracellular pH regulation in the guinea-pig ventricular myocyte. J Physiol. 1999;517:159–180. doi: 10.1111/j.1469-7793.1999.0159z.x. 10.1111/j.1469-7793.1999.0159z.x. [DOI] [PMC free article] [PubMed] [Google Scholar]
- Maughan DW, Godt RE. Protein osmotic pressure and the state of water in frog myoplasm. Biophys J. 2001;80:435–442. doi: 10.1016/S0006-3495(01)76026-2. [DOI] [PMC free article] [PubMed] [Google Scholar]
- Maughan D, Recchia C. Diffusible sodium, potassium, magnesium, calcium and phosphorus in frog skeletal muscle. J Physiol. 1985;368:545–563. doi: 10.1113/jphysiol.1985.sp015875. [DOI] [PMC free article] [PubMed] [Google Scholar]
- McDonough AA, Thompson CB, Youn JH. Skeletal muscle regulates extracellular potassium. Am J Physiol Renal Physiol. 2002;282:F967–F974. doi: 10.1152/ajprenal.00360.2001. [DOI] [PubMed] [Google Scholar]
- Nakajima S, Nakajima Y, Peachey LD. Speed of repolarization and morphology of glycerol-treated muscle fibres. J Physiol. 1969;200:115P–116P. [PubMed] [Google Scholar]
- Nakajima S, Nakajima Y, Peachey LD. Speed of repolarization and morphology of glycerol-treated frog muscle fibres. J Physiol. 1973;234:465–480. doi: 10.1113/jphysiol.1973.sp010355. [DOI] [PMC free article] [PubMed] [Google Scholar]
- Nilius B, Eggermont J, Voets T, Droogmans G. Volume-activated Cl− channels. General Pharmacol. 1996;27:1131–1140. doi: 10.1016/s0306-3623(96)00061-4. 10.1016/S0306-3623(96)00061-4. [DOI] [PubMed] [Google Scholar]
- Pasantes-Morales H, Franco R, Torres-Marquez ME, Hernandez-Fonseca K, Ortega A. Amino acid osmolytes in regulatory volume decrease and isovolumetric regulation in brain cells: contribution and mechanisms. Cell Physiol Biochem. 2000;10:361–370. doi: 10.1159/000016369. 10.1159/000016369. [DOI] [PubMed] [Google Scholar]
- Pena-Rasgado C, Pierce SK, Rasgado-Flores H. Osmolytes responsible for volume reduction under isosmotic or hypoosmotic conditions in barnacle muscle cells. Cell Mol Biol. 2001;47:841–853. [PubMed] [Google Scholar]
- Perez GO, Oster JR, Vaamonde CA. Serum potassium concentration in acidemic states. Nephron. 1981;27:233–243. doi: 10.1159/000182061. [DOI] [PubMed] [Google Scholar]
- Putnam RW, Roos A, Wilding TJ. Properties of the intracellular pH-regulating systems of frog skeletal muscle. J Physiol. 1986;381:205–219. doi: 10.1113/jphysiol.1986.sp016323. [DOI] [PMC free article] [PubMed] [Google Scholar]
- Rasmusson RL, Davis DG, Lieberman M. Amino acid loss during volume regulatory decrease in cultured chick heart cells. Am J Physiol. 1993;264:C136–C145. doi: 10.1152/ajpcell.1993.264.1.C136. [DOI] [PubMed] [Google Scholar]
- Reuter H, Stevens CF. Ion conductance and ion selectivity of potassium channels in snail neurons. J Membr Biol. 1980;57:103–118. doi: 10.1007/BF01868997. [DOI] [PubMed] [Google Scholar]
- Schultz SG, Curran PF. Coupled transport of sodium and organic solutes. Physiol Rev. 1970;50:637–718. doi: 10.1152/physrev.1970.50.4.637. [DOI] [PubMed] [Google Scholar]
- Sjogaard G, Adams RP, Saltin B. Water and ion shifts in skeletal muscle of humans with intense dynamic knee extension. Am J Physiol. 1985;248:R190–R196. doi: 10.1152/ajpregu.1985.248.2.R190. [DOI] [PubMed] [Google Scholar]
- Slepkov E, Fliegel L. Structure and function of the NH# isoform of the Na+/H+ exchanger. Biochem Cell Biol. 2002;80:499–508. doi: 10.1139/o02-151. 10.1139/o02-151. [DOI] [PubMed] [Google Scholar]
- Spurway NC. Mechanisms of anion permeation. A review of available data, principally on muscle cells, with the fixed charge concept in mind. Biomembranes. 1972;3:363–380. [PubMed] [Google Scholar]
- Strange K, Emma F, Jackson PS. Cellular and molecular physiology of volume-sensitive anion channels. Am J Physiol. 1996;270:C711–C730. doi: 10.1152/ajpcell.1996.270.3.C711. [DOI] [PubMed] [Google Scholar]
- Sullivan MJ, Saltin B, Negro-Vilar R, Duscha BD, Charles HC. Skeletal muscle pH assessed by biochemical and 31P-MRS methods during exercise and recovery in men. J Appl Physiol. 1994;77:2194–2200. doi: 10.1152/jappl.1994.77.5.2194. [DOI] [PubMed] [Google Scholar]
- Suput D. Effect of external ammonium on the kinetics of the sodium current in frog muscle. Biochim Biophys Acta. 1984;771:1–8. doi: 10.1016/0005-2736(84)90102-0. [DOI] [PubMed] [Google Scholar]
- Therien AG, Blostein R. Mechanisms of sodium pump regulation. Am J Physiol Cell Physiol. 2000;279:C541–C566. doi: 10.1152/ajpcell.2000.279.3.C541. [DOI] [PubMed] [Google Scholar]
- Thomas RC. The effects of HCl and CaCl2 injections on intracellular calcium and pH in voltage-clamped snail (Helix aspersa) neurons. J General Physiol. 2002;120:567–579. doi: 10.1085/jgp.20028665. 10.1085/jgp.20028665. [DOI] [PMC free article] [PubMed] [Google Scholar]
- Van Emst M, Klarenbeek S, Schot A, Plomp J, Doornenbal A, Everts M. Reducing chloride conductance prevents hyperkalemia-induced loss of twitch force in rat slow-twitch muscle. J Physiol. 2004;561:169–181. doi: 10.1113/jphysiol.2004.071498. 10.1113/jphysiol.2004.071498. [DOI] [PMC free article] [PubMed] [Google Scholar]
- Vaughan-Jones RD, Wu ML. pH dependence of intrinsic H+ buffering power in the sheep cardiac Purkinje fibre. J Physiol. 1990;425:429–448. doi: 10.1113/jphysiol.1990.sp018112. [DOI] [PMC free article] [PubMed] [Google Scholar]
- Waddell WJ, Bates RG. Intracellular pH. Physiol Rev. 1969;49:285–329. doi: 10.1152/physrev.1969.49.2.285. [DOI] [PubMed] [Google Scholar]
- Wakabayashi S, Shigekawa M, Pouyssegur J. Molecular physiology of vertebrate Na+/H+ exchangers. Physiol Rev. 1997;77:51–74. doi: 10.1152/physrev.1997.77.1.51. [DOI] [PubMed] [Google Scholar]