Abstract
Recent investigations of high-throughput genomic and phenomic data have uncovered a variety of significant but relatively weak correlations between a gene’s functional and evolutionary characteristics. In particular, essential genes and genes with paralogs have a slight propensity to evolve more slowly than nonessential genes and singletons, respectively. However, given the weakness and multiplicity of these associations, their biological relevance remains uncertain. Here, we show that existence of an essential paralog can be used as a specific and strong gauge of selection. We partition gene families in several genomes into two classes: those that include at least one essential gene (E-families) and those without essential genes (N-families). We find that weaker purifying selection causes N-families to evolve in a more dynamic regime with higher rates both of duplicate fixation and pseudogenization. Because genes in E-families are subject to significantly stronger purifying selection than those in N-families, they survive longer and exhibit greater sequence divergence. Longer average survival time also allows for divergence of upstream regulatory regions, resulting in change of transcriptional context among paralogs in E-families. These findings are compatible with differential division of ancestral functions (subfunctionalization) or emergence of novel functions (neofunctionalization) being the prevalent modes of evolution of paralogs in E-families as opposed to pseudogenization (nonfunctionalization), which is the typical fate of paralogs in N-families. Unlike other characteristics of genes, such as essentiality, existence of paralogs, or expression level, membership in an E-family or an N-family strongly correlates with the level of selection and appears to be a major determinant of a gene’s evolutionary fate.
The nature of connections between organismal and molecular evolution remains a fundamental and, generally, unanswered question. The relationship between evolution of a gene and the organism can be characterized by the change in fitness precipitated by deletion or mutation of that gene (Drake et al. 1998; Keightley and Eyre-Walker 1999). Although this is a simple definition, quantifying the fitness effect of gene deletions or mutations remains a hard problem. One of the principal difficulties is that changes deleterious under some conditions might be neutral or beneficial under other conditions (Macarthur and Levins 1964; Levins 1968). As a result, the notions of fitness and essentiality are inherently ambiguous.
Driven by the recent availability of many complete genome sequences, along with results from genome-wide functional assays, many researchers observed significant correlations between functional characteristics of genes, such as essentiality (Hurst and Smith 1999; Hirsh and Fraser 2001; Yang et al. 2003), number of protein-interaction partners (Fraser et al. 2002), or expression level (Pal et al. 2001), and the rate of evolution (equivalently the strength of purifying selection). However, all reported correlations are relatively weak, and the contribution of each characteristic remains a subject of vigorous debate (Jordan et al. 2003; Wall et al. 2005; Drummond et al. 2006). In particular, the validity of the observed negative correlation between a gene’s knockout effect (essentiality) and evolutionary rate, originally predicted by Kimura and Ohta (Kimura 1981) as a corollary of the neutral theory of molecular evolution, remains an open question. There is substantial disagreement about whether this correlation is an artifact caused by transitive relationships with expression level (Pal et al. 2001) or abundance (Drummond et al. 2005). Although recent, more sophisticated statistical analyses by three independent groups suggest that correlation between a gene’s knockout effect and purifying selection does exist; these studies have also shown that this correlation is probably quite weak (Drummond et al. 2005; He and Zhang 2005; Wall et al. 2005). Most importantly, the observed correlations have taught us little about evolutionary dynamics governing gene duplication and divergence.
Gene duplication followed by divergence is one of the primary driving forces behind functional innovation during evolution (Ohno 1970; Lynch and Katju 2004). Currently, the divergence of two paralogs after duplication is thought to follow one of three routes. The most common outcome of a duplication event is nonfunctionalization when one copy first becomes a pseudogene and, eventually, goes extinct (Nei and Roychoudhoury 1973; Petrov and Hartl 2000), whereas the second copy retains the original function. The other, less common but nonetheless crucial evolutionary scenarios are neofunctionalization and subfunctionalization. In the case of neofunctionalization, one paralog retains the original function, whereas the other one evolves a new function during a phase of rapid, nearly neutral evolution (Ohno 1970). Under the subfunctionalization model, multiple functions of the ancestral gene are divided between paralogs, both of which evolve under purifying selection (Force et al. 1999; Lynch and Force 2000; He and Zhang 2005). Given sufficiently detailed information, the probability that functional divergence has occurred after a speciation event can be estimated using statistical models of sequence evolution (Gu 1999, 2001a, b). However, in general, the relationship between selection and neofunctionalization is not well understood. For example, although paralogs experience a period of relaxed purifying selection immediately after duplication, genes with paralogs show greater evolutionary conservation than singletons (Davis and Petrov 2004; Jordan et al. 2004). This rather unexpected finding has been taken to indicate that, on average, duplications of genes with critical biological functions are retained more often than duplications of less biologically important genes.
The goal of the present study is to elucidate some general relationships between functional constraints, differential strengths of purifying selection, and gene duplication. First, we observe that membership in a gene family is a good predictor of selection. For example, genes that have an essential paralog are under stronger selection than genes without essential paralogs. We show that families of paralogs that include at least one essential gene (E-families) and those that consist entirely of nonessential genes (N-families) evolve in dramatically different regimens. Although genes in E-families, on average, evolve substantially more slowly than genes in N-families, the E-families show a much greater divergence between paralogs. This can be attributed to the significantly longer average survival time of paralogs in E-families as compared to N-families. The E-families appear to comprise a reservoir of genes for evolution of new functions via the subfunctionalization and neofunctionalization routes. Finally, we show that there is a relationship between evolution of the open reading frames and upstream regions. Specifically, genes in E-families that are under stronger selection evolve novel transcriptional regulatory contexts.
Results
Homogeneity in strength of selection within paralogous families
While essential genes tend to evolve slowly and, by implication, appear to be under stronger purifying selection than nonessential ones (Hirsh and Fraser 2001; Jordan et al. 2002), this trend is relatively weak. Furthermore, some published reports suggest that the negative correlation between selection and essentiality might be true only for essential genes that have paralogs (Yang et al. 2003). Since an independent line of analysis has indicated that genes with paralogs, on average, evolve more slowly than singletons (Davis and Petrov 2004; Jordan et al. 2004), the nature of the relationships between these three variables—the gene’s essentiality, existence of paralogs, and the rate of evolution—remains unclear. We sought to explore whether essentiality or paralogy is necessary and sufficient as a primary determinant of purifying selection. To this end, we need to compare the strength of selection between essential and nonessential members of the same gene family.
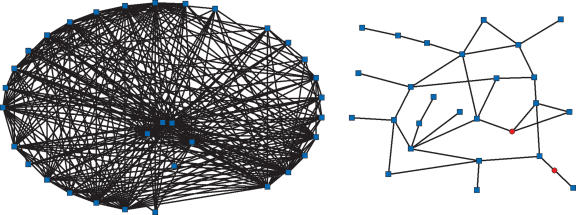
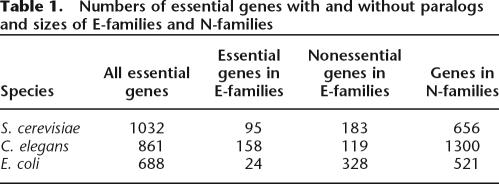
Paralogy relationships between genes within genomes can be conveniently represented in the most general form as a Divergence and Diffusion Graph (DDG). The vertices represent genes, and edges represent homology relationships weighed according to their sequence similarity scores (Fig. 1; see Supplemental material). All genes can be partitioned into paralogous families (Harrison and Gerstein 2002; Enright et al. 2003) by finding strongly connected components of the DDG, that is, sets of vertices in which a path exists between each pair (see Supplemental material). Partitioning paralogous families (strongly connected components of the DDG) into two classes—those that include at least one essential gene (E-families) and those with no essential members (N-families)—allows us to compare essential and nonessential members of the same family (see Methods). For each species where genome-wide data on gene essentiality were available, the E-family and N-family sets included substantial numbers of genes (Table 1), providing for the statistical comparison of evolutionary characteristics between essential and nonessential genes within E-families as well as comparisons between the sets of genes in E-families and N-families.
Figure 1.
The largest E- and N-gene families in yeast. The family on the left contains no essential genes (N-family), and the family on the right includes two essential members (E-family). The red circles represent essential genes, and the blue squares represent nonessential genes. The E-family represented here consists of various mitochondrial membrane transporters, and the N-family includes seripauperins (poorly characterized multigene family represented, primarily, in subtelomeric regions of yeast chromosomes).
Table 1.
Numbers of essential genes with and without paralogs and sizes of E-families and N-families
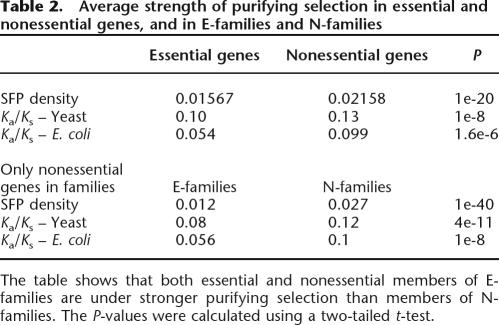
For example, partitioning paralogous gene sets into E-families and N-families can be used to test whether essentiality is a major determinant of selection. If the strength of selection is a characteristic of gene family membership as opposed to essentiality, we predict that all genes in E-families, including nonessential ones, would be subject to significantly stronger purifying selection than members of N-families. We assessed the strength of purifying selection by several standard measures: single feature polymorphism (SFP) densities in Saccharomyces cerevisiae genes (Winzeler et al. 2003), Ka/Ks ratios between S. cerevisiae–Saccharomyces paradoxus orthologs and Escherichia coli K12/CFT073 orthologs. The genes that are under stronger purifying selection are expected to have lower SFP densities and lower Ka/Ks ratios (Nei 1987).
We found that both essential and nonessential members of E-families are under substantially stronger purifying selection than members of N-families, independent of the species analyzed and the method used to estimate selection (Table 2). Furthermore, by all employed criteria, the difference in the strength of selection between nonessential genes in E-families and N-families was considerably more significant than the difference between all essential and nonessential genes in the same species (Table 2). Thus, it seems that strength of selection is a more salient characteristic of gene family membership than essentiality. Moreover, the data in Table 2 suggest that essentiality per se is neither necessary nor sufficient to impose purifying selection. Instead, given that E-families do not exhibit significant biases in characteristics that might be responsible for transitive correlations with the strength of selection, such as Codon Adaptation Index or protein abundance (Hahn and Kern 2005; Supplemental Table S4), we conclude that existence of an essential paralog may be used as a specific marker of genes subject to strong purifying selection. We found no systematic differences in protein functions between E-families and N-families; the two classes of families showed comparable functional diversity, although the E-families included a greater fraction of molecular chaperones and proteins with related functions, whereas the N-families were enriched in metabolic enzymes and transporters (for annotated lists of E-family and N-family membership, see the Supplemental material).
Table 2.
Average strength of purifying selection in essential and nonessential genes, and in E-families and N-families
The table shows that both essential and nonessential members of E-families are under stronger purifying selection than members of N-families. The P-values were calculated using a two-tailed t-test.
Selection and dynamics of duplications and divergence
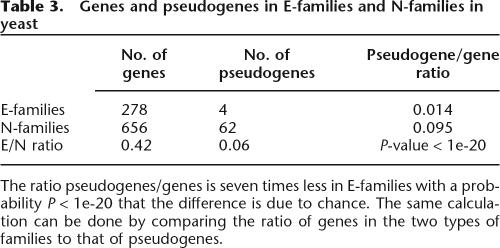
The implication of the observation above is that there are sets of genes related by evolution that may share characteristics that impose selection. We recently showed (Shakhnovich 2006) that strength of selection correlates with the probability of pseudogenization in M. leprae. Since we have already observed that E-families and N-families evolve under different strengths of purifying selection, we hypothesized that they might also exhibit different pseudogenization and duplication rates. Identification of all pseudogenes (Harrison et al. 2001, 2002; Harrison and Gerstein 2002) derived from E-families and N-families in S. cerevisiae showed that the estimated pseudogenization rate in E-families was approximately seven times lower than that in N-families. Although this might not be a high-precision estimate because of the small number of pseudogenes in E-families, the difference in the pseudogenization rates was highly statistically significant (Table 3).
Table 3.
Genes and pseudogenes in E-families and N-families in yeast
The ratio pseudogenes/genes is seven times less in E-families with a probability P < 1e-20 that the difference is due to chance. The same calculation can be done by comparing the ratio of genes in the two types of families to that of pseudogenes.
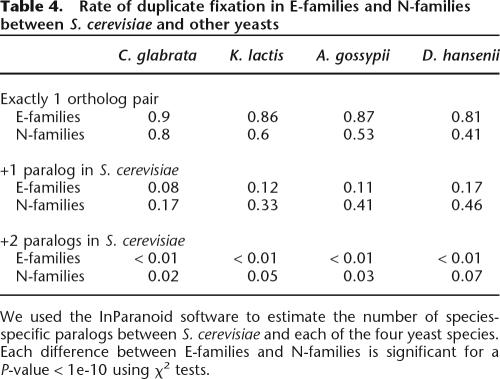
The larger total number of paralogs (Table 1) in N-families, coupled with the observation of a higher pseudogenization rate, suggests that recent duplicates from N-families should also enjoy a higher duplication rate. To test this prediction, we identified pairs of orthologs and lineage-specific paralogs using the InParanoid algorithm (Remm et al. 2001) for five closely related yeast species (S. cerevisiae, Candida glabrata, Kluyveromyces lactis, Aphis gossypii, and Debaryomyces hansenii). These data show the number of paralogs that have been fixed in each species since diverging from the common ancestor. For example, if a given gene had one paralog in S. cerevisiae, but its ortholog had no paralogs in C. glabrata, we can infer that a lineage-specific duplication occurred after the divergence with C. glabrata. Using this approach, we calculated the number of duplicate fixation events for all members of E-families and N-families. We found that N-families fix duplication events at a rate approximately twice that of E-families (Table 4) For example, 90% of the E-family members from S. cerevisiae had exactly one ortholog in C. glabrata, while only 80% of N-families were in that group. In agreement with this, 17% of the E-families and >46% of the N-families have fixed at least one duplicate (to produce an extra paralog) in S. cerevisiae after its divergence from the common ancestor with D. hansenii. The validity of this analysis hinges on the assumption that the duplication rate is the same for E-families and N-families. Alternatively, differences in the duplication rates might explain the observed pattern without invoking differential fixation of duplicates; however, it is hard to imagine why genes from E-families and N-families would duplicate at different rates.
Table 4.
Rate of duplicate fixation in E-families and N-families between S. cerevisiae and other yeasts
We used the InParanoid software to estimate the number of species-specific paralogs between S. cerevisiae and each of the four yeast species. Each difference between E-families and N-families is significant for a P-value < 1e-10 using χ2 tests.
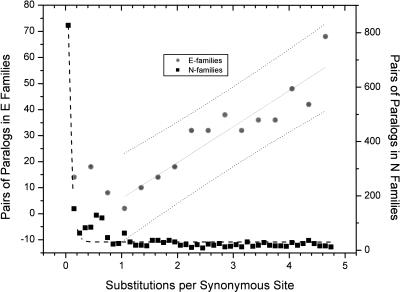
Taken together, duplication and pseudogenization data indicate that N-families evolve in a significantly more “dynamic” regime than E-families. Perhaps, because of weaker purifying selection (Table 2), members of N-families have a higher rate of both pseudogenization (Table 3) and duplicate fixation (Table 4). Of course, the two observations might not be entirely independent as a greater duplicate fixation rate might also result in a higher rate of pseudogenization. The relevant issue is the effect of this more prodigious rate of evolution on the typical fate of paralogs. Does the higher pseudogenization rate in N-families (Table 3) offset the higher duplicate fixation rate (Table 4) resulting in a shorter overall survival of both pairs of paralogs? To test this, we assume that synonymous sites are approximately neutral and evolve in a clock-like fashion. Under this assumption, the distribution of synonymous substitutions in paralogous gene families should mirror the age distribution of the paralogs.
For the N-families, the distribution of Ks shows the best fit to an exponential decay curve. This is consistent with an approximately constant probability of pseudogenization per unit time. In sharp contrast, the number of paralogs in E-families correlates linearly with the increase in synonymous site divergence (Fig. 2). The shape of the distribution in Figure 2 for E-families can be explained by a model in which the pseudogenization rate in these families drops as paralogs diverge (data not shown). Furthermore, the observed difference in the distributions of synonymous site divergence in E-families and N-families is compatible with the notion that the characteristic half-life of paralogs in E-families is much longer than that in N-families. Taking the Ks value as a measure of evolutionary time, we estimated that pairs of paralogs in E-families survive, on average, almost three times longer (mean Ks = 3.25) than paralogs in N-families (mean Ks = 0.15; P < 1e-40). Thus, it seems that the increased evolutionary dynamism results in a shift toward shorter life spans for genes in N-families.
Figure 2.
Distributions of synonymous substitution rates (Ks) for pairs of paralogs in E-familes (gray circles) and N-families (black squares). The x-axis is the Ks values and the y-axis is the number of pairs. The Ks bins are 0.3 for E-families and 0.1 for N-families. The black dashed line is the fit of the exponential decay for the paralogs from N-families (R2 = 0.96, P < 0.001). The solid gray line is the linear fit for the Ks divergence of paralogs in E-families (R2 = 0.86, P < 0.001).
Longer life span of duplicates in E-families allows greater divergence in sequence and transcriptional regulation
The observation of a longer average time of survival of duplicates in E-families carries significant implications for divergence of protein sequences in these families. In fact, visual examination of the graph representation of the largest paralogous families from S. cerevisiae immediately reveals a striking difference between the E-families and N-families (Fig. 1). Although the sizes of both families shown in Figure 1 are similar, the N-family has a much greater number of connections per node (node degree) than the former (∼10 compared to ∼1). We also observed a substantial difference between the mean clustering coefficients that characterize the density of connections between genes for the two types of families (∼0.55 for N-families compared to ∼0.21 for E-families; P < 1e-3). Both the number of connections per node and the clustering coefficient measure transitivity in sequence space, suggesting that, on average, E-family paralogs diverged farther away from each other than N-family paralogs.
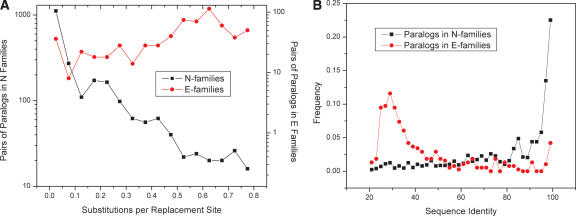
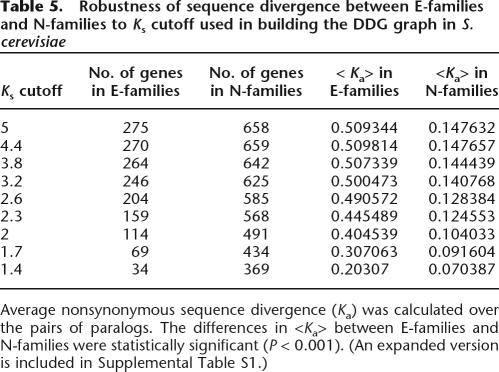
We calculated the distribution of sequence divergence between all pairs of paralogs in E-families and N-families using two standard measures of the nonsynonymous substitution rate, the number of nonsynonymous substitutions per nonsynonymous site (Ka), and amino acid sequence identity (see the Supplemental material). Indeed, by both criteria, paralogs in E-families were characterized by much greater divergence (Fig. 3A,B). For example, in S. cerevisiae, the average amino acid sequence identity between paralogs in E-families is ∼40% as compared to ∼73% for the N-families (Fig. 3B). Qualitatively similar results were observed for the E-families and N-families in E. coli and Caenorhabditis elegans (Supplemental Table S6a,b). Furthermore, this difference is not a function of the distribution of family size as shown in Supplemental Table S7a,b. Finally, nearly identical results were obtained across a broad range of cutoffs used to classify genes as paralogs (Table 5; Supplemental Table S6a,b). These results unequivocally show that, on average, paralogs from E-families are much further separated in protein sequence space than paralogs from N-families.
Figure 3.
Sequence divergence in E-families and N-families. (A) Distributions of the nonsynonymous substitution rates (Ka) for pairs of paralogs in N-families (black squares) and E-families (red circles). The mean Ka values are ∼0.5 for E-families and ∼0.14 for N-families (P < 1e-50). (B) Distributions of sequence identity for pairs of paralogs in E-families (red circles) and N-families (black squares). The mean sequence identity was ∼40% for pairs of paralogs in E-families and ∼73% for pairs of paralogs in N-families (P < 1e-40).
Table 5.
Robustness of sequence divergence between E-families and N-families to Ks cutoff used in building the DDG graph in S. cerevisiae
Average nonsynonymous sequence divergence (Ka) was calculated over the pairs of paralogs. The differences in <Ka> between E-families and N-families were statistically significant (P < 0.001). (An expanded version is included in Supplemental Table S1.)
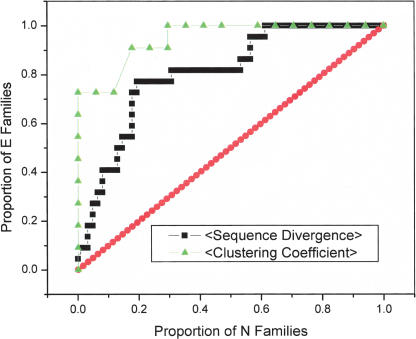
In fact, the difference in sequence divergence distributions was large enough that we wanted to assess its predictive value for differentiating between E-families and N-families in the absence of essentiality data. We performed a reciprocal analysis, that is, examined how well characteristics of sequence divergence would differentiate between E-families and N-families. To this end, we used Receiver Operating Characteristic (ROC) statistics based on the average separation of paralogs in families to classify genes into E-families and N-families without explicitly invoking essentiality as a marker. The ROC curve in Figure 4 shows that ∼80% of E-families have paralogs that are as far diverged as ∼20% of N-families. An even better separation of E-families and N-families can be obtained by using the clustering coefficient as the classification criterion: up to 73% of E-families were captured without a single false positive (N-family), although this analysis covered only larger families (those with three or more members), resulting in classification of 11 E-families and 18 N-families in yeast. Thus, the separation of paralogs in sequence space for E-families and N-families is so dissimilar that classification based solely on sequence divergence, mostly, reproduces the partitioning based on using essential paralogs as markers.
Figure 4.
ROC curves predicting whether a family belongs to the E- or N-class based on average sequence divergence of paralogs and clustering coefficient. Paralogous gene families (strongly connected components of DDG) were sorted by average sequence divergence between all pairs of paralogs (black squares) and clustering coefficients (green triangles). Only families with more than two members were analyzed, and families with a clustering coefficient of 0 were excluded as uninformative. This results in 23 E-families and 63 N-families for the sequence divergence calculation and 12 E-families and 18 N-families for the clustering coefficient calculation. The red diagonal line represents random expectation.
Our results show that E-families explore the protein sequence space, through duplication and divergence of paralogs, to a much greater depth than N-families. This has important bearings on the impact of family membership on functional divergence. So far, we have presented evidence that paralogs in E-families survive longer, enjoy a lower rate of pseudogenization, and diverge in sequence farther than paralogs in N-families. Subfunctionalization (division of ancestral pleiotropy) is characterized by strong purifying selection on both paralogs after duplication (Force et al. 1999; Lynch and Force 2000) and should be aided by the long survival of both duplicates in E-families. Since sequence divergence can be taken as one characteristic of subfunctionalization, we can reasonably hypothesize that paralogs from E-families preferentially evolve under the subfunctionalization scenario.
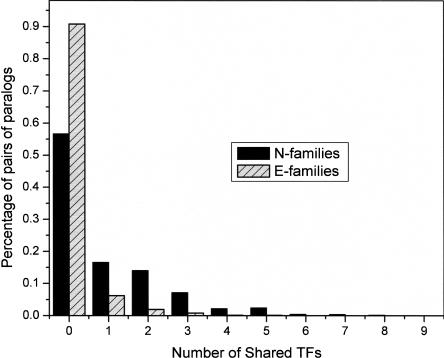
If the diverging paralogs in E-families follow the subfunctionalization (or neofunctionalization) routes, one would expect to observe divergence not only in sequence but also in expression regulation as the paralogs adapt to new biological niches. We compared the extent of transcription factor (TF) sharing between paralogs in the two classes of families. In accord with the notion of greater functional diversification of genes in E-families, most of the paralogs in these families had no common transcription factors binding to their upstream regions (Harbison et al. 2004). In contrast, many paralogs in N-families appeared to be coregulated by two or more TFs (Fig. 5). Thus, on average, E-family members seem to have diverged substantially farther than N-family members not only in sequence, but also in their regulatory context. This is consistent with the notion that the longer time of survival of paralogs in E-families allows modification of upstream regions and increases the chances for acquisition of new regulatory mechanisms.
Figure 5.
Shared transcription factors regulating pairs of paralogs from E-families and N-families. In E-families, 92% of the pairs had no TF-binding sites in common, whereas 29% of the pairs in N-families shared sites for at least two TFs (P < 1e-50). The distribution for N-families is characterized by a heavy tail with some pairs sharing as many as six TFs.
Discussion
We present evidence that gene family membership is a general and reliable indicator of the strength of purifying selection acting on a gene. Purifying selection, linked to functional constraints, may affect the course of molecular evolution not only through influencing the speed of divergence, but also by affecting the fate of paralogs after duplication. Specifically, we show that paralogs in E-families that include essential genes are subject to much stronger purifying selection than genes in N-families (Table 2) without essential paralogs. Thus, the first salient observation is that genes within families of paralogs experience similar levels of selection. Although there was no clear-cut difference in the distribution of protein functions over E-families and N-families, it appears that the presence of essential genes in the former correlates with greater biological importance of E-family members (Table 2). In spite of stronger selective constraints, paralogs in E-families exhibit greater sequence divergence than N-families (Fig. 3). Furthermore, the difference in the exploration of sequence space between E-families and N-families was so large that we could use average sequence divergence of paralogs or clustering coefficient in a predictive manner to classify a large proportion of families without using the existence of an essential paralog as a criterion (Fig. 4).
The difference in average sequence divergence between members of the E-families and N-families can be attributed to the differential dynamics of molecular evolution in these families. Specifically, N-families are evolutionarily more dynamic, that is, duplicates in these families tend to become pseudogenes shortly after duplication (Table 3) but also enjoy a higher fixation rate (Table 4). These results are compatible with recent evidence indicating that, in yeast, functionally less important genes tend to duplicate more often (He and Zhang 2006). The net outcome of the difference in the evolutionary dynamics of the E-families and N-families is that paralogs from E-families have longer life spans (Fig. 2). Thus, on average, paralogs in E-families are older, that is, have been evolving for a longer time, than paralogs in N-families (Fig. 2). It seems likely that, thanks to their longer average life span, paralogs in E-families follow the subfunctionalization or neofunctionalization paths more often than paralogs in N-families. This hypothesis is supported by the demonstration of more extensive transcriptional rewiring (divergence of TF-binding sites) between paralogs in E-families than in N-families (Fig. 5). These findings were robust with respect to the method of family identification and, importantly, the species in which the families were analyzed—very similar results were obtained for yeast, the nematode C. elegans, and the bacterium E. coli (see the Supplemental material).
The magnitude of the observed differences between the two types of families sharply contrasts previous observations of weak or moderate correlations between various functional and evolutionary characteristics of genes determined on the genome scale (Hurst and Smith 1999; Hirsh and Fraser 2001; Pal et al. 2001; Jordan et al. 2003; Drummond et al. 2005). We believe that the case of the E-families and N-families is so different because this partitioning attains a sharp separation of genes into two classes, and the measured characteristics of evolution reflect collective behaviors of these two distinct gene sets. The tight link between gene family membership and the strength of purifying selection is likely to reflect the relationship between function and constraints. Gene families share not only a set of related functions (Todd et al. 2001; Shakhnovich and Max Harvey 2004) but also a similar range of functional constraints, which translates into a characteristic strength of purifying selection. The typical range of functions associated with a certain level of purifying selection, in turn, determines the subsequent fate of the duplicates, that is, the likelihood that a gene is fixed after duplication, diverges to a particular degree from its paralog, and undergoes subfunctionalization or neofunctionalization. Further investigations into the origins of homogeneity of selection acting on members of paralogous families might uncover novel determinants of selection rooted in the commonalities shared by all members of a family rather than specific to individual genes.
Another possible conclusion from this study is that subfunctionalization is a transient phase in gene evolution, and genes that divide ancestral functions soon undergo neofunctionalization. This hypothesis is consistent with the observations of the apparently decreasing rate of pseudogenization with passage of time (Fig. 2) and change in transcriptional regulation of paralogs in E-families (Fig. 5). A similar sub-, neofunctionalization model has been recently proposed by He and Zhang in a study of the evolution of protein–protein interaction networks (He and Zhang 2005).
The results presented here uncover a surprisingly strong link between a gene’s membership in a paralogous family, the constraints imposed on its evolution by purifying selection, and the characteristics of gene family evolution by duplication. The classification of genes into E-families and N-families could be a useful starting point for a variety of future studies into the relationships among the evolution of genes, genomes, and phenotypes.
Methods
To construct the DDG for each of three species (S. cerevisiae, C. elegans, and E. coli), the complete sets of protein sequences from the respective genomes were extracted from the GenBank database, and an all-against-all sequence comparison was performed using the BLAST program (Altschul et al. 1997; ftp://ftp.ncbi.nih.gov). Each protein is a node in the DDG, and the results of comparisons, which can be represented as BLAST scores, expectation (e) values, or amino acid sequence identities, are the edges connecting the nodes. The edges were assigned weights using BLAST scores, amino acid sequence identities, or the ratio of the nonsynonymous (Ka) and the synonymous (Ks) substitution rates. To calculate the Ka and Ks values, amino acid sequence alignments were traced back to the corresponding nucleotide sequence alignments, and Ka and Ks were calculated using PAML (Yang 1997; Lynch and Conery 2000; Yang and Nielsen 2000; Conery and Lynch 2001). A similar procedure was used by Enright et al. (2003).
Paralogous families were identified by finding all strongly connected components in the DDG as described in Cormen (2001) (see Supplemental Table S1). We define a strongly connected component as a set of nodes where a path exists between any pair. The principal results presented here were obtained using a BLAST cutoff of 1e-15 and dS = 5. However, nearly identical results were obtained through a broad range of cutoffs (Table 3) After identifying all strongly connected components of the DDG, high-throughput essentiality data were used to divide the families into the E- and N-classes. The yeast gene essentiality data were obtained from high-throughput knockout experiments (Giaever et al. 2002); the C. elegans gene essentiality data were from the genome-wide RNAi knockdown experiments (Fraser et al. 2000; Kamath et al. 2003; Simmer et al. 2003), and the E. coli essentiality data were from GenBank (ftp://ftp.ncbi.nih.gov) (Gerdes et al. 2003; for details, see the Supplemental material). The data on yeast SNPs were from Winzeler et al. (2003). The transcription factor data were from ChIP-chip experiments (Lee et al. 2002; Harbison et al. 2004).
We used the InParanoid program (http://inparanoid.cgb.ki.se/) to identify orthologs and species-specific paralogs from the five yeast species (S. cerevisiae, C. glabrata, K. lactis, A. gossypii, and D. hansenii). The genomes were obtained from the NCBI (http://www.ncbi.nlm/nih.gov).
Acknowledgments
The authors thank Eugene Shakhnovich for his invaluable support and review of the manuscript. We also thank Matthew Hahn for proposing the duplication rate study and for many helpful comments regarding the manuscript. Additionally, we extend our appreciation to Charles DeLisi, Tim Reddy, Joe Mellor, Julian Mintseris, and others at the Bioinformatics program at Boston University for discussion and insights.
Footnotes
[Supplemental material is available online at www.genome.org.]
Article published online before print. Article and publication date are at http://www.genome.org/cgi/doi/10.1101/gr.5346206
References
- Altschul S.F., Madden T.L., Schaffer A.A., Zhang J., Zhang Z., Miller W., Lipman D.J., Madden T.L., Schaffer A.A., Zhang J., Zhang Z., Miller W., Lipman D.J., Schaffer A.A., Zhang J., Zhang Z., Miller W., Lipman D.J., Zhang J., Zhang Z., Miller W., Lipman D.J., Zhang Z., Miller W., Lipman D.J., Miller W., Lipman D.J., Lipman D.J. Gapped BLAST and PSI-BLAST: A new generation of protein database search programs. Nucleic Acids Res. 1997;25:3389–3402. doi: 10.1093/nar/25.17.3389. [DOI] [PMC free article] [PubMed] [Google Scholar]
- Conery J.S., Lynch M., Lynch M. Nucleotide substitutions and the evolution of duplicate genes. Pac. Symp. Biocomput. 2001;2001:167–178. doi: 10.1142/9789814447362_0018. [DOI] [PubMed] [Google Scholar]
- Cormen T.H. Introduction to algorithms. MIT Press; Cambridge, MA: 2001. [Google Scholar]
- Davis J.C., Petrov D.A., Petrov D.A. Preferential duplication of conserved proteins in eukaryotic genomes. PLoS Biol. 2004;2:e55. doi: 10.1371/journal.pbio.0020055. [DOI] [PMC free article] [PubMed] [Google Scholar]
- Drake J.W., Charlesworth B., Charlesworth D., Crow J.F., Charlesworth B., Charlesworth D., Crow J.F., Charlesworth D., Crow J.F., Crow J.F. Rates of spontaneous mutation. Genetics. 1998;148:1667–1686. doi: 10.1093/genetics/148.4.1667. [DOI] [PMC free article] [PubMed] [Google Scholar]
- Drummond D.A., Bloom J.D., Adami C., Wilke C.O., Arnold F.H., Bloom J.D., Adami C., Wilke C.O., Arnold F.H., Adami C., Wilke C.O., Arnold F.H., Wilke C.O., Arnold F.H., Arnold F.H. Why highly expressed proteins evolve slowly. Proc. Natl. Acad. Sci. 2005;102:14338–14343. doi: 10.1073/pnas.0504070102. [DOI] [PMC free article] [PubMed] [Google Scholar]
- Drummond D.A., Raval A., Wilke C.O., Raval A., Wilke C.O., Wilke C.O. A single determinant dominates the rate of yeast protein evolution. Mol. Biol. Evol. 2006;23:327–337. doi: 10.1093/molbev/msj038. [DOI] [PubMed] [Google Scholar]
- Enright A.J., Kunin V., Ouzounis C.A., Kunin V., Ouzounis C.A., Ouzounis C.A. Protein families and TRIBES in genome sequence space. Nucleic Acids Res. 2003;31:4632–4638. doi: 10.1093/nar/gkg495. [DOI] [PMC free article] [PubMed] [Google Scholar]
- Force A., Lynch M., Pickett F.B., Amores A., Yan Y.L., Postlethwait J., Lynch M., Pickett F.B., Amores A., Yan Y.L., Postlethwait J., Pickett F.B., Amores A., Yan Y.L., Postlethwait J., Amores A., Yan Y.L., Postlethwait J., Yan Y.L., Postlethwait J., Postlethwait J. Preservation of duplicate genes by complementary, degenerative mutations. Genetics. 1999;151:1531–1545. doi: 10.1093/genetics/151.4.1531. [DOI] [PMC free article] [PubMed] [Google Scholar]
- Fraser A.G., Kamath R.S., Zipperlen P., Martinez-Campos M., Sohrmann M., Ahringer J., Kamath R.S., Zipperlen P., Martinez-Campos M., Sohrmann M., Ahringer J., Zipperlen P., Martinez-Campos M., Sohrmann M., Ahringer J., Martinez-Campos M., Sohrmann M., Ahringer J., Sohrmann M., Ahringer J., Ahringer J. Functional genomic analysis of C. elegans chromosome I by systematic RNA interference. Nature. 2000;408:325–330. doi: 10.1038/35042517. [DOI] [PubMed] [Google Scholar]
- Fraser H.B., Hirsh A.E., Steinmetz L.M., Scharfe C., Feldman M.W., Hirsh A.E., Steinmetz L.M., Scharfe C., Feldman M.W., Steinmetz L.M., Scharfe C., Feldman M.W., Scharfe C., Feldman M.W., Feldman M.W. Evolutionary rate in the protein interaction network. Science. 2002;296:750–752. doi: 10.1126/science.1068696. [DOI] [PubMed] [Google Scholar]
- Gerdes S.Y., Scholle M.D., Campbell J.W., Balazsi G., Ravasz E., Daugherty M.D., Somera A.L., Kyrpides N.C., Anderson I., Gelfand M.S., Scholle M.D., Campbell J.W., Balazsi G., Ravasz E., Daugherty M.D., Somera A.L., Kyrpides N.C., Anderson I., Gelfand M.S., Campbell J.W., Balazsi G., Ravasz E., Daugherty M.D., Somera A.L., Kyrpides N.C., Anderson I., Gelfand M.S., Balazsi G., Ravasz E., Daugherty M.D., Somera A.L., Kyrpides N.C., Anderson I., Gelfand M.S., Ravasz E., Daugherty M.D., Somera A.L., Kyrpides N.C., Anderson I., Gelfand M.S., Daugherty M.D., Somera A.L., Kyrpides N.C., Anderson I., Gelfand M.S., Somera A.L., Kyrpides N.C., Anderson I., Gelfand M.S., Kyrpides N.C., Anderson I., Gelfand M.S., Anderson I., Gelfand M.S., Gelfand M.S., et al. Experimental determination and system level analysis of essential genes in Escherichia coliMG1655. J. Bacteriol. 2003;185:5673–5684. doi: 10.1128/JB.185.19.5673-5684.2003. [DOI] [PMC free article] [PubMed] [Google Scholar]
- Giaever G., Chu A.M., Ni L., Connelly C., Riles L., Veronneau S., Dow S., Lucau-Danila A., Anderson K., Andre B., Chu A.M., Ni L., Connelly C., Riles L., Veronneau S., Dow S., Lucau-Danila A., Anderson K., Andre B., Ni L., Connelly C., Riles L., Veronneau S., Dow S., Lucau-Danila A., Anderson K., Andre B., Connelly C., Riles L., Veronneau S., Dow S., Lucau-Danila A., Anderson K., Andre B., Riles L., Veronneau S., Dow S., Lucau-Danila A., Anderson K., Andre B., Veronneau S., Dow S., Lucau-Danila A., Anderson K., Andre B., Dow S., Lucau-Danila A., Anderson K., Andre B., Lucau-Danila A., Anderson K., Andre B., Anderson K., Andre B., Andre B., et al. Functional profiling of the Saccharomyces cerevisiae genome. Nature. 2002;418:387–391. doi: 10.1038/nature00935. [DOI] [PubMed] [Google Scholar]
- Gu X. Statistical methods for testing functional divergence after gene duplication. Mol. Biol. Evol. 1999;16:1664–1674. doi: 10.1093/oxfordjournals.molbev.a026080. [DOI] [PubMed] [Google Scholar]
- Gu X. Mathematical modeling for functional divergence after gene duplication. J. Comput. Biol. 2001a;8:221–234. doi: 10.1089/10665270152530827. [DOI] [PubMed] [Google Scholar]
- Gu X. A site-specific measure for rate difference after gene duplication or speciation. Mol. Biol. Evol. 2001b;18:2327–2330. doi: 10.1093/oxfordjournals.molbev.a003780. [DOI] [PubMed] [Google Scholar]
- Hahn M.W., Kern A.D., Kern A.D. Comparative genomics of centrality and essentiality in three eukaryotic protein-interaction networks. Mol. Biol. Evol. 2005;22:803–806. doi: 10.1093/molbev/msi072. [DOI] [PubMed] [Google Scholar]
- Harbison C.T., Gordon D.B., Lee T.I., Rinaldi N.J., Macisaac K.D., Danford T.W., Hannett N.M., Tagne J.B., Reynolds D.B., Yoo J., Gordon D.B., Lee T.I., Rinaldi N.J., Macisaac K.D., Danford T.W., Hannett N.M., Tagne J.B., Reynolds D.B., Yoo J., Lee T.I., Rinaldi N.J., Macisaac K.D., Danford T.W., Hannett N.M., Tagne J.B., Reynolds D.B., Yoo J., Rinaldi N.J., Macisaac K.D., Danford T.W., Hannett N.M., Tagne J.B., Reynolds D.B., Yoo J., Macisaac K.D., Danford T.W., Hannett N.M., Tagne J.B., Reynolds D.B., Yoo J., Danford T.W., Hannett N.M., Tagne J.B., Reynolds D.B., Yoo J., Hannett N.M., Tagne J.B., Reynolds D.B., Yoo J., Tagne J.B., Reynolds D.B., Yoo J., Reynolds D.B., Yoo J., Yoo J., et al. Transcriptional regulatory code of a eukaryotic genome. Nature. 2004;431:99–104. doi: 10.1038/nature02800. [DOI] [PMC free article] [PubMed] [Google Scholar]
- Harrison P.M., Gerstein M., Gerstein M. Studying genomes through the aeons: Protein families, pseudogenes and proteome evolution. J. Mol. Biol. 2002;318:1155–1174. doi: 10.1016/s0022-2836(02)00109-2. [DOI] [PubMed] [Google Scholar]
- Harrison P.M., Echols N., Gerstein M.B., Echols N., Gerstein M.B., Gerstein M.B. Digging for dead genes: An analysis of the characteristics of the pseudogene population in the Caenorhabditis elegans genome. Nucleic Acids Res. 2001;29:818–830. doi: 10.1093/nar/29.3.818. [DOI] [PMC free article] [PubMed] [Google Scholar]
- Harrison P., Kumar A., Lan N., Echols N., Snyder M., Gerstein M., Kumar A., Lan N., Echols N., Snyder M., Gerstein M., Lan N., Echols N., Snyder M., Gerstein M., Echols N., Snyder M., Gerstein M., Snyder M., Gerstein M., Gerstein M. A small reservoir of disabled ORFs in the yeast genome and its implications for the dynamics of proteome evolution. J. Mol. Biol. 2002;316:409–419. doi: 10.1006/jmbi.2001.5343. [DOI] [PubMed] [Google Scholar]
- He X., Zhang J., Zhang J. Rapid subfunctionalization accompanied by prolonged and substantial neofunctionalization in duplicate gene evolution. Genetics. 2005;169:1157–1164. doi: 10.1534/genetics.104.037051. [DOI] [PMC free article] [PubMed] [Google Scholar]
- He X., Zhang J., Zhang J. Higher duplicability of less important genes in yeast genomes. Mol. Biol. Evol. 2006;23:144–151. doi: 10.1093/molbev/msj015. [DOI] [PubMed] [Google Scholar]
- Hirsh A.E., Fraser H.B., Fraser H.B. Protein dispensability and rate of evolution. Nature. 2001;411:1046–1049. doi: 10.1038/35082561. [DOI] [PubMed] [Google Scholar]
- Hurst L.D., Smith N.G., Smith N.G. Do essential genes evolve slowly? Curr. Biol. 1999;9:747–750. doi: 10.1016/s0960-9822(99)80334-0. [DOI] [PubMed] [Google Scholar]
- Jordan I.K., Rogozin I.B., Wolf Y.I., Koonin E.V., Rogozin I.B., Wolf Y.I., Koonin E.V., Wolf Y.I., Koonin E.V., Koonin E.V. Essential genes are more evolutionarily conserved than are nonessential genes in bacteria. Genome Res. 2002;12:962–968. doi: 10.1101/gr.87702. [DOI] [PMC free article] [PubMed] [Google Scholar]
- Jordan I.K., Wolf Y.I., Koonin E.V., Wolf Y.I., Koonin E.V., Koonin E.V. No simple dependence between protein evolution rate and the number of protein–protein interactions: Only the most prolific interactors tend to evolve slowly. BMC Evol. Biol. 2003;3:1. doi: 10.1186/1471-2148-3-1. [DOI] [PMC free article] [PubMed] [Google Scholar]
- Jordan I.K., Wolf Y.I., Koonin E.V., Wolf Y.I., Koonin E.V., Koonin E.V. Duplicated genes evolve slower than singletons despite the initial rate increase. BMC Evol. Biol. 2004;4:22. doi: 10.1186/1471-2148-4-22. [DOI] [PMC free article] [PubMed] [Google Scholar]
- Kamath R.S., Fraser A.G., Dong Y., Poulin G., Durbin R., Gotta M., Kanapin A., Le Bot N., Moreno S., Sohrmann M., Fraser A.G., Dong Y., Poulin G., Durbin R., Gotta M., Kanapin A., Le Bot N., Moreno S., Sohrmann M., Dong Y., Poulin G., Durbin R., Gotta M., Kanapin A., Le Bot N., Moreno S., Sohrmann M., Poulin G., Durbin R., Gotta M., Kanapin A., Le Bot N., Moreno S., Sohrmann M., Durbin R., Gotta M., Kanapin A., Le Bot N., Moreno S., Sohrmann M., Gotta M., Kanapin A., Le Bot N., Moreno S., Sohrmann M., Kanapin A., Le Bot N., Moreno S., Sohrmann M., Le Bot N., Moreno S., Sohrmann M., Moreno S., Sohrmann M., Sohrmann M., et al. Systematic functional analysis of the Caenorhabditis elegans genome using RNAi. Nature. 2003;421:231–237. doi: 10.1038/nature01278. [DOI] [PubMed] [Google Scholar]
- Keightley P.D., Eyre-Walker A., Eyre-Walker A. Terumi Mukai and the riddle of deleterious mutation rates. Genetics. 1999;153:515–523. doi: 10.1093/genetics/153.2.515. [DOI] [PMC free article] [PubMed] [Google Scholar]
- Kimura M. Possibility of extensive neutral evolution under stabilizing selection with special reference to nonrandom usage of synonymous codons. Proc. Natl. Acad. Sci. 1981;78:5773–5777. doi: 10.1073/pnas.78.9.5773. [DOI] [PMC free article] [PubMed] [Google Scholar]
- Lee T.I., Rinaldi N.J., Robert F., Odom D.T., Bar-Joseph Z., Gerber G.K., Hannett N.M., Harbison C.T., Thompson C.M., Simon I., Rinaldi N.J., Robert F., Odom D.T., Bar-Joseph Z., Gerber G.K., Hannett N.M., Harbison C.T., Thompson C.M., Simon I., Robert F., Odom D.T., Bar-Joseph Z., Gerber G.K., Hannett N.M., Harbison C.T., Thompson C.M., Simon I., Odom D.T., Bar-Joseph Z., Gerber G.K., Hannett N.M., Harbison C.T., Thompson C.M., Simon I., Bar-Joseph Z., Gerber G.K., Hannett N.M., Harbison C.T., Thompson C.M., Simon I., Gerber G.K., Hannett N.M., Harbison C.T., Thompson C.M., Simon I., Hannett N.M., Harbison C.T., Thompson C.M., Simon I., Harbison C.T., Thompson C.M., Simon I., Thompson C.M., Simon I., Simon I., et al. Transcriptional regulatory networks in Saccharomyces cerevisiae. Science. 2002;298:799–804. doi: 10.1126/science.1075090. [DOI] [PubMed] [Google Scholar]
- Levins R. Evolution in changing environments; some theoretical explorations. Princeton University Press; Princeton, NJ: 1968. [Google Scholar]
- Lynch M., Conery J.S., Conery J.S. The evolutionary fate and consequences of duplicate genes. Science. 2000;290:1151–1155. doi: 10.1126/science.290.5494.1151. [DOI] [PubMed] [Google Scholar]
- Lynch M., Force A., Force A. The probability of duplicate gene preservation by subfunctionalization. Genetics. 2000;154:459–473. doi: 10.1093/genetics/154.1.459. [DOI] [PMC free article] [PubMed] [Google Scholar]
- Lynch M., Katju V., Katju V. The altered evolutionary trajectories of gene duplicates. Trends Genet. 2004;20:544–549. doi: 10.1016/j.tig.2004.09.001. [DOI] [PubMed] [Google Scholar]
- Macarthur R., Levins R., Levins R. Competition, habitat selection, and character displacement in a patchy environment. Proc. Natl. Acad. Sci. 1964;51:1207–1210. doi: 10.1073/pnas.51.6.1207. [DOI] [PMC free article] [PubMed] [Google Scholar]
- Nei M. Molecular evolutionary genetics. Columbia University Press; New York: 1987. [Google Scholar]
- Nei M., Roychoudhury A.K., Roychoudhury A.K. Probability of fixation of nonfunctional genes at duplicate loci. Am. Nat. 1973;107:590–605. [Google Scholar]
- Ohno S. Evolution by gene duplication. Springer-Verlag; Berlin, New York: 1970. [Google Scholar]
- Pal C., Papp B., Hurst L.D., Papp B., Hurst L.D., Hurst L.D. Highly expressed genes in yeast evolve slowly. Genetics. 2001;158:927–931. doi: 10.1093/genetics/158.2.927. [DOI] [PMC free article] [PubMed] [Google Scholar]
- Petrov D.A., Hartl D.L., Hartl D.L. Pseudogene evolution and natural selection for a compact genome. J. Hered. 2000;91:221–227. doi: 10.1093/jhered/91.3.221. [DOI] [PubMed] [Google Scholar]
- Remm M., Storm C.E., Sonnhammer E.L., Storm C.E., Sonnhammer E.L., Sonnhammer E.L. Automatic clustering of orthologs and in-paralogs from pairwise species comparisons. J. Mol. Biol. 2001;314:1041–1052. doi: 10.1006/jmbi.2000.5197. [DOI] [PubMed] [Google Scholar]
- Shakhnovich B.E. Relative contributions of structural designability and functional diversity in molecular evolution of duplicates. Bioinformatics. 2006;22:e440–e445. doi: 10.1093/bioinformatics/btl211. [DOI] [PubMed] [Google Scholar]
- Shakhnovich B.E., Max Harvey J., Max Harvey J. Quantifying structure–function uncertainty: A graph theoretical exploration into the origins and limitations of protein annotation. J. Mol. Biol. 2004;337:933–949. doi: 10.1016/j.jmb.2004.02.009. [DOI] [PubMed] [Google Scholar]
- Simmer F., Moorman C., van der Linden A.M., Kuijk E., van den Berghe P.V., Kamath R.S., Fraser A.G., Ahringer J., Plasterk R.H., Moorman C., van der Linden A.M., Kuijk E., van den Berghe P.V., Kamath R.S., Fraser A.G., Ahringer J., Plasterk R.H., van der Linden A.M., Kuijk E., van den Berghe P.V., Kamath R.S., Fraser A.G., Ahringer J., Plasterk R.H., Kuijk E., van den Berghe P.V., Kamath R.S., Fraser A.G., Ahringer J., Plasterk R.H., van den Berghe P.V., Kamath R.S., Fraser A.G., Ahringer J., Plasterk R.H., Kamath R.S., Fraser A.G., Ahringer J., Plasterk R.H., Fraser A.G., Ahringer J., Plasterk R.H., Ahringer J., Plasterk R.H., Plasterk R.H. Genome-wide RNAi of C. elegans using the hypersensitive rrf-3 strain reveals novel gene functions. PLoS Biol. 2003;1:e12. doi: 10.1371/journal.pbio.0000012. [DOI] [PMC free article] [PubMed] [Google Scholar]
- Todd A.E., Orengo C.A., Thornton J.M., Orengo C.A., Thornton J.M., Thornton J.M. Evolution of function in protein superfamilies, from a structural perspective. J. Mol. Biol. 2001;307:1113–1143. doi: 10.1006/jmbi.2001.4513. [DOI] [PubMed] [Google Scholar]
- Wall D.P., Hirsh A.E., Fraser H.B., Kumm J., Giaever G., Eisen M.B., Feldman M.W., Hirsh A.E., Fraser H.B., Kumm J., Giaever G., Eisen M.B., Feldman M.W., Fraser H.B., Kumm J., Giaever G., Eisen M.B., Feldman M.W., Kumm J., Giaever G., Eisen M.B., Feldman M.W., Giaever G., Eisen M.B., Feldman M.W., Eisen M.B., Feldman M.W., Feldman M.W. Functional genomic analysis of the rates of protein evolution. Proc. Natl. Acad. Sci. 2005;102:5483–5488. doi: 10.1073/pnas.0501761102. [DOI] [PMC free article] [PubMed] [Google Scholar]
- Winzeler E.A., Castillo-Davis C.I., Oshiro G., Liang D., Richards D.R., Zhou Y., Hartl D.L., Castillo-Davis C.I., Oshiro G., Liang D., Richards D.R., Zhou Y., Hartl D.L., Oshiro G., Liang D., Richards D.R., Zhou Y., Hartl D.L., Liang D., Richards D.R., Zhou Y., Hartl D.L., Richards D.R., Zhou Y., Hartl D.L., Zhou Y., Hartl D.L., Hartl D.L. Genetic diversity in yeast assessed with whole-genome oligonucleotide arrays. Genetics. 2003;163:79–89. doi: 10.1093/genetics/163.1.79. [DOI] [PMC free article] [PubMed] [Google Scholar]
- Yang Z. PAML: A program package for phylogenetic analysis by maximum likelihood. Comput. Appl. Biosci. 1997;13:555–556. doi: 10.1093/bioinformatics/13.5.555. [DOI] [PubMed] [Google Scholar]
- Yang Z., Nielsen R., Nielsen R. Estimating synonymous and nonsynonymous substitution rates under realistic evolutionary models. Mol. Biol. Evol. 2000;17:32–43. doi: 10.1093/oxfordjournals.molbev.a026236. [DOI] [PubMed] [Google Scholar]
- Yang J., Gu Z., Li W.H., Gu Z., Li W.H., Li W.H. Rate of protein evolution versus fitness effect of gene deletion. Mol. Biol. Evol. 2003;20:772–774. doi: 10.1093/molbev/msg078. [DOI] [PubMed] [Google Scholar]


