Abstract
sp1 cDNA was isolated from aspen (Populus tremula) plants by immunoscreening an expression library using polyclonal antibodies against BspA protein. BspA, which is a boiling-stable protein, accumulates in aspen plants in response to water stress and abscisic acid application (Pelah et al., 1995). The sp1 cDNA was found to encode a 12.4-kD generally hydrophilic protein with a hydrophobic C terminus, which is different from the BspA protein and was termed SP1 (stable protein 1). Northern-blot analysis revealed that sp1 encodes a small mRNA (about 0.6 kb) that is expressed in aspen plants under non-stress conditions and is accumulated after salt, cold, heat, and desiccation stress, and during the recovery from stress. The SP1 detected in plants remained soluble upon boiling, migrated both as a 12.4-kD band and a much higher mass of 116 kD on a 17% (w/v) Tricine-sodium dodecyl sulfate-polyacrylamide gel. Comparative protease digestion patterns, amino acid analyses, and the N-terminal sequences of the 12.4- and 116-kD proteins revealed that SP1 is homo-oligomeric. Furthermore, gel filtration chromatography analysis indicated that SP1 exists in aspen plants as a complex, composed of 12 subunits of 12.4 kD. A large number of sequences deduced from expressed sequence tags and genomic sequences of other organisms with unknown function show high homology to SP1. Thus, SP1 may represent a new protein family. Here, we present the first report on this putative protein family: the cloning, isolation, and characterization of SP1, a stress-responsive, boiling-soluble, oligomeric protein.
It is well recognized that various environmental stresses significantly limit crop productivity. Drought, salinity, extreme temperatures, and oxidative stress, among others, are often interconnected and may induce similar cellular damage. For example, drought and salinization, sometimes in combination, are manifested primarily as osmotic stress, resulting in disrupted homeostasis of water potential and ion distribution in the cell (Serrano et al., 1999; Zhu, 2001a). Oxidative stress occurs frequently in the presence of high temperature, salinity, or drought stress, and causes the denaturation of functional and structural proteins (Smirnoff, 1998). As a consequence, these diverse environmental stresses often activate similar cell signaling pathways (Shinozaki and Yamaguchi-Shinozaki, 2000; Knight and Knight, 2001; Zhu, 2001b) and cellular responses, such as the production of stress proteins, up-regulation of antioxidants, and accumulation of compatible solutes (Vierling and Kimpel, 1992; Bray, 1993; Zhu et al., 1997; Cushman and Bohnert, 2000).
To cope with environmental stresses, plants have developed various molecular-biochemical mechanisms that are involved in stress tolerance (Vierling, 1991; Ingram and Bartels, 1996; Bohnert and Sheveleva, 1998; Thomashow, 1999; Hoekstra et al., 2001). One of the mechanisms that may confer such tolerance is the activation of a large set of genes, leading to the accumulation of specific proteins in the cells. Late embryogenesis abundant (LEA)-type proteins and heat shock proteins (Hsps) are two major types of stress-induced proteins, which accumulate upon water, salinity, and extreme temperature stresses and are believed to exert cellular protection during the stress (Vierling and Kimpel, 1992; Dure, 1993a, 1993b; Boston et al., 1996; Close, 1996; Ingram and Bartels, 1996; Waters et al., 1996; Thomashow, 1998). In this study, we describe the isolation of sp1 cDNA and the characterization of SP1 protein from aspen (Populus tremula) plants. A database survey and analysis revealed that SP1 is a member of a previously unknown protein family. This is the first report on this putative protein family, in which we describe the cloning, sequence analysis, isolation, and characterization of SP1 and its stress responsiveness, boiling solubility, and oligomeric structure.
RESULTS
Cloning and Sequence Analysis of sp1 cDNA
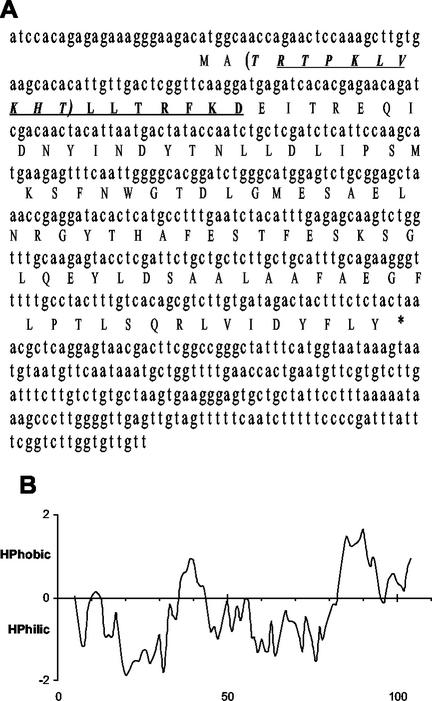
A 567-bp cDNA clone was isolated by screening 7 × 10⁵ recombinant phage plaques from a lambda expression library derived from water-stressed aspen shoots, using anti-BspA antibodies (Pelah et al., 1995). Sequence analysis revealed no homology to BspA's N-terminal amino acid sequence; thus, the newly isolated cDNA was designated sp1 (Fig. 1A). The sp1 cDNA sequence has been submitted to EMBL (accession no. AJ276517). High sequence homology with sp1 was detected in a number of genes: 96.6% homology with the Populus trichocarpa × Populus deltoides pop3 mRNA sequence (accession no. M18538), and 61.6% homology with P. trichocarpa × P. deltoides wound-responsive mRNA (accession no. X55440). Two Arabidopsis genes (accession nos. AF370462 and AB022216) were found to share 65% and 62% identity with sp1. In addition, over 100 expressed sequence tags were found to share homology with sp1. All these sequences, however, represent genes with unknown function, whose proteins have not been isolated or characterized.
Figure 1.
sp1 sequence analysis. A, sp1 cDNA sequence and its deduced protein sequence. The N-terminal sequence of the 12.4-kD protein is underlined. The N-terminal amino acid sequence of the 116-kD protein is shown in parentheses. B, Hydropathy plot (Goldman et al., 1986) of predicted sp1 cDNA-encoded protein. sp1 cDNA sequence has been submitted to EMBL (accession no. AJ276517).
SP1 sequence analysis (Wisconsin Package Version 9.1, Genetics Computer Group-GCG, Madison, WI) revealed that the sp1 cDNA encodes a 12,369-D polypeptide with a predicted pI of 4.87. This polypeptide lacks Cys, is low in Trp (0.9%), and rich in Leu (13.8%), Thr (9.2%), Ala (8.3%), Glu (7.4%), and Ser (7.4%). Analysis of sp1's translated protein using Goldman et al.'s (1986) hydropathy plot (Fig. 1B) indicated that it is a generally hydrophilic protein with a hydrophobic C terminus.
Northern-Blot Analyses of Stressed Plants
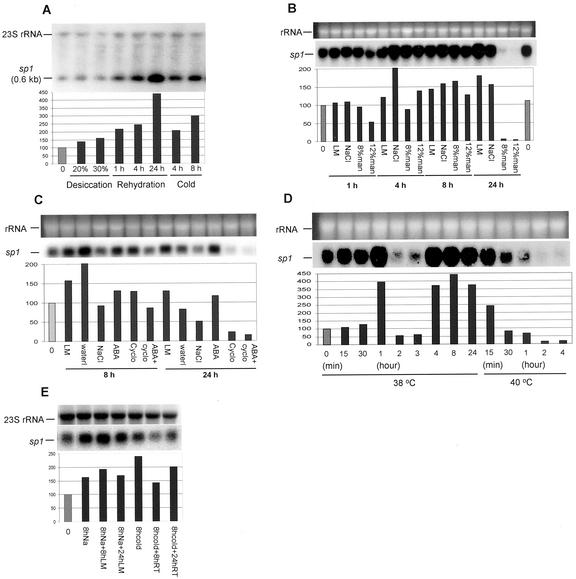
Northern-blot analysis of stressed and non-stressed plants using sp1 cDNA as a probe showed a basal level of the transcript in the non-stressed plants, which was modulated to various degrees by different stress treatments (Fig. 2).
Figure 2.
Changes in sp1 transcript in response to various stress conditions and during the recovery (northern blot analysis). Ten (A, B, D, and E) or 20 (C) μg of total RNA was loaded onto each lane. A 570-bp fragment containing the entire coding sequence of the sp1 cDNA was used as a probe for each blot. The size of sp1 mRNA was estimated by comparing the position of sp1 with RNA size markers. In each experiment, the level of sp1 expression was determined densitometrically and further standardized using the level of ribosomal RNA and the level of sp1 expression in untreated plants. The percent increase or decrease of sp1 transcript relative to untreated plants (=100%) for each treatment is indicated. In all the figures, 0 = untreated plant sample. A, Desiccation, rehydration, and cold treatments. For desiccation, in vitro plants were removed from their solid culture media, and wilted on the bench until they lost 20% or 30% of their initial fresh weight, then kept in a closed bag for an additional 3 h. For rehydration, plants subjected to 30% water loss and then kept in a closed bag for 3 h, and rehydrated by placing the roots in distilled water for 1, 4, or 24 h. For cold, in vitro plants were transferred from 24°C ± 1°C growth room to 4°C for 4 or 8 h. B, For NaCl and mannitol treatments, in vitro plants removed from their semisolid culture media were cultured for 1, 4, 8, and 24 h with their root systems in 150 mm NaCl (NaCl), or 8% or 12% (w/v) mannitol (man), each of which was incorporated into the standard liquid culture medium (LM). C, For abscisic acid (ABA), cycloheximide, and high-NaCl treatments, in vitro plants removed from their semisolid culture media were cultured for 8 and 24 h with their root systems in 100 μm ABA (ABA), 3.5 μm cycloheximide (Cyclo), 100 μm ABA plus 3.5 μm cycloheximide (ABA+cyclo), or 250 mm NaCl (NaCl), each of which was incorporated into the standard LM. Water, Distilled water. D, For heat treatments, in vitro plants were transferred from a 24°C ± 1°C growth room to 38°C or 40°C for the length of time indicated on the figure. E, For recovery from salt and cold stress, plantlets subjected to 150 mm NaCl for 8 h (8hNa) were transferred to LM for 8 (8hNa+8hLM) and 24 (8hNa+24hLM) h. Plantlets that exposed to cold (4°C) for 8 h (8hcold) were transferred back to room temperature (24°C) for 8 (8hcold+8hRT) and 24 (8hcold+24hRT) h. As a loading control, a 23S ribosomal DNA probe was used to hybridize the blot (A and E); alternatively, ethidium bromide-stained ribosomal RNA is shown (B, C, D). The experiments were repeated twice, except for the experiments of NaCl (150 mm), mannitol, and cold treatments, which were repeated three times.
Desiccation, rehydration, and cold treatments are depicted in Figure 2A. Upon desiccation, sp1 transcript accumulated to slightly higher levels, with a 39% and 59% increment in transcript level for 20% and 30% desiccation, respectively. However, a dramatic increase, up to 437% of control transcript levels, was found in rehydrated plants. When plants were transferred from agar medium to water, the transcript level showed an increment after 8 h of incubation, and then returned to control level after 24 h (Fig. 2C). sp1 mRNA levels increased by 2- to 3-fold upon exposure to 4°C. When cold-stressed plants were transferred to room temperature, sp1 level declined at 8 h and increased again after 24 h (Fig. 2E).
NaCl and mannitol treatments are shown in Figure 2B. LM did not have a clear effect on sp1 transcript level for up to 4 h. After 8 h, sp1 levels were high in all plants as well as in LM, irrespective of the treatment. Long-term exposure of plants to LM resulted in considerable up-regulation in sp1 transcript. Exposure of plants for 4 h to 150 mm NaCl resulted in a 2-fold increase in sp1 transcript. A decline was observed upon longer duration of exposure to NaCl. When 8-h NaCl-treated plants were moved into LM for recovery, sp1 transcript continued to increase at 8 h, and decreased upon a longer period of recovery (Fig. 2E). High concentration of mannitol (12% [w/v]) brought down the sp1 transcript to about 50% at the 1st h. Although there was a recovery at 4 h of treatment, the sp1 level dropped afterward. Similarly, 8% (w/v) mannitol had also brought down the sp1 transcript after 1 and 4 h of treatment, but the recovery was observed at 8 h. Treatment with both 8% and 12% (w/v) mannitol for 24 h caused significant reductions in sp1 transcript. A high concentration of NaCl (250 mm, Fig. 2C) was accompanied by down-regulation of sp1 transcript.
ABA and cycloheximide treatments are illustrated in Figure 2C. ABA application did not stimulate sp1 accumulation to high levels. Cycloheximide inhibited the sp1 transcript expression only after 24 h but not at 8 h.
Heat treatments are represented in Figure 2D. The sp1 transcript peaked after plant exposure to 38°C for 1 h, and it decreased during the 2nd and 3rd h of treatment to below control level, then peaked again at 4 h, and this level was maintained for at least 24 h. At 40°C, sp1 transcript was up-regulated significantly after 15 min, decreasing thereafter.
Detection of SP1 in Aspen Plants
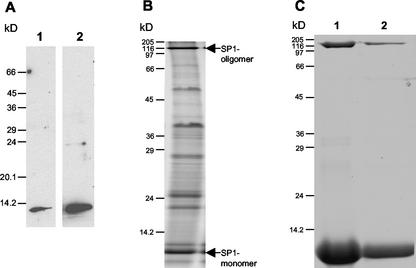
To examine SP1 expression in plants, the total soluble fraction and the 10-min boiling-soluble protein fraction (less than 5% of the total protein remained soluble) of aspen plant extracts were run on a 15% (w/v) Gly-SDS-polyacrylamide gel and analyzed by western blot using antirecombinant-SP1 antibodies (Fig. 3A). The antibodies reacted strongly with a band at 12.4 kD from both fractions, indicating that SP1 remains soluble after boiling. No high-molecular mass band was recognized by antirecombinant SP1 antibodies. Furthermore, Tricine-SDS-PAGE, which results in better separation of low-mass proteins and peptides, was employed to examine SP1 expression. Total boiling-soluble proteins were separated on a 17% (w/v) Tricine-SDS-polyacrylamide gel, followed by Coomassie Blue staining (Fig. 3B). Among the three proteins smaller than 14 kD, the middle band strongly reacted with antirecombinant-SP1 antibodies (data not shown). For further analysis, this band was excised from the gel and the protein was collected by electro-elution. Surprisingly, when the electro-eluted protein was rerun on the SDS gel, a high-molecular mass band (116 kD), in addition to the 12.4-kD band, was observed (Fig. 3C, lane 1). A similarly sized band (116 kD) was also observed on the gel containing total boiling-soluble proteins (Fig. 3B). This 116-kD band was also isolated by electro-elution, and when rerun on an SDS-polyacrylamide gel, it partially dissociated to yield a smaller protein having a molecular mass of 12.4 kD (Fig. 3C, lane 2).
Figure 3.
SDS-PAGE analysis of boiling-soluble proteins in aspen. Total protein extract and boiling-soluble protein fraction were subjected to either 15% (w/v) Gly-SDS-PAGE or 17% (w/v) Tricine-SDS-PAGE, and were visualized by either Coomassie Blue staining or western-blot analysis. A, Fifteen micrograms of total aspen proteins (lane 1, equivalent to 0.15 μg of SP1) or 200 μg of total boiling-soluble proteins (lane 2, equivalent to 2 μg of SP1) were separated by 15% (w/v) Gly-SDS-PAGE, and visualized by western-blot analysis using antirecombinant SP1 antibodies. B, Four hundred micrograms of total boiling-soluble proteins was separated on 17% (w/v) Tricine-SDS-PAGE, then stained with Coomassie Blue. C, Electro-eluted 12.4-kD (lane 1) and 116-kD (lane 2) proteins were reseparated by 17% (w/v) Tricine-SDS-PAGE, then stained with Coomassie Blue.
Two-Dimensional PAGE Analysis of SP1
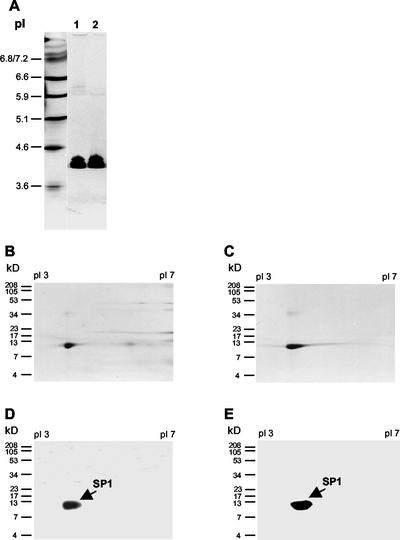
To better separate and characterize the low- and high-molecular mass SP1 species, two-dimensional PAGE of purified 12.4- and 116-kD proteins, as well as total boiling-soluble proteins, were studied. Electro-eluted 12.4- and 116-kD proteins were first resolved in an isoelectric focusing (IEF) gel (pH 3–7). IEF markers were run in parallel on the same gel. As demonstrated in Figure 4A, both the 12.4- and 116-kD proteins were focused at the same pI, about 4.3. Gel slices, which carried focused proteins, were then separated by 17% (w/v) Tricine-SDS-PAGE and stained with Coomassie Blue. Both the 12.4- and 116-kD proteins were detected in the same position, at 12.4 kD (Fig. 4, B and C), indicating the identity between these two proteins with respect to their pI and Mr. The lack of high-molecular mass protein signal by Coomassie Blue staining may indicate the disassociation of SP1 oligomer in the presence of the SDS. Western-blot analysis of a two-dimensional gel containing focused total soluble (Fig. 4D) and total boiling-soluble (Fig. 4E) proteins, using anti-recombinant-SP1 antibodies, revealed strong signals at pI 4.3 corresponding to the size of 12.4 kD. These results suggested that both 12.4- and 116-kD protein bands are composed of the same subunits.
Figure 4.
Two-dimensional PAGE analysis of SP1. Proteins and IEF markers were first focused on an IEF gel (pH 3–7) and stained with Coomassie Blue; gel slices containing focused proteins were then subjected to additional SDS-PAGE. Proteins in SDS gels were visualized by either Coomassie Blue staining or western-blot analysis. A, Ten micrograms of electro-eluted 12.4- (lane 1) and 116- (lane 2) kD protein was resolved on an IEF gel (pH 3–7). IEF markers were run in parallel on the same gel. The pI of the markers is indicated on the figure. Gel slices that carried focused 12.4- (B) and 116- (C) kD proteins were further separated by 17% (w/v) Tricine-SDS-PAGE and stained with Coomassie Blue. Western-blot analysis of second-dimension gels containing focused total soluble (D) and total boiling-soluble (E) proteins using antirecombinant SP1 antibodies.
Peptide Map (V8) of Eluted 12.4- and 116-kD Proteins
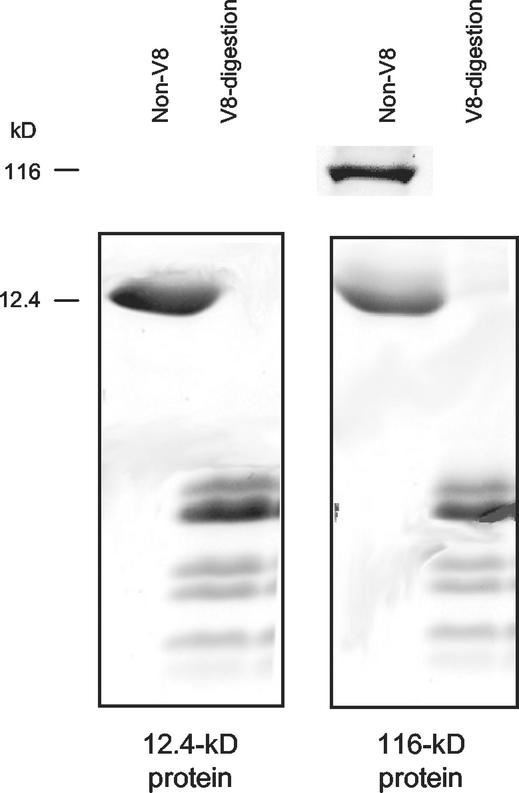
Peptide mapping by limited V8 proteolysis in SDS was conducted to further study the relationship between the 12.4- and 116-kD proteins. The proteins were collected by excision of gel slice from a preparative 17% (w/v) Tricine-SDS-polyacrylamide gel, electro-eluted (or directly used without prior elution), and digested with Staphylococcus aureus V8 protease. V8 digestion of the 12.4- and 116-kD proteins resulted in an identical pattern of peptide fragments (Fig. 5). Thus, the 116-kD protein appeared to be an oligomeric species of the 12.4-kD protein.
Figure 5.
S. aureus V8 protease digestion patterns of aspen 116- and 12.4-kD proteins. Electro-eluted 116- and 12.4-kD proteins (10 μg each) were first boiled for 2 min in SDS-containing (0.5% [w/v] SDS) V8 digestion buffer, then incubated with (V8-digestion) or without (Non-V8) 25 μg mL−1 V8 protease for 1 h at 37°C. The digestion mixture was then prepared in SDS sample buffer, and boiled for 5 min before separating on a 17% (w/v) Tricine-SDS-polyacrylamide gel (20 × 20 cm), and staining with Coomassie Blue.
N-Terminal Sequence and Amino Acid Analysis of 12.4- and 116-kD Proteins
N-terminal sequencing of the electro-eluted 12.4-kD protein revealed a 13-amino acid sequence identical to that of the sp1 cDNA-encoded protein. The electro-eluted 116-kD protein was “converted” to the much smaller 12.4-kD species by SDS-PAGE (Fig. 3C, lane 2). N-terminal sequence analysis of that protein revealed an amino acid sequence identical to that of the sp1 cDNA-encoded protein (Fig. 1A). To clarify whether SP1 is a hetero- or homo-oligomer, the 12.4- and 116-kD proteins were subjected to hydrolysis and their amino acid composition determined. The amino acid composition of these two proteins was nearly identical to that of the sp1 cDNA-encoded protein (Table I), suggesting that SP1 is a homo-oligomeric protein.
Table I.
Amino acid composition of SP1 cDNA-encoded protein, 12.4-kD protein, and 116-kD protein
| Amino Acid Residues | cDNA-Encoded Protein | 12.4-kD Protein | 116-kD Protein |
|---|---|---|---|
| Asp + Asn | 12 | 14 | 14 |
| Ser | 8 | 8 | 8 |
| Glu + Gln | 11 | 13 | 13 |
| Thr | 10 | 11 | 10 |
| Gly | 5 | 6 | 6 |
| Arg | 5 | 5 | 5 |
| Ala | 9 | 9 | 9 |
| Tyr | 6 | 6 | 6 |
| Pro | 3 | 3 | 3 |
| Met | 3 | 2 | 2 |
| Val | 2 | 2 | 2 |
| Phe | 7 | 7 | 7 |
| Ile | 5 | 5 | 5 |
| Leu | 14 | 16 | 14 |
| His | 2 | 2 | 2 |
| Lys | 5 | 5 | 5 |
| Trp | 1 | 0 | 0 |
| Total | 108 | 114 | 111 |
Size Estimation of the Native SP1
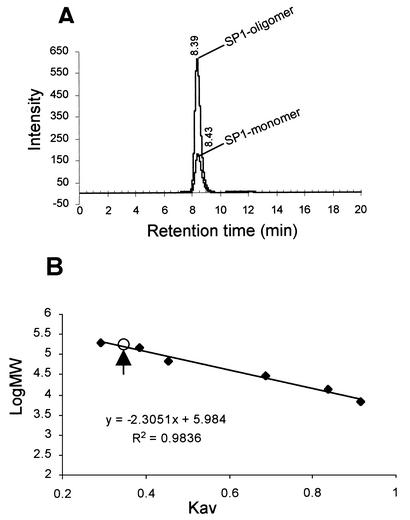
The oligomeric state was estimated by gel filtration HPLC. Electro-eluted plant 12.4-kD protein (SP1-monomer form) and 116-kD protein (SP1-oligomer form) were applied to a TSK2000 gel filtration HPLC column. Both proteins, eluted from the low-molecular mass bands (12.4 kD) or from the high-molecular mass bands (116 kD), appeared as single peaks at the same retention time (Fig. 6A). The oligomeric form was further estimated on a TSK3000 column. Electro-eluted high-molecular mass SP1 (116 kD) appeared as a single peak at about 9.8 min. This peak, as calculated from a standard curve (Fig. 6B), corresponded to a molecular mass of 144.9 ± 1.54 kD (data are averages of four protein samples), which is 11.7 (about 12 units) of SP1 monomer (12.369 kD). Similar results were obtained for the electro-eluted 12.4-kD protein (data not shown).
Figure 6.
Size estimation of SP1 by gel filtration HPLC. A, Chromatogram of electro-eluted SP1 protein. Electro-eluted 12.4- and 116-kD SP1 proteins were applied to a TSK2000 column. The retention times for these two proteins are indicated. The chromatogram was integrated from two separate chromatograms of 12.4- and 116-kD SP1. B, Molecular mass standard curve of a TSK3000 column. The calibration curve was obtained by plotting the logarithms of the Mrs of standard proteins (see “Materials and Methods”) against their respective elution parameter (Kav). R2 volume was calculated by the method of least squares and is shown on the figure. The Kav value of SP1 (0.357) is shown by arrow.
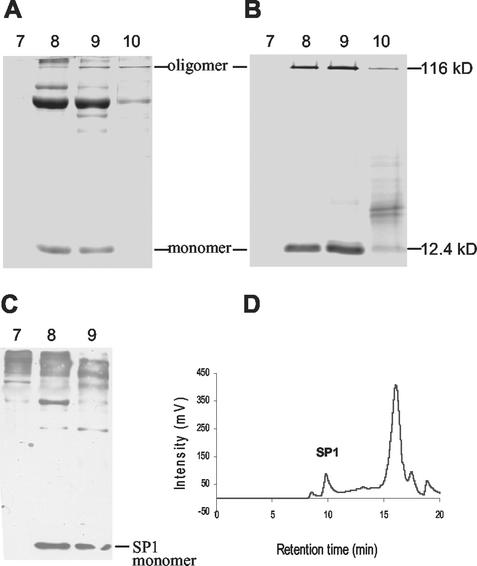
Total aspen protein extract, or total boiling-soluble proteins of the same extract, was separated on a TSK3000 column. The eluted fractions were analyzed by SDS-PAGE. Total protein extract contained SP1 in the 8- to 10-min fractions, as shown by Coomassie Blue staining (Fig. 7A), and confirmed by western-blot analysis using anti-116-kD native SP1 antibodies (Fig. 7C). A similar pattern was observed for the boiling-soluble fraction (Fig. 7B). A peak at about 9.8 min was observed, corresponding to a size of 145 kD as calculated from the molecular mass standard curve (Fig. 7D). SP1 monomer was not detected by gel filtration HPLC. These results indicated that the native form of SP1 exists as a high-order oligomeric complex.
Figure 7.
Native form of SP1 in aspen plants. Aspen total soluble protein extract (A) or total boiling-soluble proteins (B) of the same extract were applied to the TSK3000 column. The collected fractions were subjected to 17% (w/v) Tricine-SDS-PAGE and stained with Coomassie Blue. Fraction numbers are shown on the top of the gels. SP1 oligomer and monomer and their Mrs are indicated. C, Western-blot analysis of the fractions from A using anti-116-kD native SP1 antibodies. D, Chromatogram of total boiling-soluble proteins.
DISCUSSION
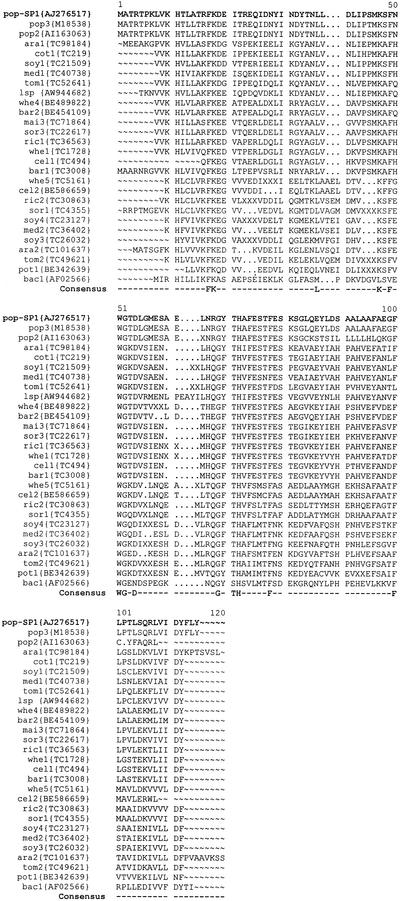
sp1 was isolated by screening an expression library derived from a water-stressed aspen plant using antibody against BspA, a stress-responsive protein (Pelah et al., 1995). No sequence homology was found between SP1 and any protein with known function. However, more than 100 sequences were retrieved and found to share significant homology with SP1 (Fig. 8). These homologous sequences were from many phylogenetically remote (taxonomically distant) plant species, e.g. poplar, Arabidopsis, tomato, cotton, soybean, M. truncatula, leafy spurge, wheat, barley, maize, sorghum, and rice. There were also many sequences from other organisms (such as bacteria and viruses) sharing different degree of homology with SP1. One SP1 homolog in bacteria (V. cholerae), a hypothetical 11.2-kD protein (EMBL accession no. AF025662), was found to share 36% similarity with SP1 (Fig. 8), indicating that this putative protein family is spread over a wide range of different genomes. In addition, one sp1 homolog (EMBL accession no. X55440) from poplar has been claimed to be related to wound stress, implying a possible common involvement of this gene family in stress phenomena.
Figure 8.
Multiple sequence alignment of 26 translated sequences with SP1 protein. DNA sequences that share homology with SP1 were retrieved using SP1 protein sequence against nucleotide sequences (program tblastn; http://blast.wustl.edu) from different database sources. Parts of the peptide sequences from those retrieved sequences were further aligned with SP1 using GCG “pileup” and “pretty” programs (Wisconsin Package Version 9.1, Genetics Computer Group-GCG). The consensus amino acids were calculated based on 26 sequences of a total 28 sequences (some of the sequences present in the multiple alignments were truncated). pop-SP1, Populus tremula; pop3, Populus trichocarpa × P. deltoides; popd, P. tremula × P. tremuloides; ara, Arabidopsis; cot, cotton (Gossypium arboreum); soy, soybean (Glycine max); med, Medicago truncatula; tom, tomato (Lycopersicon esculentum); lsp, leafy spurge (Euphorbia esula); whe, wheat (Triticum aestivum); bar, barley (Hordeum vulgare); mai, maize (Zea mays); sor, sorghum (Sorghum bicolor); ric, rice (Oryza sativa); cel, Secale cereale; pot, potato (Solanum tuberosum); bac, bacterium (Vibro cholerae). EMBL accession or expressed sequence tag number is given with each sequence.
Sequence analysis revealed the conservation of 13 amino acids in 26 of 28 cited sequences (Fig. 8). Among them, Phe (F), a hydrophobic amino acid, is conserved four times at positions 17, 49, 78, and 100. A consensus motif of “K-F-WG-D” is found located in the middle of the sequences. In addition, a hydrophobic tail at the C terminus is shown, most commonly present as a combination of L, V, I, F, M, and A. The significance of these conserved amino acids and regions to the structure and function of this putative protein family remains to be investigated.
Northern-blot analysis revealed that sp1 transcript is expressed under non-stress conditions in aspen plants, but its level is altered in response to a number of environmental stimuli (Fig. 2). Commonly, stress-responsive proteins, such as LEA-type proteins and Hsps, are not expressed in the absence of stress stimuli. However, exceptional cases have been reported. For example, dhnX, a dehydrin, was found to constitutively express, and did not respond to the stress conditions tested (Welin et al., 1994). Small Hsps (sHsps) from the resurrection plant Craterostigma plantagineum are expressed constitutively in vegetative tissues (Alamillo et al., 1995). This phenomenon may suggest further posttranscriptional regulation of the stress-responsive gene, and the plant may benefit from early protection against the stress. sp1 transcript was up-regulated by NaCl, cold, and heat, by 2- to 5-fold over that of non-treated plants. In addition, relatively high sp1 transcript levels were maintained during the process of stress recovery, e.g. rehydration from desiccation and recovery from salt and cold stresses (Fig. 2, A and E), suggesting that sp1 may associate with repair of cellular damage.
When control aspen plants were transferred from the agar culture medium to LM or water, increased levels of sp1 transcript were detected (Fig. 2, B and C). Hence, it appears that the hypo-osmotic shock induced sp1 transcript. In an earlier report on rd29 (responsive to desiccation) gene expression (Yamaguchi-Shinozaki and Shinozaki, 1993), rd29 mRNA appeared to be induced by transferring plants from medium with low osmotic potential to high osmotic potential, and vice versa. A high concentration (250 mm) or long-term treatment with NaCl and mannitol caused down-regulation of sp1 transcript, which may have resulted from the toxic effect of NaCl or from osmotic shock.
Many stress-associated genes, particularly LEA/dehydrin genes, are responsive to exogenous ABA application (Skriver and Mundy, 1990; Bray et al., 1993). However, ABA application did not modify sp1 transcript level significantly (Fig. 2C) in our experiments. The effect of cycloheximide treatment resulted on reducing sp1 level and became significant after 24 h, indicating an indirect effect. These results suggest that sp1 is probably regulated by an ABA-independent pathway (Thomashow, 1999; Shinozaki and Yamaguchi-Shinozaki, 2000; Knight and Knight, 2001), which could be partially blocked by cyclo-heximide.
Using antibodies against recombinant SP1, SP1 was detected in total aspen extract and in the boiling-soluble fraction of that extract (Figs. 3 and 4), demonstrating that SP1 remains soluble upon boiling. The high level of SP1 expression was estimated to consist of about 1% of the total plant proteins (data not shown), which is comparable with the level of LEA/dehydrin protein accumulation during embryo maturation and under stress (Ceccardi et al., 1994; Campbell and Close, 1997). Hydropathy plots of SP1 showed it to be a generally hydrophilic protein (Fig. 1C). Overwhelmingly, LEA/dehydrin proteins are hydrophilic (Garay-Arroyo et al., 2000), and many of them are known to possess the ability to remain soluble after 10 to 20 min of boiling (Close et al., 1989; Lin et al., 1990; Neven et al., 1993). Although no sequence homology was found between SP1 and LEA proteins, they are stress responsive, hydrophilic, and boiling soluble.
The data presented here clearly show that SP1 forms an oligomer. First, SP1 was detected as a 12.4-kD protein, which is in agreement with its size encoded by sp1 cDNA. Then, we found that purified SP1 ran on SDS-polyacrylamide gels in two different forms, 12.4 and 116 kD. Our further studies on these two forms, using two-dimensional PAGE, comparative protease digestion, amino acid analysis, and N-terminal sequencing, revealed that SP1 is a homo-oligomeric protein (Figs. 1, 4, and 5; Table I). In addition to the 12.4- and 116-kD forms of SP1 in SDS-PAGE, molecular mass estimations by gel filtration HPLC revealed that SP1 is of 145 kD in its native form, which corresponds to about 12 (11.7) subunits of 12.4-kD SP1 polypeptide (Figs. 6 and 7). The complex form of SP1 estimated by SDS-PAGE is 116 kD. The discrepancy in the size estimations from gel filtration chromatography and SDS-PAGE is probably due to the effects of SDS, which breaks down the SP1 large complex into its more stable forms. Thus, 116-kD SP1 in SDS-polyacrylamide gel may be an SDS-stable form of native SP1.
It has been suggested previously that LEA-type proteins exist largely as unfolded structures in their native state (McCubbin et al., 1985; Ceccardi et al., 1994; Lisse et al., 1996; Garay-Arroyo et al., 2000); only a few of the LEA-type proteins have been found to form dimers or tetramers (Dure, 1993a; Ceccardi et al., 1994; Kazuoka and Oeda, 1994), and no higher order oligomers have been found. Oligomerization, however, is characteristic of Hsps. Hsps are found in all organisms exposed to stress temperatures, and many Hsps possess molecular chaperone activities, which involve in the proper folding of nascent polypeptides and in helping damaged proteins regain their biologically active conformation (Hartl, 1996). No sequence homology between SP1 and published Hsps has yet been found; however, evidence of SP1 responsiveness to stress (including heat shock) and its oligomeric structure suggest a potential similarity between these two proteins. Judging by the size class of its monomer (12.4 kD), SP1 may share similar structural and functional characteristics with the sHsps (molecular mass ranging from 12–40 kD) that are abundant in plants (Vierling, 1991). Accumulating evidence shows that plant sHsps are not only expressed in response to heat shock, but also upon water, salt, and oxidative stress and at low temperature (Almoguera et al., 1993; Alamillo et al., 1995; Sabehat et al., 1998; Härndahl et al., 1999; Hamilton and Heckathorn, 2001). sHsps are also involved in many developmental processes (for review, see Waters et al., 1996) and are likely to function in diverse directions.
In conclusion, SP1 shares some of the characteristics of two major groups of stress-responsive proteins: They are hydrophilic and remain soluble upon boiling like LEA-type proteins, and exhibit the oligomeric structure of sHsps, representing a new class of plant proteins involved in the plant's response to abiotic stress. The physiological function of this protein in plant stress tolerance is currently being studied.
MATERIALS AND METHODS
cDNA Cloning
Polyadenylated [poly(A+)] RNA extraction was performed according to Bartels and Thompson (1983) from water-stressed aspen (Populus tremula) shoots, and the mRNA was used as a template for cDNA synthesis. A lambda ZAPII (Stratagene, La Jolla, CA) cDNA library was constructed according to the supplier's instructions, and immunoscreened with BspA polyclonal antibodies (diluted 1:500 [v/v]; Pelah et al., 1995). In vivo excision was performed according to manufacturer's instructions and the sequence was determined (Sequencing Lab, The Weizmann Institute of Science, Rehovot, Israel).
Stress Treatments of Plants
Intact aspen plantlets (4–5 weeks after subculturing) were used in all treatments. For desiccation and rehydration, plantlets were removed from semisolid medium, wilted at room temperature to 80% and 70% (corresponding to 20% and 30% water loss, respectively) of their initial fresh weight, and kept in a closed plastic bag for an additional 3 h. Plantlets wilted to 70% of their initial fresh weight were then rehydrated by immersing their roots in distilled water for 1, 4, or 24 h. It took about 10 and 15 min for plantlets to wilt to 80% and 70%, respectively. Wilted plantlets (70%) did not fully rehydrate after 4 h, but almost regained their initial fresh weight during the 24-h rehydration period (approximately 95%). For NaCl, mannitol, ABA, and cycloheximide treatments, 150 or 250 mm NaCl, 8% or 12% (w/v) mannitol, 100 μm ABA, 3.5 μm cycloheximide, or 100 μm ABA plus 3.5 μm cycloheximide were incorporated into LM. Treatments were applied by removing plantlets from semisolid medium and immersing the root system in vials containing aspen LM plus the individual components (hydroponically) for the length of time indicated in Figure 2, B and C. LM and distilled water were used as controls. For temperature treatments, vials with intact plantlets were kept at 4°C, or at 38°C or 40°C for the length of time indicated in Figure 2, A and D. Shoots from non-treated (0 time) and treated plantlets were harvested, frozen in liquid nitrogen at the end of each treatment, and used for northern-blot analysis. For recovery from salt and cold stress, plantlets that subjected to 150 mm NaCl for 8 h were transferred to LM for 8 and 24 h. Plantlets that exposed to cold (4°C) for 8 h were moved back to room temperature (24°C) for 8 and 24 h.
RNA Extraction and Northern-Blot Analysis
Total RNA was extracted using TRI REAGENT (Molecular Research Center, Inc., Cincinnati) from non-stressed and stressed plants according to the supplier's instructions. Total RNA (10 or 20 μg) was separated on a 1.5% (w/v) formaldehyde-agarose gel, and blotted onto a Hybond N+ nylon membrane (Amersham, Piscataway, NJ). Full-length sp1 cDNA (approximately 570 bp) was labeled with [32P]dCTP using a Megaprime random primer labeling kit (Amersham). A standard hybridization protocol was run (Sambrook et al., 1989). Autoradiography was carried out at −70°C with x-ray films using intensifying screens. In some experiments, a 23S ribosomal DNA probe was used to hybridize the same membrane after stripping to monitor total RNA load.
Recombinant SP1 Expression, Antirecombinant- SP1, and Anti-116-kD Native SP1 Antibodies Preparation
sp1 cDNA was cloned into pET-CBD-180 (Shpigel et al., 1999) expression vector by employing two primers carrying an NcoI site and a BamHI at 5′ and 3′, respectively, of the corresponding open reading frame of sp1 cDNA. The resulting plasmid (pET-CBD-180-SP1) was used to transform Escherichia coli strain BL21 (DE3). Recombinant CBD-fused SP1 protein was expressed in BL21 (DE3) by addition of isopropyl β-d-thiogalactoside to a final concentration of 1 mm to mid-log phase of the bacterial culture, after 5 additional h of induction at 37°C. Recombinant CBD-SP1, a 32.4-kD protein (20-kD CBD + 12.4-kD SP1), was verified by SDS-PAGE (data not shown), and was purified on cellulose beads, taking advantage of the affinity of CBD to cellulose (Shpigel et al., 1999). A highly purified CBD-fused SP1 protein was obtained. This protein was used to raise anti-CBD-SP1 antibodies. Purified CBD-SP1 (50 μg) was injected with TiterMax adjuvant (CytRx Corporation, Norcross, GA) into rabbits (ANILAB, Rehovot, Israel), followed 4 weeks later by a booster injection of 50 μg of protein mixed with the same adjuvant. Rabbit serum was collected 3 weeks later. To extract anti-SP1 antibody from a mixture of anti-CBD and anti-SP1 antibodies, CBD protein (CBD-Technologies Ltd., Rehovot, Israel) was added to the antiserum at a ratio of 2.5:1 (w/v), then incubated at room temperature with gentle agitation for 30 min. Precipitated anti-CBD/CBD complex was removed by centrifugation at 10,000g for 5 min. An optimized western-blot procedure, using these antibodies, was used in further work.
The protein band corresponding to the 116-kD native SP1 oligomer was excised from 17% (w/v) Tricine-SDS-polyacrylamide gel. A gel slice that carried about 50 μg of SP1 oligomer was homogenized and injected into rabbits (Antibody Laboratory, Weizmann Institute of Sciences). Antiserum was obtained 6 weeks later.
Protein Extraction and Detection of SP1
Total soluble proteins of aspen plantlet shoots were extracted as described previously (Pelah et al., 1995, 1997). Protein extracts, prepared as total soluble fraction and boiling-soluble fraction (plant protein extract was boiled for 10 min in a boiling water bath), were then separated by either one-dimensional 15% (w/v) Gly-SDS-PAGE or 17% (w/v) Tricine-SDS-PAGE (Schägger and Jagow, 1987), or by IEF gel (NOVEX, San Diego), followed by SDS-PAGE. Proteins were visualized by Coomassie Blue staining, or transferred to a nitrocellulose membrane (Schleicher & Schuell, Dassel, Germany). Western-blot analysis was performed using antirecombinant SP1 polyclonal antibodies (anti-CBD-SP1). The protein was visualized using an anti-rabbit IgG antibody conjugated to horseradish peroxidase (Sigma-Aldrich Israel Ltd., Rehovot, Israel), and a chemiluminescence western-blotting detection system (SuperSignal, Pierce, Rockford, IL). Incubation with pre-immune sera did not give appreciable signal.
Plant SP1 Protein Purification
Acetone-precipitated boiling-soluble proteins (from non-stressed plants) were dissolved in 1× Tricine-SDS sample buffer (100 mm Tris-HCl [pH 6.8], 20% [v/v] glycerol, 1% [w/v] SDS, and 0.025% [w/v] Coomassie Blue G-250), then separated on a preparative 17% (w/v) Tricine-SDS-polyacrylamide gel. The bands corresponding to SP1's 116-kD oligomer form and 12.4-kD monomer form were excised from the gel. SP1 oligomer and monomer were electro-eluted separately, in a dialysis bag. The eluent was further dialyzed against 500× 10 mm Tris-HCl (pH 7.5) overnight at 4°C, followed by acetone precipitation and centrifugation. Purified SP1 was obtained by dissolving the pellet in 10 mm Tris-HCl (pH 7.5). Protein concentration was determined by a protein assay kit (Bio-Rad, Hercules, CA) using bovine serum albumin as the standard.
V8 Digestion of SP1
The 12.4- and 116-kD bands were excised from a 17% (w/v) preparative Tricine-SDS-polyacrylamide gel, and used directly in the gel for Staphylococcus aureus V8 protease (Sigma-Aldrich Israel Ltd.) digestion, or electro-eluted as already described, then digested with V8 protease according to Cleveland et al. (1977). The resultant peptides were subjected to 17% (w/v) Tricine-SDS-PAGE.
Amino Acid Analysis and Sequencing of SP1
Electro-eluted SP1 oligomer (116-kD) and monomer (12.4-kD) proteins (10-μg aliquots) were separated by 15% (w/v) Tricine-SDS-PAGE, then transferred to a polyvinylidene difluoride membrane (Bio-Rad) according to the manufacturer's instructions. The membrane was then stained briefly in a 3% (w/v) Ponceau S solution, and destained in a large volume of distilled deionized water. Protein bands on the polyvinylidene difluoride membrane were traced with a sharp blade. Amino acid analysis was conducted (Life Science Institute, Hebrew University of Jerusalem), as well as an N-terminal protein sequence (Biological Service Center, The Weizmann Institute of Science).
Gel Filtration HPLC and Native SP1 Detection
An HPLC system (Merck-Hitachi, Darmstadt, Germany) equipped with either TSKSWX2000 or TSKSWX3000 (30-cm × 7.8-mm) columns (SUPELCO, Sigma-Aldrich Israel Ltd.) was employed to study the native state of SP1. A 100-μL aliquot of total soluble protein extract or the total boiling-soluble fraction of the same extract from water-stressed aspen plants was separated using phosphate-buffered saline buffer at pH 6.6. The flow rate was adjusted to 0.8 mL min−1 and a UV monitor was used (280 nm). Fractions were collected every minute. Each fraction was further concentrated by adding four volumes of cold acetone, followed by 10-min centrifugation at 10,000g. The resultant pellets were dissolved in 1× SDS-sample buffer. An aliquot was subjected to 17% (w/v) Tricine-SDS-PAGE, and the resultant protein profiles were either visualized by Coomassie Blue staining or western-blot analysis using anti-116-kD-native SP1 antibodies. Electro-eluted plant SP1 oligomer and monomer were also analyzed. To determine the size of the protein, cytochrome C (12.4 kD), carbonic anhydrase (29 kD), bovine serum albumin (66 kD), alcohol dehydrogenase (150 kD), β-amylose (200 kD), and apoferritin (443 kD) (Sigma-Aldrich Israel Ltd.) were used as molecular standards. Blue dextran (2000 kD) was used to evaluate the void volume of the column. A linear relationship was obtained by plotting the logarithms of the Mrs of standard proteins against their respective elution parameters (Kav), calculated according to the equation:
 |
where Ve = elution volume of the protein, Vo = column void volume, and Vt = total packed bed volume.
ACKNOWLEDGMENT
We thank Dr. Arie Goldlust of CBD-Technologies Ltd. (Rehovot, Israel) for assistance with the gel filtration HPLC.
Footnotes
This work was supported by the European Union (grant nos. INCO–IC18–CT97–0200–FORADAPT and QLK5–2000–01377–ESTABLISH), by the Israel-India Biotechnology Research Fund, and by the Chief Scientist, Israel Ministry of Agriculture.
Article, publication date, and citation information can be found at www.plantphysiol.org/cgi/doi/10.1104/pp.002436.
LITERATURE CITED
- Alamillo J, Almoguera C, Bartels D, Jordano J. Constitutive expression of small heat shock proteins in vegetative tissues of the resurrection plant Craterostigma plantagineum. Plant Mol Biol. 1995;29:1093–1099. doi: 10.1007/BF00014981. [DOI] [PubMed] [Google Scholar]
- Almoguera C, Coca MA, Jordano J. Tissue-specific expression of sunflower heat shock proteins in response to water stress. Plant J. 1993;4:947–958. [Google Scholar]
- Bartels D, Thompson RD. The characterization of cDNA clones coding for wheat storage proteins. Nucleic Acids Res. 1983;11:2961–2978. doi: 10.1093/nar/11.10.2961. [DOI] [PMC free article] [PubMed] [Google Scholar]
- Bohnert HJ, Sheveleva E. Plant stress adaptations: making metabolism move. Curr Opin Plant Biol. 1998;1:267–274. doi: 10.1016/s1369-5266(98)80115-5. [DOI] [PubMed] [Google Scholar]
- Boston RS, Viitanen PV, Vierling E. Molecular chaperones and protein folding in plants. Plant Mol Biol. 1996;32:191–222. doi: 10.1007/BF00039383. [DOI] [PubMed] [Google Scholar]
- Bray EA. Molecular responses to water deficit. Plant Physiol. 1993;103:1035–1040. doi: 10.1104/pp.103.4.1035. [DOI] [PMC free article] [PubMed] [Google Scholar]
- Bray EA, Moses MS, Imai R, Cohen A, Plant AL. Regulation of gene expression by endogenous abscisic acid during drought stress. In: Close TJ, Bray EA, editors. Plant Response to Cellular Dehydration during Environmental Stress. Rockville, MD: American Society of Plant Physiologists; 1993. pp. 167–176. [Google Scholar]
- Campbell SA, Close TJ. Dehydrins: genes, proteins, and associations with phenotypic traits. New Phytol. 1997;137:61–74. [Google Scholar]
- Ceccardi TL, Meyer NC, Close TJ. Purification of a maize dehydrin. Prot Exp Purif. 1994;5:266–269. doi: 10.1006/prep.1994.1040. [DOI] [PubMed] [Google Scholar]
- Cleveland DW, Fischer SG, Kirschner MW, Laemmli UK. Peptide mapping by limited proteolysis in sodium dodecyl sulfate and analysis by gel electrophoresis. J Biol Chem. 1977;252:1102–1106. [PubMed] [Google Scholar]
- Close TJ. Dehydrins: emergence of a biochemical role of a family of plant dehydration proteins. Physiol Plant. 1996;97:795–803. [Google Scholar]
- Close TJ, Kortt AA, Chandler PM. A cDNA-based comparison of dehydration-induced proteins (dehydrins) in barley and corn. Plant Mol Biol. 1989;13:95–108. doi: 10.1007/BF00027338. [DOI] [PubMed] [Google Scholar]
- Cushman JC, Bohnert HJ. Genomic approaches to plant stress tolerance. Curr Opin Plant Biol. 2000;3:117–124. doi: 10.1016/s1369-5266(99)00052-7. [DOI] [PubMed] [Google Scholar]
- Dure IIIL. Structural motifs in Lea proteins. In: Close TJ, Bray EA, editors. Plant Response to Cellular Dehydration during Environmental Stress. Rockville, MD: American Society of Plant Physiologists; 1993a. pp. 91–103. [Google Scholar]
- Dure IIIL. A repeating 11-mer amino acid motif and plant desiccation. Plant J. 1993b;3:363–369. doi: 10.1046/j.1365-313x.1993.t01-19-00999.x. [DOI] [PubMed] [Google Scholar]
- Garay-Arroyo A, Colmenero-Flores JM, Garciarrubio A, Covarrubias AA. Highly hydrophilic proteins in prokaryotes and eukaryotes are common during conditions of water deficit. J Biol Chem. 2000;275:5668–5674. doi: 10.1074/jbc.275.8.5668. [DOI] [PubMed] [Google Scholar]
- Goldman A, Engelman DM, Steiz TA. Identifying nonpolar transbilayer helices in amino acid sequences of membrane proteins. Annu Rev Biophys Chem. 1986;15:321–353. doi: 10.1146/annurev.bb.15.060186.001541. [DOI] [PubMed] [Google Scholar]
- Hamilton EW, III, Heckathorn SA. Mitochondrial adaptations to NaCl. Complex I is protected by anti-oxidants and small heat shock proteins, whereas complex II is protected by proline and betaine. Plant Physiol. 2001;126:1266–1274. doi: 10.1104/pp.126.3.1266. [DOI] [PMC free article] [PubMed] [Google Scholar]
- Härndahl U, Hall RB, Osteryoung KW, Vierling E, Bornman JF, Sundby C. The chloroplast small heat shock protein undergoes oxidation-dependent conformational changes and may protect plants from oxidative stress. Cell Stress Chaperones. 1999;4:129–138. doi: 10.1379/1466-1268(1999)004<0129:tcshsp>2.3.co;2. [DOI] [PMC free article] [PubMed] [Google Scholar]
- Hartl FU. Molecular chaperones in cellular protein folding. Nature. 1996;381:571–579. doi: 10.1038/381571a0. [DOI] [PubMed] [Google Scholar]
- Hoekstra FA, Golovina EA, Buitink J. Mechanisms of plant desiccation tolerance. Trends Plant Sci. 2001;6:431–438. doi: 10.1016/s1360-1385(01)02052-0. [DOI] [PubMed] [Google Scholar]
- Ingram J, Bartels D. The molecular basis of dehydration tolerance in plants. Annu Rev Plant Physiol Plant Mol Biol. 1996;47:377–403. doi: 10.1146/annurev.arplant.47.1.377. [DOI] [PubMed] [Google Scholar]
- Kazuoka T, Oeda K. Purification and characterization of COR85-oligomeric complex from cold-acclimated spinach. Plant Cell Physiol. 1994;35:601–611. [Google Scholar]
- Knight H, Knight MR. Abiotic stress signalling pathways: specificity and cross-talk. Trends Plant Sci. 2001;6:262–267. doi: 10.1016/s1360-1385(01)01946-x. [DOI] [PubMed] [Google Scholar]
- Lin C, Guo WW, Everson E, Thomashow MF. Cold acclimation in Arabidopsis and wheat. Plant Physiol. 1990;94:1078–1083. doi: 10.1104/pp.94.3.1078. [DOI] [PMC free article] [PubMed] [Google Scholar]
- Lisse T, Bartels D, Kalbitzer HR, Jaenicke R. The recombinant dehydrin-like desiccation stress protein from the resurrection plant Craterostigma plantagineum displays no defined three-dimensional structure in its native state. Biol Chem. 1996;377:555–561. doi: 10.1515/bchm3.1996.377.9.555. [DOI] [PubMed] [Google Scholar]
- McCubbin WD, Kay CM, Lane BG. Hydrodynamic and optical properties of the wheat germ Em protein. Can J Biochem Cell Biol. 1985;63:803–811. [Google Scholar]
- Neven LG, Haskell DW, Hofig A, Li QB, Guy CL. Characterization of a spinach gene responsive to low temperature and water stress. Plant Mol Biol. 1993;21:291–305. doi: 10.1007/BF00019945. [DOI] [PubMed] [Google Scholar]
- Pelah D, Shoseyov O, Altman A. Characterization of BspA, a major boiling-stable, water-stress-responsive protein in aspen (Populus tremula) Tree Physiol. 1995;15:673–678. doi: 10.1093/treephys/15.10.673. [DOI] [PubMed] [Google Scholar]
- Pelah D, Wang WX, Altman A, Shoseyov O, Bartels D. Differential accumulation of water-stress related proteins, sucrose synthase and soluble sugars in Populus genotypes which differ in their water-stress response. Physiol Plant. 1997;99:153–159. [Google Scholar]
- Sabehat A, Lurie S, Weiss D. Expression of small heat-shock proteins at low temperatures. Plant Physiol. 1998;117:651–658. doi: 10.1104/pp.117.2.651. [DOI] [PMC free article] [PubMed] [Google Scholar]
- Sambrook J, Fritsch WF, Maniatis T. Molecular Cloning: A Laboratory Manual. Ed 2. Cold Spring Harbor, NY: Cold Spring Harbor Laboratory Press; 1989. [Google Scholar]
- Schägger H, Jagow GV. Tricine-sodium dodecyl sulfate-polyacrylamide gel electrophoresis for the separation of proteins in the range from 1 to 100 kD. Anal Biochem. 1987;166:368–379. doi: 10.1016/0003-2697(87)90587-2. [DOI] [PubMed] [Google Scholar]
- Serrano R, Mulet JM, Rios G, Marquez JA, de Larrinoa IF, Leube MP, Mendizabal I, Pascual-Ahuir A, Proft M, Ros R et al. A glimpse of the mechanisms of ion homeostasis during salt stress. J Exp Bot. 1999;50:1023–1036. [Google Scholar]
- Shinozaki K, Yamaguchi-Shinozaki K. Molecular responses to dehydration and low temperature: differences and cross-talk between two stress signaling pathways. Curr Opin Plant Biol. 2000;3:217–223. [PubMed] [Google Scholar]
- Shpigel E, Goldlust A, Efroni G, Avraham A, Eshel A, Dekel M, Shoseyov O. Immobilization of recombinant heparinase I fused to cellulose-binding domain. Biotechnol Bioeng. 1999;65:17–23. doi: 10.1002/(sici)1097-0290(19991005)65:1<17::aid-bit3>3.0.co;2-y. [DOI] [PubMed] [Google Scholar]
- Skriver K, Mundy J. Gene expression in response to abscisic acid and osmotic stress. Plant Cell. 1990;2:503–512. doi: 10.1105/tpc.2.6.503. [DOI] [PMC free article] [PubMed] [Google Scholar]
- Smirnoff N. Plant resistance to environmental stress. Curr Opin Biotechnol. 1998;9:214–219. doi: 10.1016/s0958-1669(98)80118-3. [DOI] [PubMed] [Google Scholar]
- Thomashow MF. Role of cold-responsive genes in plant freezing tolerance. Plant Physiol. 1998;118:1–7. doi: 10.1104/pp.118.1.1. [DOI] [PMC free article] [PubMed] [Google Scholar]
- Thomashow MF. Plant cold acclimation: freezing tolerance genes and regulatory mechanisms. Annu Rev Plant Physiol Plant Mol Biol. 1999;50:571–599. doi: 10.1146/annurev.arplant.50.1.571. [DOI] [PubMed] [Google Scholar]
- Vierling E. The role of heat shock proteins in plants. Annu Rev Plant Physiol Plant Mol Biol. 1991;42:579–620. [Google Scholar]
- Vierling E, Kimpel JA. Plant responses to environmental stress. Curr Opin Biotechnol. 1992;3:164–170. doi: 10.1016/0958-1669(92)90147-b. [DOI] [PubMed] [Google Scholar]
- Waters ER, Lee GJ, Vierling E. Evolution, structure and function of the small heat shock proteins in plants. J Exp Bot. 1996;47:325–338. [Google Scholar]
- Welin BV, Olson A, Nylander M, Palva ET. Characterization and differential expression of dhn/lea/rab-like genes during cold acclimation and drought stress in Arabidopsis thaliana. Plant Mol Biol. 1994;26:131–144. doi: 10.1007/BF00039526. [DOI] [PubMed] [Google Scholar]
- Yamaguchi-Shinozaki K, Shinozaki K. Characterization of the expression of a desiccation-responsive rd29 gene of Arabidopsis thaliana and analysis of its promoter in transgenic plants. Mol Gen Genet. 1993;236:331–340. doi: 10.1007/BF00277130. [DOI] [PubMed] [Google Scholar]
- Zhu JK. Plant salt tolerance. Trends Plant Sci. 2001a;6:66–71. doi: 10.1016/s1360-1385(00)01838-0. [DOI] [PubMed] [Google Scholar]
- Zhu JK. Cell signaling under salt, water and cold stresses. Curr Opin Plant Biol. 2001b;4:401–406. doi: 10.1016/s1369-5266(00)00192-8. [DOI] [PubMed] [Google Scholar]
- Zhu JK, Hasegawa PM, Bressan RA. Molecular aspects of osmotic stress in plants. Crit Rev Plant Sci. 1997;16:253–277. [Google Scholar]


