Abstract
A mutant of the NAD-malic enzyme-type C4 plant, Amaranthus edulis, which lacks phosphoenolpyruvate carboxylase (PEPC) in the mesophyll cells was studied. Analysis of CO2 response curves of photosynthesis of the mutant, which has normal Kranz anatomy but lacks a functional C4 cycle, provided a direct means of determining the liquid phase-diffusive resistance of atmospheric CO2 to sites of ribulose 1,5-bisphosphate carboxylation inside bundle sheath (BS) chloroplasts (rbs) within intact plants. Comparisons were made with excised shoots of wild-type plants fed 3,3-dichloro-2-(dihydroxyphosphinoyl-methyl)-propenoate, an inhibitor of PEPC. Values of rbs in A. edulis were 70 to 180 m2 s−1 mol−1, increasing as the leaf matured. This is about 70-fold higher than the liquid phase resistance for diffusion of CO2 to Rubisco in mesophyll cells of C3 plants. The values of rbs in A. edulis are sufficient for C4 photosynthesis to elevate CO2 in BS cells and to minimize photorespiration. The calculated CO2 concentration in BS cells, which is dependent on input of rbs, was about 2,000 μbar under maximum rates of CO2 fixation, which is about six times the ambient level of CO2. High re-assimilation of photorespired CO2 was demonstrated in both mutant and wild-type plants at limiting CO2 concentrations, which can be explained by high rbs. Increasing O2 from near zero up to ambient levels under low CO2, resulted in an increase in the gross rate of O2 evolution measured by chlorophyll fluorescence analysis in the PEPC mutant; this increase was simulated from a Rubisco kinetic model, which indicates effective refixation of photorespired CO2 in BS cells.
In C4 plants, atmospheric CO2 is fixed via phosphoenolpyruvate carboxylase (PEPC) in mesophyll cells into C4 acids, which are transported to bundle sheath (BS) cells where they serve as donors of CO2 to the C3 cycle via C4 acid decarboxylases (Kanai and Edwards, 1999). Photosynthetic carbon metabolism in C4 plants requires low rates of CO2 leakage from BS cells for CO2 to be concentrated around Rubisco in the BS chloroplasts. This favors CO2 fixation and minimizes photorespiration. However, the BS is not impermeable to gases because there is a need for metabolites to be exchanged between it and the mesophyll cells and for O2 generated during photosynthesis to be released. This permeability causes CO2 leakage from BS cells and results in a lower energetic efficiency of the CO2-concentrating mechanism.
Diffusive resistance of CO2 into BS cells (rbs) has been estimated by measuring photosynthetic rates under varying CO2 concentrations in isolated BS cells (Furbank et al., 1989) and in excised leaves fed a chemical inhibitor of the C4 cycle (Jenkins et al., 1989a; Brown and Byrd, 1993; Brown, 1997), or by applying models to experimental data related to the magnitude of photorespiration in C4 plants (He and Edwards, 1996). However, accurate determination of rbs is difficult; current estimates vary over a wide range from about 15 to 1,400 m2 s−1 mol−1 (for review, see He and Edwards, 1996).
BS-diffusive resistance is considered the major component that determines the CO2 leakage driven by the CO2 concentration gradient between BS and mesophyll cells. The rate of leakage of CO2 from the BS cells is equal to the rate of over-cycling of the C4 pathway (rate of C4 cycle minus rate of CO2 fixation by the C3 cycle). There is considerable variation in estimates of the fraction of CO2 leakage with various methods, ranging from 0.08 up to 0.5 when expressed as a fraction of C4 cycle activity (see He and Edwards, 1996). CO2 leakiness was determined for a number of species using an isotope discrimination method (Henderson et al., 1992) and a method involving analysis of 14CO2 release after its fixation (Hatch et al., 1995), with leakiness values ranging from 0.08 to 0.3.
The CO2 concentration in BS cells is dependent on rbs, the rate of C4 pathway over-cycling, and the CO2 diffusion gradient from BS to mesophyll cells. For a better understanding of C4 photosynthesis, it would also be valuable to know the actual CO2 concentration in BS chloroplasts, where CO2 assimilation takes place. A possible means of estimating this is to combine measurements of CO2 fixation with information on the kinetic properties of Rubisco. Ribulose 1,5-bisphosphate (RuBP) carboxylation and oxygenation in BS chloroplasts are competing reactions, and information is available on the Rubisco CO2 to O2 affinity ratio.
In this study, we have used the PEPC mutant of Amaranthus edulis LaC4 2.16 (Dever et al., 1995; Maroco et al., 1998a, 1998b), which has a defective C4 cycle and requires direct diffusion of atmospheric CO2 into the BS cells for CO2 assimilation and growth. In this mutant, the primary carboxylase for fixing atmospheric CO2 is Rubisco, which is located in the BS chloroplast. The purpose of this work was to use gas exchange measurements on the A. edulis mutant for direct estimation of BS cell resistance to CO2, and to determine the dependence of rbs on the developmental stage of the leaf. For comparison, data were also obtained with wild-type plants by feeding the PEPC inhibitor 3,3-dichloro-2-(dihydroxyphosphinoyl-methyl)-propenoate (DCDP) to prevent operation of the C4 cycle. In addition, we determined rates of CO2 fixation and gross rates of O2 evolution to analyze the effect of temperature on the cellular conductance to CO2 and the effects of CO2, light, and O2 on partitioning of electron flow and refixation of photorespired CO2.
RESULTS AND DISCUSSION
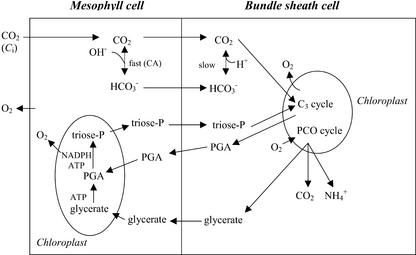
Figure 1 outlines important aspects of photosynthesis in the PEPC mutant of A. edulis relative to the experimental approach for determining the BS-diffusive resistance to CO2 (rbs). Because the C4 cycle is inoperative, the mechanism of CO2 fixation and energy requirements are considered the same as in C3 plants. Fixation of atmospheric CO2 in the mutant by Rubisco in the C3 cycle, requires diffusion of CO2 from the mesophyll to BS cells. CO2 is considered the primary species of inorganic carbon diffusing to BS cells and supplying CO2 to Rubisco. Although CO2 will be converted rapidly to bicarbonate in the cytosol of mesophyll cells via carbonic anhydrase, the diffusion pathway for bicarbonate will be limited because it is not used by Rubisco and BS cells lack, or have negligible levels of, carbonic anhydrase (Ku and Edwards, 1975). Also, in wild-type A. edulis, where CO2 is concentrated in the BS cells by the C4 cycle through C4 acid decarboxylation, CO2 is considered the primary form of inorganic carbon leaking from BS to mesophyll cells (Jenkins et al., 1989b). Reaction of O2 with RuBP in the photosynthetic carbon oxidation cycle in the BS chloroplasts will result in the production of the photorespiratory products glycerate, CO2, and ammonia through metabolism in mitochondria and peroxisomes. According to the known compartmentalization of carbon assimilation in C4 plants (Kanai and Edwards, 1999), the only function of mesophyll chloroplasts in carbon assimilation in the mutant may be the conversion of glycerate, the product of photorespiration in BS cells, to triose phosphate and conversion of some of the 3-phosphoglycerate (PGA), generated by Rubisco in BS cells, to triose phosphate.
Figure 1.
Schematic representation of the movement of gases and metabolites in the PEPC mutant of A. edulis. CO2 diffuses into BS cell chloroplasts where it enters the C3 cycle. Equilibrium between HCO3− and CO2 in mesophyll cell is fast, but it is slow in BS because of lack of carbonic anhydrase activity. Glycerate, ammonia, and CO2 are generated by the photosynthetic carbon oxidation (PCO) cycle. Glycerate metabolism and partial reduction of PGA in mesophyll cells may account for use of some photochemically generated energy in mesophyll chloroplasts.
BS-Diffusive Resistance to CO2 (rbs)
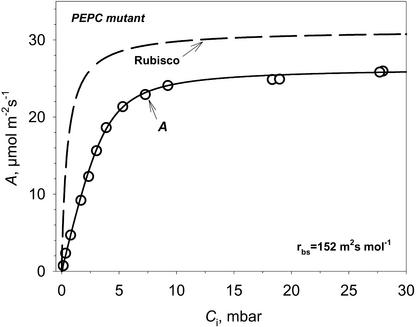
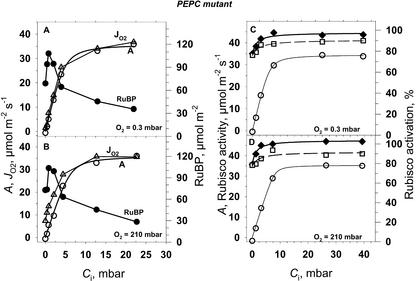
The resistances involved in uptake of atmospheric CO2 by the mutant are described in Equation 10 (“Materials and Methods”). If the CO2 response curve of CO2 assimilation (measured at light saturation) is plotted against the intercellular CO2 partial pressure (Ci), which equilibrates with the liquid phase at the cell wall, the initial slope of the curve is determined by the average physical liquid phase conductance and by the carboxylation efficiency of Rubisco (Fig. 2). Gas phase resistance to CO2, rs, was calculated based on transpiration measurements. Typical values of rs for the mutant plants were in the range of 5 to 10 m2 s−1 mol−1 (2–4 s cm−1). Also, the expected Rubisco CO2 response curve is shown in Figure 2 in the absence of liquid phase resistance; this demonstrates the contribution of the resistance of RuBP carboxylase (chemical resistance), rc, to the total CO2 flux resistance. The Rubisco response was generated taking the maximum velocity of RuBP carboxylase (Vc) as 1.2 times the CO2-saturated rate of CO2 fixation (Amax) based on Rubisco extractable activity measurements. Also, there is a decrease in RuBP pool with increasing CO2, which could account for Amax being lower than Vc of Rubisco if RuBP becomes limiting (as shown later in Fig. 7). In general, rc for mutant leaves was a minor component (from 10 to 15 m2 s−1 mol−1) compared with rbs (152 m2 s−1 mol−1 in Fig. 2).
Figure 2.
Example of calculating BS cell resistance from A versus Ci curves measured at low O2 (0.3 mbar) and PFD of 1,800 μmol m−2 s−1 in PEPC mutant. The inverse of the initial slope of A/Ci curve is the sum of the diffusive resistance from the cell wall to the sites of Rubisco and of the chemical RuBP carboxylation resistance. A simulated Rubisco CO2 response curve without diffusive resistance is shown for comparison. Rubisco resistance can be calculated as Kc/Vc. Vc was taken as Amax.
Figure 7.
CO2 response for CO2 assimilation rate (A, ○), gross O2 evolution rate (JO2, ▵), RuBP pool size (●), Rubisco activity (⧫), and Rubisco activation state (□) for PEPC mutant A. edulis at two O2 pressures, 0.3 and 210 mbar. Leaf temperature was 28°C, PFD = 1,400 μmol m−2 s−1. Each point is from a different leaf of similar age.
Analogous experiments to those in Figure 2 were performed on leaves of different maturity. The value of rbs increased with plant age and reached its highest value during grain filling when the leaves were pale green, showing early signs of senescence and lower maximum rates of CO2 fixation (Table I). Although BS resistance was calculated assuming Vc is 1.2 times Amax, a sensitivity analysis taking Vc/Amax = 1.0 and 1.4 showed that this results in a change in the calculated rbs values of only 3% to 5% in young leaves, and approximately 2% in mature leaves. Interestingly, during the grain filling stage, the leaves still maintained a reasonably high-CO2 assimilation capacity. The liquid phase resistance from the mesophyll cells to Rubisco in the mutant A. edulis (72–181 m2 s−1 mol−1; Table I) is about 70-fold higher than that of C3 plants (approximately 1–3 m2 s−1 mol−1; Evans et al., 1994; Laisk and Loreto, 1996). This high-diffusive resistance in C4 plants may be attributed to the relatively low BS cell surface area per unit leaf area and structural properties of BS cell walls (Evans and von Caemmerer, 1996). Models of C4 photosynthesis indicate the rate of CO2 assimilation under low CO2 drops rapidly below rbs values of 50 to 100 m2 s−1 mol−1 (Edwards et al., 2000; Laisk and Edwards, 2000; von Caemmerer, 2000).
Table I.
Leaf age-dependent differences in Amax and resistance to CO2 in the A. edulis PEPC mutant plants
| Leaf Description | Amax | Mesophyll to BS Resistance to CO2 (rbs+rc) | Liquid Phase Resistance to CO2 (rbs) |
|---|---|---|---|
| μmol m−2 s−1 | m2 s−1 mol−1 | ||
| Young, 30% expanded | 25.1 ± 1.4 | 89 ± 16 | 72.4 |
| Young, 70% expanded | 26.6 ± 1.8 | 103 ± 16 | 86.3 |
| Mature, vegetative, 100% expanded | 30.6 ± 1.0 | 127 ± 6 | 113.4 |
| Grain filling stage, 100% expanded | 20.6 ± 1.2 | 201 ± 17 | 180.8 |
The mesophyll to BS resistance for CO2 was calculated as the inverse of the initial slope of A/Ci curves. The sd for mesophyll to BS resistance and Amax was calculated from four independent measurements. rbs was calculated according to the method used in Figure 2. Amax was the CO2-saturated rate of photosynthesis, and other conditions of the assay were as in Figure 2.
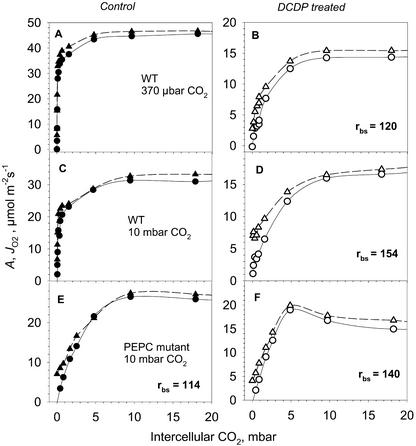
The resistance observed in the mutant might not reflect the true value of the wild type if the mutation alters the structure of the BS cells. To test this, we used the PEPC inhibitor DCDP, feeding it into the petiole to block the C4 cycle in wild-type plants (method of Jenkins et al., 1989a). The strong reduction in carboxylation efficiency caused by 4 mm DCDP, without a biphasic response (Fig. 3), suggests that PEPC is almost completely inhibited. CO2 response curves were measured at 2% (v/v) O2 before applying DCDP and immediately after photosynthesis declined at ambient CO2 as PEPC was inhibited (Fig. 3). The results show that the calculated BS resistances are similar to those obtained with the PEPC mutant. We measured A/Ci response curves (Ci determined from analysis of transpiration, which eliminates stomatal resistance) and calculated the resistance from the initial slope with Vc for Rubisco equal to 1.2 Amax estimated from CO2-saturated rates in the presence of DCDP. In calculating rbs, it is important to eliminate stomatal resistance and to account for any partial inhibition of Rubisco, and Vc, by DCDP. Jenkins et al. (1989a) calculated a permeability coefficient for CO2 from the atmosphere to BS cells (the reciprocal for the total diffusive resistance, rt) from measurements of photosynthetic O2 evolution in the presence of DCDP at 1.6% (v/v) CO2 by dividing the photosynthetic rate by the difference between atmospheric CO2 (Ca) and estimates of CBS. The calculated value of rt from the study of Jenkins et al. in A. edulis is 556 s · cm−1 (or 1,373 m2 s−1 mol−1), which is about 10-fold higher than values of rbs in the present study. Because rt includes stomatal and BS-diffusive resistance, high stomatal resistance in excised leaves could contribute to high rt values. Our A/Ci response curves with the PEPC mutant saturate sharply at intercellular CO2 concentrations about 1%, whereas up to 5% (v/v) ambient CO2 was required in experiments by Jenkins et al. (1989). Also, the calculation of rt is dependent on input of Vc of Rubisco to calculate CBS. Using the value of Vc from analysis of wild-type plants (Jenkins et al., 1989), rather than Vc in the presence of DCDP, will also overestimate Vc and the calculated diffusive resistance values (see also He and Edwards, 1996).
Figure 3.
The response of the rates of CO2 assimilation (A, ○, ●) and gross rate of O2 evolution from PSII (JO2, ▴, ▵) on wild type and PEPC mutant with and without feeding DCDP. Measurements were made on leaves of excised plants under 20 mbar O2. The calculated values of rbs in wild-type plants in presence of DCDP and in PEPC mutant with and without DCDP are shown. A and B, Wild-type plants grown at 370 μbar CO2; C and D, wild-type plants grown at 10 mbar CO2; E and F, PEPC mutant grown at 10 mbar CO2.
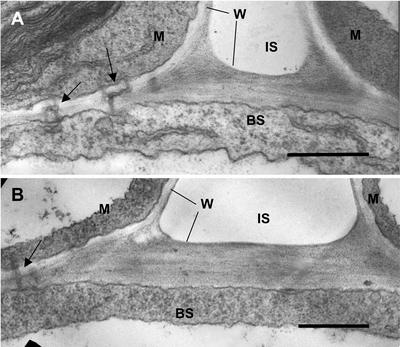
Light microscopy of leaf anatomy indicates that the wild-type plants grown under both 370 μbar and 10 mbar and the PEPC mutant grown under 10 mbar of CO2 all have Kranz-type leaf anatomy (results not shown; Dever et al., 1995). In wild-type plants grown at 10 mbar of CO2, the BS cell walls at the intercellular space are very thick relative to the walls of the mesophyll and cross walls (Fig. 4); similar results were obtained with wild type grown under ambient CO2. In the PEPC mutant, the BS cell walls are also much thicker than those of mesophyll cells, and cross walls include normal plasmodesmata (arrow). This suggests there are no structural differences between mutant and wild type.
Figure 4.
Electron microscopy showing cross sections through interface of mesophyll and BS of leaves of wild type (A) and PEPC mutant (B) with plants grown at 10 mbar CO2. M, Part of mesophyll cell; BS, part of BS cell; W, cell wall; IS, intercellular air space. Arrows point to plasmodesmata. Scale bar = 0.5 μm. The average thickness of BS cell wall in contact with intercellular air from several sections was 0.34 μm for wild type and 0.32 μm for mutant (n = 3).
Cellular Conductance and the Temperature Dependence of Photosynthesis under Limiting and Saturating CO2
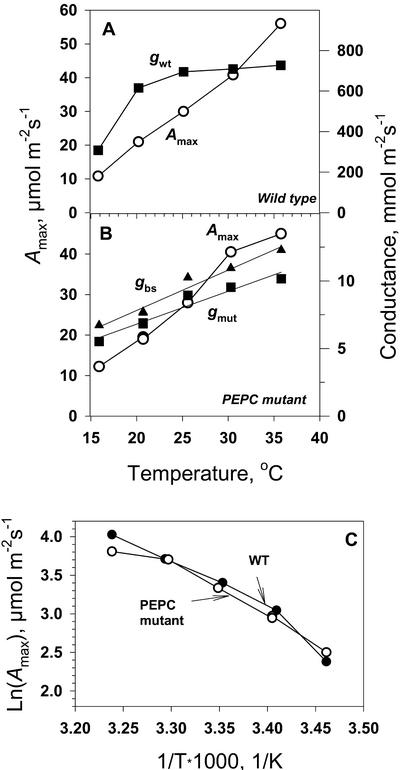
CO2 response curves of photosynthesis were measured in wild-type and mutant A. edulis at leaf temperatures from 15°C to 35°C. Figure 5, A and B, describes the temperature response of Amax, determined from CO2-saturated rates, and cellular conductance for CO2, g, determined from the initial slope of the net rate of CO2 assimilation (A/Ci) curves. In this case, conductance instead of resistance (g = 1/r) was used, because it is linearly related to the diffusion flux. In wild-type plants, the cellular conductance for CO2, gwt, was a function of liquid phase diffusion and carboxylation by PEPC in the mesophyll cell. For the mutant, gmut was the total conductance from mesophyll to BS cells, including liquid phase (gbs) and Rubisco (gc), as determined earlier.
Figure 5.
Temperature dependence of photosynthetic parameters for wild-type (A) and PEPC mutant (B) A. edulis measured under 0.3 mbar O2. Shown are internal conductance in the mesophyll for wild type, gwt (the initial slope of A/Ci curves), the internal conductance in the mutant, gmut, and the calculated liquid phase-diffusive conductance in the mutant (gbs) and maximal CO2 assimilation rate (Amax). C has Amax from A and B plotted in Arrhenius axes (the slope equals −Ea/R). Values of JO2-net measured under saturating CO2 (data not shown) were similar to values of Amax.
Amax increased with increasing temperature, with a Q10 value (the factor by which a reaction increases with a 10°C increase in temperature) of 2 for the mutant and 1.9 for the wild type between 20°C and 30°C. The corresponding activation energies were Ea = 13.5 and 11.3 kcal mol−1 (Fig. 5C, calculated between 20°C and 30°C). These values of Q10 and activation energies are as expected if photosynthesis under saturating CO2 and light is controlled by enzymatic processes. Also, the activation energy for Amax in the mutant (13.5 kcal mol−1) was close to the in vitro Rubisco activation energy of 13 kcal mol−1 (calculated from Jordan and Ogren, 1984). If RuBP is saturating for photosynthesis under high light, the Q10 values obtained would be consistent with Rubisco, rather than a diffusion limitation, being the major limiting factor for light- and CO2-saturated photosynthesis in the mutant.
In the mutant, gmut (which includes gbs and Rubisco conductance) and gbs had a linear response to increasing temperature. For gbs, the Q10 values were 1.3 between 20°C and 30°C (Fig. 5B), which coincides with the temperature sensitivity of diffusion of small molecules in solutions that have a Q10 value of 1.3 (Nobel, 1991). The agreement between the measured and expected Q10 value for gbs provides confidence that we are correctly measuring diffusive resistance of CO2 to BS cells. Because CO2 must diffuse to BS cells for fixation in the mutant, the cellular conductance values for the mutant are much lower than for the wild type.
In wild-type plants, CO2 is fixed initially in mesophyll cells, and the temperature response of the mesophyll conductance, determined from the initial slope of the CO2 response curve, showed a saturating curve rather than a linear response, indicating that biochemistry is involved (Fig. 5A). The effect of temperature on the initial slope of the A/Ci response in wild-type A. edulis depends on liquid phase diffusion and PEPC in mesophyll cells. The relative insensitivity of the mesophyll conductance in the wild type to temperature indicates control by biochemistry. This could be attributable to regulation of PEPC by temperature-dependent changes in Km for phosphoenolpyruvate (PEP; the substrate PEP is lower under limiting CO2 [Leegood and von Caemmerer, 1988]), by allosteric effectors, and/or by covalent modification of the enzyme (phosphorylation/dephosphorylation). There also may be a temperature-dependent effect on PEP because the level is reported to increase with increasing temperature under normal atmospheric levels of CO2 (Labate et al., 1990).
CO2 Response and Partitioning of Photochemical Electron Flow
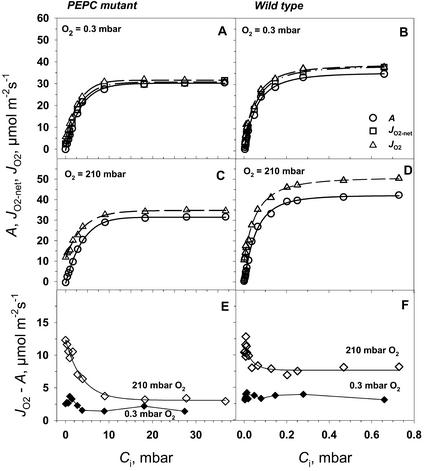
The CO2 response curves for CO2 fixation (A), gross rates of O2 evolution (JO2), and net rates of O2 evolution (JO2-net) of the mutant and wild-type leaves were measured at saturating light (Fig. 6). Measurements of A and JO2 were made at 210 mbar of O2, representing current atmospheric levels, and measurements of A, JO2, and JO2-net at near zero levels of O2 (0.3 mbar), with an interest in studying O2-dependent processes. To overcome the high-diffusive resistance from the atmosphere to the BS cells in the mutant, CO2 concentrations as high as 2% (20 mbar) were required (Fig. 6, A and C), whereas near atmospheric levels were saturating for the wild type (Fig. 6, B and D). The mutant plants of A. edulis had about 100 times lower initial slopes in A/Ci curves compared with the wild type (Fig. 6, A versus B and C versus D). From various measurements of Amax at 30°C during the course of the study on young to mature leaves, values were usually 30 to 40 μmol m−2 s−1 in the mutant compared with 40 to 50 μmol m−2 s−1 in the wild type. It is apparent that rates of A, JO2, and JO2-net were very similar in both the mutant and wild type at 0.3 mbar O2 (Fig. 6, A and B). At 210 mbar of O2, JO2 was substantially higher than A in both mutant and wild type (Fig. 6, C and D). This is clearly shown in Figure 6, E and F, where JO2-A is plotted in response to varying CO2 at 0.3 and 210 mbar of O2. JO2-A can potentially be accounted for by dark-type mitochondrial respiration (Rd), photorespiration (1.5 velocity of RuBP oxygenase [vo]), photosystem (PS) II-dependent O2 evolution associated with the Mehler-peroxidase reaction (JO2Mr), and O2 evolution associated with nitrogen assimilation (JO2NA; see Eqs. 3–6).
Figure 6.
The response of the rates of CO2 assimilation (A, ○), net O2 evolution (JO2-net, □), and gross O2 evolution from PSII (JO2, ▵) in PEPC mutant and wild-type A. edulis to intercellular CO2 (Ci) at two oxygen partial pressures, 210 and 0.3 mbar. The CO2 response curves were measured at PFD = 1,800 μmol m−2 s−1 and at leaf temperature 29°C.
In the mutant at 0.3 mbar of O2, it is obvious that most of the PSII activity (JO2) can be accounted for by CO2 fixation and that Rd, vo, JO2MR, and JO2NA must be low (Fig. 6, A and E). Because a partial pressure of 0.3 mbar of O2 in the atmosphere is extremely low, a correspondingly low level is expected in the mesophyll cells within the leaf. However, even under very low external levels of O2, the O2 level in the BS cells will increase when O2 is generated from PSII activity under a high-BS cell-diffusive resistance. At 0.3 mbar of O2 in the atmosphere and based on the average value for BS cell resistance determined in this study (described later), the calculated level of O2 in BS cells at CO2-saturated rates of photosynthesis was about 30 mbar. From Equation 14, if we take A = 30 μmol m−2 s−1, rbs = 30 s cm−1 (80 m2 s−1 mol−1), aw = 0.79 (aw is a constant that takes into account the difference in O2 and CO2 diffusivities [at 25°C, aw = 0.79; Farquhar, 1983]), and b = 0.5, then the concentration of O2 would be 35 μm (equivalent to about 30 mbar of O2 in the gas phase; O2 = 0 + 0.79*0.5*30*A/10 = 35 μm). Rd from measurements in the dark under normal atmospheric conditions is 2 to 3 μmol m−2 s−1 (data not shown). On average, JO2NA for nitrate assimilation to Glu is estimated to be about 5% of A, not considering re-assimilation of ammonia from photorespiration (see Edwards and Baker, 1993). Thus, Rd in vascular tissue plus nitrate assimilation could easily account for the difference between JO2 and A at 0.3 mbar of O2. Some rise in values of JO2-A under limiting CO2 at 0.3 mbar of O2 would be expected, because A decreases relative to Rd (Fig. 6E). These results indicate that JO2Mr and vo must be very low in the mutant under 0.3 mbar of O2 in the atmosphere.
In the mutant at 210 mbar of O2, the values of JO2-A were much greater than at 0.3 mbar of O2, particularly with decreasing levels of CO2 (Fig. 6E). The logical explanation for this effect is that the mutant, which lacks a C4 cycle, has increasing rates of photorespiration under limiting CO2 just as C3 plants do (see also Lacuesta et al., 1997; Maroco et al., 1998a), which causes a corresponding increase in JO2. Under high CO2 and under 210 mbar of O2, the mutant may have some additional dark-type respiration in mesophyll cells, resulting in larger values of JO2-A than at 0.3 mbar of O2.
In the wild-type plant under 0.3 mbar of O2 (Fig. 6F), the value of JO2-A was about 4 μmol m−2 s−1, which was higher than in the mutant, and was independent of the level of CO2. As with the mutant, nitrate assimilation and Rd in BS tissue may partly account for the difference. However, the Mehler reaction or photorespiration may also contribute in the wild-type plant. In a recent study, there was evidence for significant Mehler reaction in wild-type A. edulis under rather low levels of O2 (between 0.2 and 20 mbar; Laisk and Edwards, 1998). In NAD-malic enzyme (NAD-ME) species like A. edulis, the Mehler reaction is proposed to function in mesophyll chloroplasts and contribute to generation of ATP for the C4 cycle (Furbank and Badger, 1982; Laisk and Edwards, 1998). With increasing CO2, there may be a rise in the rate of the Mehler reaction as the rate of the C4 cycle increases, whereas with decreasing CO2, there may be a rise in photorespiration; together these effects could result in values of JO2-A being reasonably constant in NAD-ME-type species with varying CO2 (see Furbank and Badger, 1982).
In the wild-type plant under 210 mbar of O2, JO2 was higher than A across the CO2 response curve (Fig. 6D); the pattern of change with increasing CO2 is very similar to that of Canvin et al. (1980) from O2 isotope analysis of photosynthesis in A. edulis. JO2-A at 210 mbar was greater than at 0.3 mbar of O2, and a sharp increase in JO2-A occurred at very low levels of CO2. Above approximately 0.025 mbar of CO2, JO2-A was constant at about 8 μmol m−2 s−1 (Fig. 6F). As noted above, this can be explained by O2-dependent photorespiration at extremely low levels of CO2 and increasing Mehler reaction at higher CO2. The larger JO2-A values at high CO2 under 210 mbar versus 0.3 mbar of O2 may be accounted for by O2-dependent dark respiration and/or the Mehler reaction.
To evaluate Rubisco kinetics in mutant leaves relative to A and JO2, we analyzed RuBP content and Rubisco activity (Fig. 7). With increasing CO2 from zero up to about 0.8 mbar there was an increase in RuBP content, above which it decreased. The initial extractable activity of Rubisco in the mutant was higher than Amax at saturating CO2 and decreased slightly at the lower CO2 concentrations (Fig. 7, C and D). The decrease at low CO2 correlated with a decrease in the state of activation of the enzyme. In the wild type (results not shown), leaf RuBP content was similar to the mutant at low CO2 (at CO2 = 34 μbar, RuBP was 56 μmol m−2) and decreased at high CO2 (at CO2 = 4.8 mbar, RuBP was 47 μmol m−2), which is in close agreement with the values of Leegood and von Caemmerer (1988). Considering a Rubisco active site turnover rate of 2.8 s−1 (Woodrow and Berry, 1988), the number of active sites per leaf area in A. edulis would be about 15 to 20 μmol m−2. The RuBP concentration across the A/Ci curve at light saturation exceeded the number of active sites by about three times, which suggests the RuBP is at saturating levels. However, the observation that the RuBP concentration decreased at high CO2 (Fig. 7) and with the known competitive interaction of some chloroplast metabolites with RuBP (e.g. PGA; Servaites and Geiger, 1995), it is possible that Amax is partly limited by RuBP regeneration.
Light Response and Partitioning of Photochemical Electron Flow
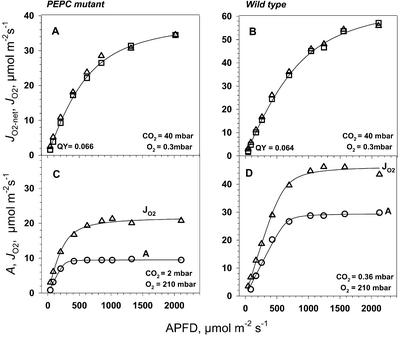
The response of photosynthesis to light under very high CO2 (4%, 40 mbar) in the mutant gave about the same maximal quantum yield for O2 evolution (JO2-net, JO2) as in the wild type (0.064 versus 0.066; Fig. 8, A and B). The quantum yield for O2 evolution for wild-type A. edulis was higher than measured by Ehleringer and Bjorkman (1977) for CO2 fixation in NAD-ME-type C4 species (0.054). Higher values for the wild type may be explained by the use of highly saturating CO2 and very low O2, which would restrict O2-dependent use of energy, and by the fact that O2 evolution, rather than CO2 uptake, was measured. In the wild-type plant under very high CO2, the responses of JO2 and JO2-net to increasing light were very similar, indicating there was little photorespiration and Mehler reaction under this condition. It is uncertain why the Mehler reaction would be restricted under such high levels of CO2 in the wild type. However, in the wild-type plant under 4% (v/v) CO2, direct diffusion of CO2 to BS cells would occur, bypassing the C4 cycle, because in mutant plants, which lack a C4 cycle, photosynthesis is saturated by 2% (v/v) CO2.
Figure 8.
Light response of PEPC mutant and wild-type A. edulis O2 evolution (JO2-net, □) at highly saturating levels of CO2 of 40 mbar CO2 (O2 = 0.3 mbar), and CO2 uptake (A, ○) at limiting CO2 (2 mbar for PEPC mutant and 0.36 mbar for wild type) and 210 mbar O2 pressure. Leaf temperature was 28°C. Gross rates of O2 evolution (JO2, Δ) were calculated from simultaneous fluorescence measurements as described in “Materials and Methods.”
In the mutant, under saturating levels of CO2, which prevent photorespiration, we would expect maximum quantum yields of O2 evolution similar to those of C3 plants. Instead, the values in the mutant were lower than in C3 plants under saturating CO2 and similar to those of the A. edulis wild type. This suggests that the absorbed energy, which is used in the wild type in mesophyll chloroplasts for the C4 cycle (ATP for conversion of pyruvate to PEP, and NADPH to the degree malate is synthesized), may be dissipated as heat in the mutant if there is no other means for using it in carbon assimilation. In the mutant, there is no requirement for energy in mesophyll cells in carbon assimilation, unless part of the PGA and glycerate formed via RuBP carboxylase and oxygenase activities in BS chloroplasts is shuttled to mesophyll cells for reduction (Fig. 1).
In the mutant under CO2 which is limiting for photosynthesis (2 mbar), and at 210 mbar of O2, JO2 was much higher than A, and the maximum quantum yield under limiting light was higher for JO2 than for A (Fig. 8C). This can be explained by the mutant having a high level of photorespiration and responding like a C3-type species under limiting CO2.
In the wild type under atmospheric levels of CO2 and 210 mbar O2, the light response curves showed a higher quantum yield (from initial slopes) and a higher light-saturated rate for JO2 than for A (Fig. 8D). This may be attributed to the Mehler reaction increasing with increasing light and generating ATP for the C4 cycle under 210 mbar O2, which could largely account for the difference between JO2 and A. With the wild-type plant having a functional C4 cycle, photorespiration and dark-type respiration are expected to be minor components of the difference between JO2 and A. A previous study indicated that the Mehler reaction is functioning in A. edulis but is insufficient to supply the ATP needed to support the C4 cycle (Laisk and Edwards, 1998). Thus, both the Mehler reaction and PSI-mediated cyclic electron flow may generate the ATP, with some flexibility in the magnitude of each. In contrast to results under 210 mbar of O2 (Figs. 6D and 8D), there was no evidence for function of the Mehler reaction under low O2 (Fig. 8B), which suggests the ATP needed to support the C4 cycle is provided by PSI-dependent cyclic electron flow.
O2 Effect on the Partitioning of Photochemical Electron Flow
It is well known that at low-CO2 concentrations, the rate of CO2 assimilation in C4 plants exhibits low sensitivity to O2. This is in contrast to C3 plants, where photorespiration greatly reduces the rate of CO2 assimilation in response to increasing O2 (Kanai and Edwards, 1999). Measurements of A and JO2 in mutant plants, in which the C4 cycle is not functional, provide an opportunity to follow more closely the maximum potential for Rubisco oxygenase and the glycolate pathway to function. This is not possible in normal C4 leaves, where the CO2 pump operates.
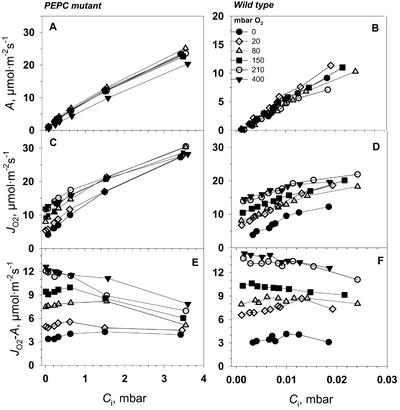
The responses of A and JO2 were measured at increasing O2 concentrations over a range of CO2-limited concentrations where greater RuBP oxygenase activity is expected for mutant and wild-type plants (Fig. 9). In the wild-type plant at rate-limiting CO2 levels, high O2 increased JO2, but the CO2 assimilation rates remained relatively unaffected by O2 (Fig. 9, B and D). The increase in JO2 with increasing O2 under low CO2 suggests an increase in photorespiration through RuBP oxygenase activity. At a given level of O2, the value of JO2-A (Fig. 9F) remained about the same with increasing levels of CO2, which, as discussed earlier, may be attributable to the Mehler reaction partially providing ATP to support the C4 cycle and increasing with increasing rates of CO2 fixation.
Figure 9.
Oxygen sensitivity of A. edulis photosynthesis at limiting CO2 concentrations, 30°C, and PFD = 1,800 μmol m−2 s−1. The rate of PSII O2 evolution (JO2) shows an increase with increasing O2 concentration and continues at CO2 = 0 because of re-assimilation of CO2 released from the photorespiration and from the Krebs cycle.
In the mutant, high O2 increased JO2 at the lowest, rate-limiting CO2 levels, but the CO2 assimilation rates remained relatively unaffected by O2 (Fig. 9, A and C). The increased electron transport rate with increasing O2 under limiting CO2 suggests an O2-dependent increase in the RuBP oxygenation rate. At the higher levels of O2, the difference between JO2 and A (Fig. 9E) was gradually suppressed by increasing CO2, which is expected if increasing CO2 suppresses photorespiration and considering that the mutant does not have a C4 cycle that could be supported by the Mehler reaction.
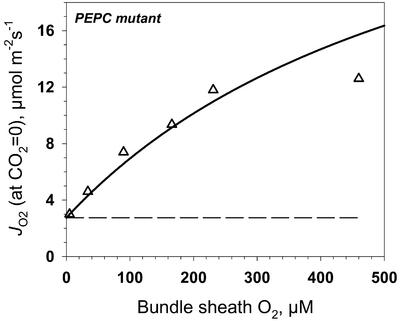
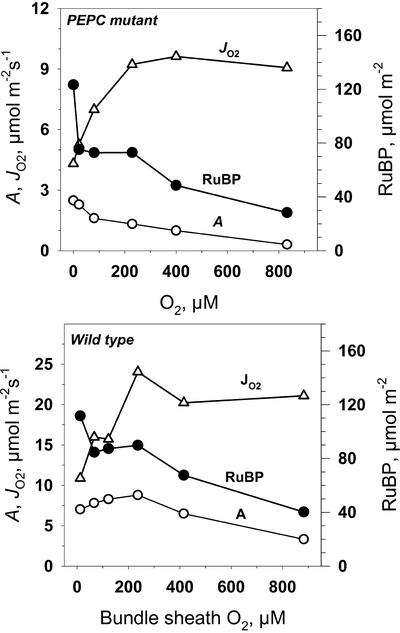
For the mutant under limiting CO2, the activity of JO2 is expected to be largely accounted for by the sum of the velocity of RuBP carboxylase (vc) and vo. We extrapolated JO2, measured at different O2 concentrations, to CO2 = 0 and plotted the resulting values against BS cell O2 concentration in an effort to evaluate the effect of Rubisco oxygenase activity on JO2 (Fig. 10). Assuming photorespired CO2 is re-assimilated with the probability determined by the ratio of Rubisco conductance to BS cell conductance, the expected JO2 response can be described by the solid line in Figure 10. The experimental points are in good agreement with predicted results based on Rubisco kinetics if re-assimilation is accounted for, except that at the highest O2 level (480 μm, which is about twice the atmospheric level), the oxygenase activity was lower than expected. Analysis of RuBP content in the leaves of the mutant at low CO2 (0.4 mbar) showed a decrease of RuBP concentration at rate-limiting CO2 and with increasing O2 (Fig. 11). Therefore, we suggest that the lower than expected JO2 value at O2 concentration below the Km for RuBP oxygenase (Ko) value (640 μm) in the mutant (Fig. 10) is the result of RuBP becoming partially limiting for CO2 assimilation. Very similar results were obtained with wild-type plants (Fig. 11). Also, the response of JO2 to O2, under low CO2, in the wild type is similar to that in A. edulis measured at the CO2 compensation point by O2 isotope analysis (Canvin et al., 1980).
Figure 10.
JO2 for the PEPC mutant of A. edulis from Figure 9 was extrapolated to CO2 = 0, and the results were plotted against O2 concentration. The simulated JO2 shown by the solid line was calculated based on BS O2 and CO2 concentration (the latter calculated for each O2 level considering BS-diffusive resistance) and Rubisco kinetic constants (Vc = 39, Kc = 21 μm, and Ko = 640 μm), where JO2 equals vc + vo (Edwards and Baker, 1993). The rate of CO2 re-assimilation (at zero external CO2) is proportional to the ratio of Rubisco conductance and BS-diffusive conductance.
Figure 11.
PEPC mutant and wild-type A. edulis leaf RuBP content (●) versus O2 concentration with Ci of 0.4 mbar for mutant and 0.025 mbar for wild type. Also, CO2 assimilation rate (A, ○) and O2 evolution from PSII (JO2, ▵) are shown. Leaf temperature was 28°C; light PFD = 1,800 μmol m−2 s−1.
There was only a small effect of O2 on the rate of CO2 assimilation at low-CO2 concentrations in either the mutant or wild-type A. edulis (Fig. 9). The limited effect of O2 on CO2 assimilation in the mutant, where there is no C4 cycle function, can be explained by effective re-assimilation in the BS cells of the CO2 that is generated from dark-type respiration and photorespiration. It is also evident that in the wild-type plants, CO2 re-assimilation at low CO2 affects assimilation kinetics. In this case, refixation of photorespired CO2 may occur in mesophyll cells via PEPC, if there is leakage of CO2, as well as in BS cells. However, the effectiveness of the mutant suggests that, under low CO2, much of the photorespired CO2 will be directly refixed in BS cells.
Calculation of CO2 Concentration and Leakiness of CO2 in BS Cells of A. edulis
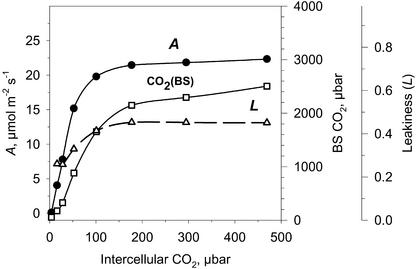
If Rubisco kinetic parameters (Vc, Kc [the Km for RuBP carboxylase], Ko, and S [the relative specificity factor for carboxylase versus oxygenase]) are known, one can calculate BS CO2 concentration using a C4 photosynthesis model (von Caemmerer, 2000). Figure 12 shows calculated BS cell CO2 concentrations during photosynthesis in wild-type A. edulis leaves under varying intercellular CO2 concentrations at 210 mbar of O2 calculated with the model of C4 photosynthesis. Also, shown in Figure 12 are the calculated values of BS cell leakiness during CO2 fixation in wild-type plants, which range from approximately 0.2 to 0.3 (from Eqs. 16 and 17, using an rbs value of 113 m2 s−1 mol−1). As increasing ambient levels of CO2 became saturating for photosynthesis, the calculated levels of CO2 in the BS cells of mature leaves reached levels of approximately 2,000 μbar, which is about six times that normally occurring in the atmosphere.
Figure 12.
CO2 response for CO2 assimilation rate (at leaf temperature of 28°C; PFD = 1,800 μmol m−2s−1; ●), calculated CO2 partial pressure in BS cells (□), and leakiness of CO2 from BS cells (▵). The CO2 level in BS cells was calculated according to von Caemmerer (2000), and the leakiness was calculated according to equations 16 and 17 using rbs value of 113 m2 s−1 mol−1. Similar results were obtained from analysis of several experiments on A/Ci responses.
CONCLUDING REMARKS
The PEPC mutant of A. edulis has high light- and CO2-saturated rates of photosynthesis comparable with those of the wild type. The high CO2 required for growth and the high-diffusive resistance of the PEPC mutant to CO2 indicate that physical restraints to gases have been conserved in the C4 anatomy of the mutant. The value of BS cell resistance to CO2 increased with leaf age in A. edulis from 72 to 181 m2 s−1 mol−1 (Table I). Similar resistance values for mature leaves were obtained with wild-type plants treated with the PEPC inhibitor DCDP. The results suggest there may be developmental changes in BS cells that increase the diffusive resistance to CO2 by changes in the liquid phase of the cell or cell wall properties. The concentration of CO2 in BS cells under high rates of photosynthesis is estimated to be about six times current ambient levels, sufficient to largely repress photorespiration. Re-assimilation of CO2 from dark-type respiration and photorespiration in BS cells is an important component of both PSII activity and consumption of reductive power at very low-CO2 concentrations in A. edulis.
MATERIALS AND METHODS
Growth Conditions
Mutant plants of Amaranthus edulis LaC4 2.16 lacking PEPC activity and protein (Dever et al., 1995) were grown in growth chambers (Econair, Winnipeg, Canada) on fertilized potting soil in 8-L pots (one plant per pot), with a 14/10-h day/night cycle at 28°C/22°C, 50% relative humidity, 10 mbar of CO2, and an incident photosynthetically quantum flux density (PFD) of 1,200 μmol m−2 s−1 light. Wild-type plants were grown under the same conditions, except the CO2 concentration was 370 μbar and 10 mbar in experiments with DCDP and electron microscopy and 370 μbar in all other experiments.
Gas Exchange (A and JO2-net)
Leaf gas exchange was measured with the FastEst gas system (FastEst, Tartu, Estonia; described in detail in Laisk and Oja, 1998). The system was equipped with a CO2 analyzer (6251, LI-COR, Lincoln, NE) and a S-3A O2 ceramic heated zirconium oxide analyzer (Applied Electrochemistry Inc., Sunnyvale, CA). Leaf gas exchange characteristics, net rates of CO2 fixation (A), Ci, PFD, and leaf temperature were determined as in Laisk and Loreto (1996). For measurements of A under high levels of CO2, there is an increase in noise to signal ratio in measuring CO2 with an infrared gas analyzer. To improve measurements of A, sampling time was 0.1 s for 3 min resulting in 1,800 data points, which were averaged. For example, in one experiment A measured at 3% (v/v) CO2 was 41.9 μmol m−2 s−1 with a se with n = 1,800 of ± 0.12. The S-3A O2 analyzer provides an accurate measure of the net rate of O2 evolution (JO2-net) under low levels of atmospheric O2 (less than 10 mbar), independent of CO2 concentration.
Measurement of Chlorophyll Fluorescence and Calculation of PSII Activity (JO2)
The yield of PSII was measured by chlorophyll fluorescence using a fluorometer (PAM 101, Walz, Effeltrich, Germany). The gross rate of O2 evolution from PSII (JO2) was calculated as:
 |
1 |
where (Fm′-Fs)/Fm′ is the yield of PSII (e− quanta absorbed), Fs is fluorescence yield of steady-state photosynthesis, Fm′ is maximal fluorescence yield by exposure to a 1-s pulse of 15,000 μmol m−2 s−1 light and APFD is the absorbed photosynthetic quantum flux density at steady state (Genty et al., 1989). For estimating the relative optical cross section of PS II (YII), the method proposed by Laisk and Loreto (1996) was used. YII was found by extrapolating a plot of Fs/Fm′ versus quantum yield of O2 evolution measured with an O2 electrode (JO2-net) at different light intensities, to Fs/Fm′ = 0. The measurements were made under a low-O2 background (0.025%) and high CO2 so that respiratory uptake of O2 would be minimized and the O2 evolution measured would reflect essentially all PSII activity. The calculated values of YII for wild-type and mutant plants were 0.44 to 0.55 and 0.41 to 0.48, respectively. For calculations of APFD, the light reflected and transmitted by the leaf was measured using an integrating sphere (Labsphere, North Sutton, NH). For the mutant leaf, the average fractional absorption of incident light was 0.82, whereas for the wild type, the value was 0.85. In mature leaves of mutant plants, the chlorophyll (a+b) content was 156 mg m−2 compared with 309 mg m−2 in the ambient CO2-grown wild type. The fresh weights of the mutant and wild-type leaves were identical, 22 mg cm−2, but the mutant had less dry weight per leaf area, 2.9 mg cm−2, compared with 4.4 mg cm−2 in the wild type (leaves were sampled at midday).
Equations and Calculation of Leaf Photosynthesis Parameters
O2 Evolution in Mutant and Wild Type
O2 evolution associated with linear electron transport rate can be expressed as
 |
2 |
where vc and vo are RuBP carboxylation and oxygenation rates, respectively, and J1 is the use of electrons in other processes (e.g. Mehler reaction and nitrogen reduction). The following equations illustrate the main factors in considering the relationship between JO2, JO2-net, and A in C3 and C4 plants, because there is no net consumption of reductive power in the C4 cycle of malic enzyme-type species (see Edwards and Baker, 1993).
 |
3 |
 |
4 |
 |
5 |
 |
6 |
where Rd = rate of dark-type mitochondrial respiration, JO2Mr = PSII-dependent O2 evolution associated with the Mehler-peroxidase reaction, and JO2NA = O2 evolution associated with nitrogen assimilation (reduction of nitrate and assimilation to Glu).
Analysis of Parameters of CO2 Fixation and rbs in PEPC Mutant
We assume that light-saturated CO2 uptake in the mutant A. edulis plants is limited primarily by physical diffusive resistance to CO2 and Rubisco activity (see Fig. 1). Values for the diffusive resistance to CO2, carboxylation resistance, and RuBP carboxylation and oxygenation velocities can be calculated from leaf gas exchange measurements using the biochemical model of Rubisco developed by Farquhar et al. (1980). According to their model for C3 photosynthesis, the CO2 assimilation rate in the mutant can be described according to equation 3 above, where A = vc − 0.5 vo − Rd. Assuming Rubisco saturation by RuBP,
 |
7 |
 |
8 |
 |
9 |
where Vc and Vo = maximum carboxylation and oxygenation velocities, respectively, Kc and Ko = carboxylation and oxygenation Michaelis constants, respectively, Cc and Oc = CO2 and O2 concentrations at Rubisco active sites, respectively, and S = Rubisco specificity for CO2 relative to O2.
Total resistance to CO2 flux in the mutant, rt, can be described as the sum of three resistances
 |
10 |
where rg is gas phase resistance (boundary layer and stomatal), rbs is liquid phase resistance (effectively BS resistance), and rc describes carboxylation resistance of Rubisco. Gas phase resistance, rg, was calculated from transpiration data. Intercellular CO2 partial pressure, Ci equals
 |
11 |
where Ca is ambient CO2 and A is net CO2 assimilation rate. Intercellular CO2 partitions between the gas phase and the cell wall liquid phase, Cw is
 |
12 |
giving soluble CO2 where βc is the CO2 solubilization coefficient. The CO2 concentration at the sites of carboxylation in the mutant, Cc is
 |
13 |
O2 concentration in the BS chloroplasts can be described as
 |
14 |
where O2 concentration at the mesophyll cell wall is
 |
15 |
aw is a constant that takes into account the difference in O2 and CO2 diffusivities (at 25°C aw = 0.79; Farquhar, 1983), b is the relative proportion of O2 evolution in BS cells, Oi is the intercellular concentration of O2, and βo is the O2 partitioning factor between gaseous and liquid phase.
DCDP Feeding Experiments
A leaf petiole was cut under water, and the CO2 response curve was measured at 2% (v/v) oxygen (Fig. 3, A–C). Water was then replaced by a 4 mm solution of DCDP (PEPC inhibitor). After DCDP caused a decrease of photosynthesis to a stable level under atmospheric levels of CO2 (about 20 min), the CO2 response was measured (Fig. 3, B, D, and F). Measurement of photosynthesis on excised leaves can be problematic; however, using the FastEst gas exchange system the A/Ci response curves could be run in 20 min. The maximum rates of CO2 fixation and response curves of control plants were similar to intact plants.
Calculating BS Cell CO2 Concentration and Leakiness in Wild-Type Plants
The mechanistic model of C4 photosynthesis developed by von Caemmerer (2000) was used for estimating concentrations of CO2 in BS cells. The model requires inputs for Rubisco kinetic parameters. The kinetic constants for A. edulis Rubisco (Kc = 16 μm, Ko = 640 μm, and S = 82 at 25°C) were obtained from the work of Jordan and Ogren (1983) and corrected for temperature according to Woodrow and Berry (1988). Vc was taken equal to the CO2-saturated assimilation rate at a PFD of 1,800 μmol m−2 s−1.
Leakiness of CO2 from BS cells during photosynthesis in wild-type plants was calculated as a fraction of the rate of the C4 cycle based on the above estimates of BS cell CO2 concentration and measured values of rbs in the A. edulis mutant, where the rate of leakage of CO2 per unit leaf area (La) equals
 |
16 |
with [CO2]BS and [CO2]i representing the level of CO2 in BS cells versus the external concentration in the intercellular air space, respectively. Leakiness (L), from BS cells as a fraction of the rate of the C4 cycle is defined as
 |
17 |
Measurement of RuBP Content
Leaf metabolism was stopped by quick filling of the leaf chamber with cooled ethanol (approximately −90°C). The frozen leaf (8 cm2) was then removed from the chamber and ground into a fine powder in a small mortar under liquid nitrogen. The powder was then transferred into 3 mL of 1 m HClO4 and extracted for 15 min. The extract was neutralized with 5 m KOH and centrifuged 3 min at 5,000g. The supernatant was stored under liquid N2 until analyzed. RuBP content was determined using the method of 14C incorporation into acid stable product as in Prinsley et al. (1986) using purified Rubisco from tobacco (Nicotiana tabacum).
Rubisco and Chlorophyll Content
For Rubisco activity measurements, the leaves were sampled the same way as for RuBP determination. The frozen leaf powder was then transferred into CO2-free 100 mm HEPES/KOH buffer (pH = 7.9). The Rubisco extraction buffer (1 mL per cm2 of leaf) contained 20 mm MgCl2, 2 mm EDTA, and 5 mm dithiothreitol. It was then ground and homogenized in a Broeck Tissue Grinder (Corning, Palo Alto, CA) for about 20 s and divided into two parts, the first of which was immediately assayed by injecting 0.1 mL into a 0.9-mL assay medium and running the reaction 30 s at 28°C. This was taken as the in vivo activity of Rubisco. The assay media had the following final composition: 100 mm HEPES/KOH (pH = 7.9), 10 mm Mg2+, 2 mm EDTA, 5 mm dithiothreitol, 1 mm RuBP, and 10 mm NaHCO3 + NaH14CO3 with specific activity of 0.5 Ci mol−1. The second assay, which was run after incubating the enzyme preparation 15 min in the presence of 10 mm NaHCO3, was taken as the fully carbamylated activity. It was shown, by adding purified Rubisco with known activities to leaf material before grinding, that there was no loss of activity attributable to extraction procedures. However, the possibility that some loss of activity may have occurred because of incomplete solubilization of Rubisco from the leaf material cannot be ruled out. The chlorophyll content of the leaves was determined according to Porra et al. (1989) using 80% (v/v) acetone extract.
ACKNOWLEDGMENTS
We thank Dr. Colin Jenkins (Commonwealth Scientific and Industrial Research Organization, Canberra, Australia) for providing PEPC inhibitor DCDP. We appreciate discussion and some preliminary work with Dr. João Maroco (Instituto Superior de Agronomia, Lisbon, Portugal) on this project.
Footnotes
This research was supported by the National Science Foundation (grant nos. IBN–9807916 and IBN–0131098 to G.E.E.).
Article, publication date, and citation information can be found at www.plantphysiol.org/cgi/doi/10.1104/pp.008201.
LITERATURE CITED
- Brown RH. Analysis of bundle sheath conductance and C4 photosynthesis using a PEP-carboxylase inhibitor. Aust J Plant Physiol. 1997;24:549–554. [Google Scholar]
- Brown RH, Byrd GT. Estimation of bundle sheath cell conductance in C4 species and O2 insensitivity of photosynthesis. Plant Physiol. 1993;103:1183–1188. doi: 10.1104/pp.103.4.1183. [DOI] [PMC free article] [PubMed] [Google Scholar]
- Canvin DT, Berry JA, Badger MR, Fock H, Osmond CB. Oxygen exchange in leaves in the light. Plant Physiol 66: 302–307 concentrating mechanism and photorespiration. Plant Physiol. 1980;103:83–90. doi: 10.1104/pp.66.2.302. [DOI] [PMC free article] [PubMed] [Google Scholar]
- Dever LV, Blackwell RD, Fullwood NJ, Lacuesta M, Leegood RC, Onek LA, Pearson M, Lea PJ. The isolation and characterization of mutants of the C4 photosynthetic pathway. J Exp Bot. 1995;46:1363–1376. [Google Scholar]
- Edwards GE, Baker NR. Can CO2 assimilation in maize leaves be predicted accurately from chlorophyll fluorescence analysis? Photosynth Res. 1993;37:89–102. doi: 10.1007/BF02187468. [DOI] [PubMed] [Google Scholar]
- Edwards GE, Kiirats O, Laisk A, Okita TW. Requirements for the CO2 concentrating mechanism in C4 plants relative to limitations on carbon assimilation in rice. In: Sheehy JE, Mitchell PL, Hardy B, editors. Redesigning Photosynthesis in Rice. Amsterdam: International Rice Research Institute, Philippines, and Elsevier Science BV; 2000. pp. 99–112. [Google Scholar]
- Ehleringer J, Bjorkman O. Quantum yields for CO2 uptake in C3 and C4 plants. Plant Physiol. 1977;59:86–90. doi: 10.1104/pp.59.1.86. [DOI] [PMC free article] [PubMed] [Google Scholar]
- Evans JR, von Caemmerer S. CO2 diffusion inside leaves. Plant Physiol. 1996;110:339–346. doi: 10.1104/pp.110.2.339. [DOI] [PMC free article] [PubMed] [Google Scholar]
- Evans JR, von Caemmerer S, Setchell BA, Hudson GS. The relationship between CO2 transfer conductance and leaf anatomy in transgenic tobacco with a reduced content of Rubisco. Aust J Plant Physiol. 1994;21:475–495. [Google Scholar]
- Farquhar GD. On the nature of carbon isotope discrimination in C4 species. Aust J Plant Physiol. 1983;10:205–226. [Google Scholar]
- Farquhar GD, von Caemmerer S, Berry JA. A biochemical model of photosynthetic CO2 assimilation in leaves of C3 species. Planta. 1980;149:78–90. doi: 10.1007/BF00386231. [DOI] [PubMed] [Google Scholar]
- Furbank RT, Badger MR. Photosynthetic oxygen exchange in attached leaves of C4 monocotyledons. Aust J Plant Physiol. 1982;9:553–558. doi: 10.1104/pp.70.4.927. [DOI] [PMC free article] [PubMed] [Google Scholar]
- Furbank RT, Jenkins CLD, Hatch MD. CO2 concentrating mechanism of C4 photosynthesis: permeability of isolated bundle sheath cells to inorganic carbon. Plant Physiol. 1989;91:1364–1371. doi: 10.1104/pp.91.4.1364. [DOI] [PMC free article] [PubMed] [Google Scholar]
- Genty B, Briantais J-M, Baker NR. The relationship between the quantum yield of photosynthetic electron transport and quenching of chlorophyll fluorescence. Biochim Biophys Acta. 1989;990:87–92. [Google Scholar]
- Hatch MD, Agostino A, Jenkins CLD. Measurement of the leakage of CO2 from bundle-sheath cells of leaves during C4 photosynthesis. Plant Physiol. 1995;108:173–181. doi: 10.1104/pp.108.1.173. [DOI] [PMC free article] [PubMed] [Google Scholar]
- He D, Edwards GE. Estimation of diffusive resistance of bundle sheath cells to CO2 from modeling of C4 photosynthesis. Photosynth Res. 1996;49:195–208. doi: 10.1007/BF00034781. [DOI] [PubMed] [Google Scholar]
- Henderson SA, von Caemmerer S, Farquhar GD. Short-term measurements of carbon isotope discrimination in several C4 species. Aust J Plant Physiol. 1992;19:263–285. [Google Scholar]
- Jenkins C, Furbank RT, Hatch M. Inorganic carbon diffusion between C4 mesophyll and bundle sheath cells: direct bundle sheath CO2 assimilation in intact leaves in the presence of an inhibitor of the C4 pathway. Plant Physiol. 1989a;91:1356–1363. doi: 10.1104/pp.91.4.1356. [DOI] [PMC free article] [PubMed] [Google Scholar]
- Jenkins C, Furbank RT, Hatch MD. Mechanism of C4 photosynthesis: a model describing the inorganic carbon pool in bundle sheath cells. Plant Physiol. 1989b;91:1372–1381. doi: 10.1104/pp.91.4.1372. [DOI] [PMC free article] [PubMed] [Google Scholar]
- Jordan DB, Ogren WL. Species variation in kinetic properties of ribulose 1,5-bisphosphate carboxylase/oxygenase. Arch Biochem Biophys. 1983;327:425–433. doi: 10.1016/0003-9861(83)90472-1. [DOI] [PubMed] [Google Scholar]
- Jordan DB, Ogren WL. The CO2/O2 specificity of ribulose 1,5-bisphosphate carboxylase/oxygenase. Planta. 1984;161:308–313. doi: 10.1007/BF00398720. [DOI] [PubMed] [Google Scholar]
- Kanai R, Edwards GE. Biochemistry of C4 photosynthesis. In: Sage RF, Monson RK, editors. The Biology of C4 Photosynthesis. New York: Academic Press; 1999. pp. 49–87. [Google Scholar]
- Ku MB, Edwards GE. Photosynthesis in mesophyll protoplasts and bundle sheath cells of various types of C4 plants: IV. Enzymes of respiratory metabolism and energy utilizing enzymes of photosynthetic pathways. Z Pflanzenphysiol. 1975;77:16–32. [Google Scholar]
- Labate CA, Adcock MD, Leegood RC. Effect of temperature on photosynthetic carbon assimilation and contents of photosynthetic intermediates in leaves of maize and barley. Planta. 1990;181:547–554. doi: 10.1007/BF00193009. [DOI] [PubMed] [Google Scholar]
- Lacuesta M, Dever V, Munoz-Rueda A, Lea PJ. A study of photorespiratory ammonia production in the C4 plant Amaranthus edulis, using mutants with altered photosynthetic capacities. Physiol Plant. 1997;99:447–455. [Google Scholar]
- Laisk A, Edwards GE. Oxygen and electron flow in C4 photosynthesis: Mehler reaction, photorespiration and CO2 concentration in the bundle sheath. Planta. 1998;205:632–645. [Google Scholar]
- Laisk A, Edwards GE. A mathematical model of C4 photosynthesis: the mechanism of concentrating CO2 in NADP-malic enzyme type species. Photosynth Res. 2000;66:199–224. doi: 10.1023/A:1010695402963. [DOI] [PubMed] [Google Scholar]
- Laisk A, Loreto F. Determining photosynthetic parameters from leaf CO2 exchange and chlorophyll fluorescence. Plant Physiol. 1996;110:903–912. doi: 10.1104/pp.110.3.903. [DOI] [PMC free article] [PubMed] [Google Scholar]
- Laisk A, Oja V. Dynamics of Leaf Photosynthesis. Collingwood, Australia: Commonwealth Scientific and Industrial Research Organization Publishing; 1998. [Google Scholar]
- Leegood RC, von Caemmerer S. The relationship between contents of photosynthetic metabolites and the rate of photosynthetic carbon assimilation in leaves of Amaranthus edulis L. Planta. 1988;174:253–262. doi: 10.1007/BF00394779. [DOI] [PubMed] [Google Scholar]
- Maroco JP, Ku MSB, Furbank RT, Lea PJ, Leegood RC, Edwards GE. CO2 and O2 dependence of PSII activity in C4 plants having genetically produced deficiencies in the C3 and C4 cycle. Photosynth Res. 1998a;58:91–101. [Google Scholar]
- Maroco JP, Ku MSB, Lea P, Leegood R, Furbank R, Edwards GE. Oxygen requirement and inhibition of C4 photosynthesis: an analysis of C4 plants deficient in the C3 and C4 cycles. Plant Physiol. 1998b;116:823–832. doi: 10.1104/pp.116.2.823. [DOI] [PMC free article] [PubMed] [Google Scholar]
- Nobel PS. Physicochemical and Environmental Plant Physiology. New York: Academic Press; 1991. [Google Scholar]
- Porra RJ, Thompson WA, Kriedemann PE. Determination of accurate extinction coefficients and simultaneous equations for assaying chlorophyll a and b with four different solvents: verifications of the concentrations of chlorophyll standards by atomic absorption spectroscopy. Biochim Biophys Acta. 1989;975:384–394. [Google Scholar]
- Prinsley RT, Dietz K-J, Leegood RC. Regulation of photosynthetic carbon assimilation in spinach leaves after a decrease of irradiance. Biochim Biophys Acta. 1986;849:254–263. [Google Scholar]
- Servaites JC, Geiger DR. Regulation of ribulose 1,5-bisphosphate carboxylase/oxygenase by metabolites. J Exp Bot. 1995;46:1277–1283. [Google Scholar]
- von Caemmerer S. Biochemical Models of Leaf Photosynthesis. Collingwood, Australia: Commonwealth Scientific and Industrial Research Organization Publishing; 2000. [Google Scholar]
- Woodrow IE, Berry JA. Enzymatic regulation of photosynthetic CO2 fixation in C3 plants. Annu Rev Plant Physiol Plant Mol Biol. 1988;39:533–594. [Google Scholar]


