Abstract
We describe a highly efficient two-step single-cell reverse transcriptase-polymerase chain reaction technique for analyzing gene expression at the single-cell level. Good reproducibility and a linear dose response indicated that the technique has high specificity and sensitivity for detection and quantification of rare RNA. Actin could be used as an internal standard. The expression of message for Rubisco small subunit (RbcS), chlorophyll a/b-binding protein (Cab), sucrose (Suc):fructan-6-fructosyl transferase (6-SFT), and Actin were measured in individual photosynthetic cells of the barley (Hordeum vulgare) leaf. Only Actin was found in the non-photosynthetic epidermal cells. Cab, RbcS, and 6-SFT genes were expressed at a low level in mesophyll and parenchymatous bundle sheath (BS) cells when sampled from plants held in dark for 40 h. Expression increased considerably after illumination. The amount of 6-SFT, Cab, and RbcS transcript increased more in mesophyll cells than in the parenchymatous BS cells. The difference may be caused by different chloroplast structure and posttranscriptional control in mesophyll and BS cells. When similar single-cell samples were assayed for Suc, glucose, and fructan, there was high correlation between 6-SFT gene expression and Suc and glucose concentrations. This is consistent with Suc concentration being the trigger for transcription. Together with earlier demonstrations that the mesophyll cells have a higher sugar threshold for fructan polymerization, our data may indicate separate control of transcription and enzyme activity. Values for the sugar concentrations of the individual cell types are reported.
Photosynthesis and the synthesis of temporary storage polysaccharides are regulated separately in leaves. This is true both at the level of gene expression, apparently in response to internal sugar status (Smeekens, 2000), and at the level of fine control of enzyme activity (Stitt, 1995). Control of photosynthetic capacity helps to maintain optimal coupling between the capacity of the light reactions to harvest light energy and the capacity of the dark reactions to fix carbon. By contrast, changes in carbohydrate accumulation are frequently in response to changes in the balance between supply of and demand for fixed carbon (Farrar et al., 2000). One of the problems in demonstrating unequivocally that sugar status in vivo is a signal for control of expression of genes central to these processes is that tissues are heterogeneous. We have shown previously that photosynthesis and carbohydrate metabolism are highly cell specific in barley (Hordeum vulgare) leaves: The epidermis is effectively sugar-free, and the mesophyll and parenchymatous bundle sheath (BS) have different patterns of sugar, fructan, and starch accumulation (Williams et al., 1989; Koroleva et al., 2001). We would therefore predict that the expression of key genes underlying these processes is similarly cell specific. This paper sets out to test that idea.
There is evidence from other workers that several of the genes encoding proteins for photosynthesis and carbohydrate metabolism may be sugar regulated (Sheen, 1990; Krapp et al., 1993). Their expression is also altered by prolonged light treatment, perhaps acting by modifying sugar status (Matsukura et al., 2000). Rubisco small subunit (RbcS) and Suc:fructan-6-fructosyl transferase (6-SFT) are among these genes (Giuliano et al., 1988; Koroleva et al., 2000). The evidence suggesting that these genes are sugar regulated comes mainly from experiments where either unrealistically high-sugar concentrations are applied exogenously or the whole-tissue sugar status and whole-tissue gene expression are measured (Smeekens, 2000). Such experiments ignore cell specialization (Tomos et al., 2000) and the possibility that the sugars are predominantly in one cell type while the genes are being expressed in another. In this paper, we ask whether the expression of specific genes within individual cells is related to the concentrations of sugars within them.
Single-cell sampling and analysis (Tomos and Leigh, 1999), in which cell sap is extracted using a fine glass microcapillary, is the tool of choice for the localization of plant metabolites and enzymes (Fricke et al., 1994; Koroleva et al., 1998, 2000). It is now being applied to the study of mRNA distribution. Techniques of measuring mRNA in individual cells or microdroplets, previously applied to animal cells, offer a new approach to the understanding of processes, such as signal transduction and the modulation of multiple genes in individual cells (Chelly et al., 1989; Kumazaki et al., 1994; Brail et al., 1999). These have been adapted to plants (Karrer et al., 1995; Brandt et al., 1999; Gallagher et al., 2001; Koroleva et al., 2001) where reverse transcriptase (RT)-PCR of extracts from single cells has proved useful in amplifying specific mRNA leading to the detection of even rare mRNA transcripts from individual cells. In this study, we have applied a significantly improved method to study the abundance of chlorophyll a/b-binding protein (Cab) and RbcS mRNA in individual cells in barley leaves in situ. We have also studied the change of expression of 6-SFT, a gene that codes for a fructosyl transferase involved in the synthesis of storage fructan (Sprenger et al., 1995). For each of these proteins, the underlying physiology is well understood, and they constitute an ideal system in which to examine the regulation of gene expression at the single-cell level in response to environmental perturbations that alter internal sugar status. We also explored the use of Actin mRNA, a transcript expected to be present in low abundance (Karrer et al., 1995), as a constitutive internal standard to test the reproducibility and quantification of the method.
RESULTS
Use of an Internal Standard to Improve the Quantification of Differential Gene Expression
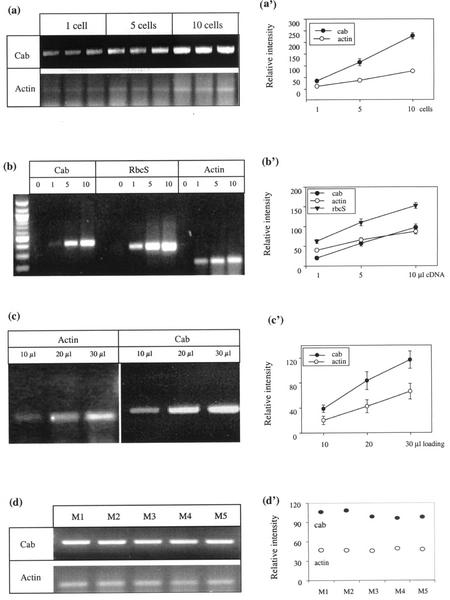
We performed three groups of experiments to assess our ability to quantify the abundance of specific mRNA species in individually sampled cell extracts and to determine the inherent variation associated with the experimental procedure (Fig. 1, a–c). Figure 1a presents the data for the expression of Actin and Cab in samples from one or pooled from five and 10 cells. Negative controls (no single-cell extracts in the RT-PCR mixture) did not show any signal. The expected bands of 204 (Actin) and 396 bp (Cab) were found from samples from single cells. The band intensity in samples from one and five mesophyll cells was some 10% and 50%, respectively, of the intensity from pooled samples from 10 mesophyll cells. Figure 1b illustrates a comparable relationship between signal intensity and different amounts of cDNA added to the PCR mixture. As expected, increasing amounts of cDNA template produced proportionally higher amounts of product. Figure 1c shows that the intensity of the band increased progressively with an increase in volume of PCR products loaded on the gel. We finally compared expression between replicate single-cell samples to determine the inherent variability of the technique. Five individual aliquots, obtained from a pool of 10 mesophyll cells, were each extracted separately for mRNA and were subjected to RT-PCR. There was very little variation between the samples (Fig. 1d). These results indicate that both the RT-PCR and the loading steps contribute minimally to any observed heterogeneity.
Figure 1.
Signal reproducibility and quantification and the assessment of the use of Actin mRNA as a constitutive “internal” standard to normalize the spot intensities to sample cytoplasmic volume. a, Signal for Cab and Actin gene samples from one or pooled from five or 10 mesophyll cells extracted from three different plants. b, Signals obtained from 1, 5, or 10 μL of cDNA (RT product from three pooled cell extracts). c, Signals obtained from loading 10, 20, and 30 μL of RT-PCR products. d, Ten mesophyll cells were mixed in lysis/binding buffer and divided into five equal aliquots (M1, M2, M3, M4, and M5). Each sample was applied to RT-PCR separately and each RT-PCR product was loaded onto agarose gel. a′ through d′ illustrate relative intensities quantified using image analysis. Error bars = sd of the mean of the three samples (when not shown, they are smaller than the dimension of the symbol).
To quantify the level of expression of the genes of interest, we used the Actin gene as an internal standard, based on the hypothesis that it is a constitutively expressed message. Figures 2 through 4 show that Actin gene transcripts were detected in all three-cell types and under all treatments. Similar transcript levels were found in all of the different samples from the groups of individual cells under different light conditions.
Figure 2.
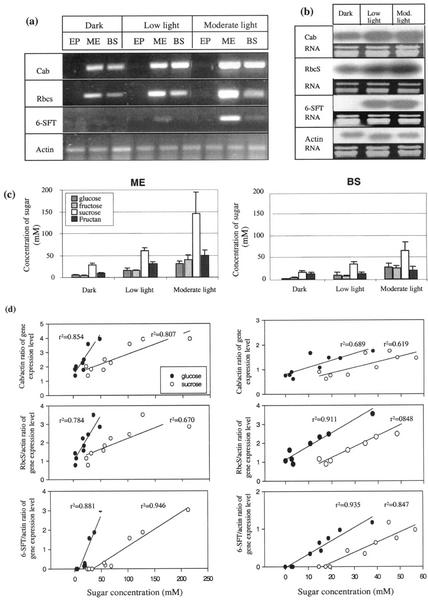
Expression of light-regulated genes (Cab, RbcS, and 6-SFT) and sugar concentration in different cell types: epidermal (EP), mesophyll (ME), and parenchymatous BS of barley plants grown under different light conditions (dark, low light [100 μmol photons m−2 s−1], and moderate light [500 μmol photons m−2 s−1]). a, Ethidium bromide-stained gel. b, Northern blots labeled with sequence-specific cDNA probes of extracts of leaves treated with different light intensities: dark, low light, and moderate light. Total RNA 5 μg for RbcS; and 10 μg for Cab, 6-SFT, and Actin. c, Concentration of sugars in mesophyll (ME) and parenchymatous BS cells. d, Correlation between amount of gene transcripts (expressed relative to actin) and concentration of Glc and Suc.
Figure 4.
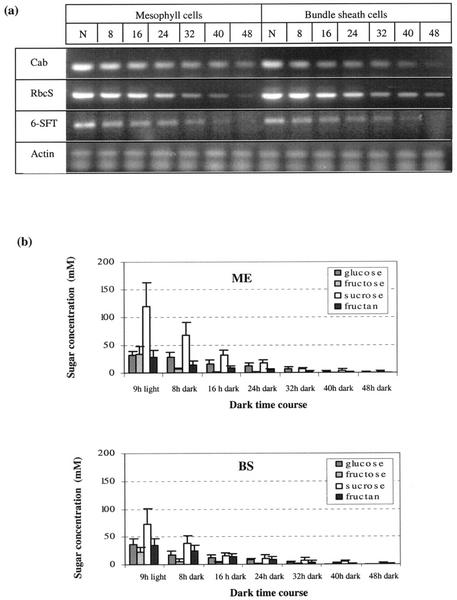
Cab, RbcS, 6-SFT, and Actin gene expression and sugar concentration in mesophyll and parenchymatous BS cells during a dark time course. N represents normal light regime plants (9 h of light). a, Ethidium bromide-stained gel. b, Sugar concentration in mesophyll and parenchymatous BS cells.
Taken together, these data suggest that we are justified in taking the intensity of the Actin signal from the various samples as a measure of inherent variability in the sampling and analytical procedures.
Influence of Light Intensity on the Accumulation of Specific mRNA in Leaf Epidermal, Mesophyll, and Parenchymatous BS Cells
Northern-blot analysis clearly showed that light induces Cab, RbcS, and 6-SFT transcriptions in whole barley leaves (Fig. 2b). Also, in each case, more transcripts were found in leaves exposed to moderate light than to low light. In contrast, Actin would appear to be constitutively expressed.
Accumulation of Cab, RbcS, and 6-SFT gene transcripts was measured in different individual cells sampled from leaves after 9 h of exposure to low and moderate irradiance and to 40 h of darkness. Cab, RbcS, and 6-SFT mRNA were detected in samples from both the mesophyll and BS cells, but not from epidermal cells (Fig. 2a). In both mesophyll and BS cells, these genes were expressed at a lower level in the dark (where 6-SFT was generally not detectable) and in low light than in extracts from plants grown in moderate light. Light-associated accumulation of Cab, RbcS, and 6-SFT mRNA occurred in both mesophyll and BS cells. No change of Actin gene transcription was observed in any cells under the different light conditions.
If the Actin signal is proportional to cytoplasmic volume in each sample, then we can compare the relative concentrations of the other mRNA species in the different cell types. This approach suggests that Cab, RbcS, and 6-SFT mRNA accumulation in mesophyll cells was generally higher than in BS cells. Applying a statistical sign test to the results of nine independent experiments (data not shown), the level of Cab and 6-SFT transcription was significantly higher in mesophyll than in BS cells (P = 0.004).
The Time Course of Light-Dependent Accumulation of mRNA in Leaf Mesophyll and Parenchymatous BS Cells
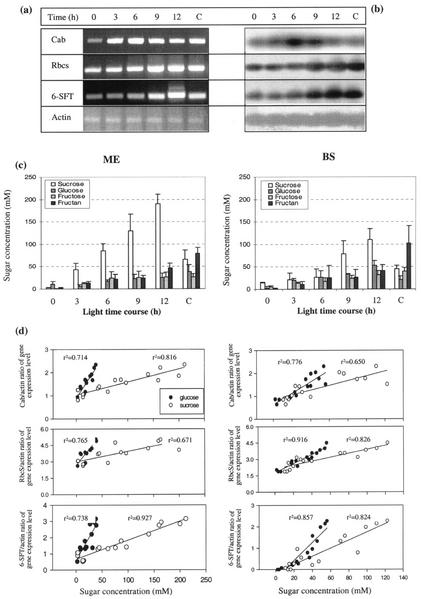
To investigate the time course of the light-dependent accumulation of Cab, RbcS, and 6-SFT mRNA in mesophyll cells, we exposed 18- to 20-d-old plants that had been kept in the dark for 40 h to 0, 3, 6, 9, and 12 h light. Control plants were kept in continuous light for 5 d before sampling. The genes studied were transcribed at a lower level in plants grown in the dark for 40 h (Fig. 3a). For example, RbcS was present at 45% of its maximum level at 12 h. Upon illumination, the amount of mRNA increased for about 6 and 9 h for Cab and RbcS, respectively. The increase continued for the entire 12-h period for 6-SFT, although there was only a small increase during the first 6 h. Plants held in continuous light generally showed lower transcript levels than the maxima for the induced plants. No change was observed in the level of Actin transcript.
Figure 3.
The time course of expression of light-dependent (Cab, RbcS, and 6-SFT) and Actin genes and sugar concentration from groups of three mesophyll cells extracted from 19-d-old barley seedlings that had been kept in the dark for 40 h. Light exposure began at time 0 h. Control samples were taken after 5 d of continuous light (C). a, Ethidium bromide-stained gel. b, Southern blots of the same gel with probes of Cab, RbcS, 6-SFT, and Actin cDNA. c, Concentration of sugar in mesophyll (ME) and parenchymatous BS cells. d, Correlation between gene expression (relative to actin) and sugar concentration (Glc and Suc) during time course of light.
The disappearance of RbcS, Cab, and 6-SFT mRNA accumulation in the absence of light was studied by transferring plants to continuous darkness and measured mRNA levels during a dark time course (Fig. 4a). The results showed that RbcS, Cab, and 6-SFT mRNA levels decline continuously over period of 48 h. Very little mRNA of 6-SFT was found after 40 h of darkness. Cab and RbcS mRNA were at very low levels after 48 h of darkness. No significant difference was found between mesophyll and BS cells on the pattern of gene expression.
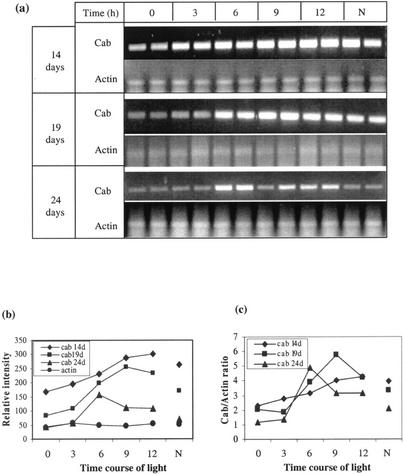
To detect changes in gene expression during development, we analyzed the time course of light-dependent mRNA accumulation at three different leaf ages. Because of its ease of measurement as the result of its high expression, we chose to use the Cab gene (Fig. 5, a and b). For younger plants (14 d old, generally before full expansion of the third leaf), the level of Cab expression was highest after 12 h of light. For 19- and 24-d-old plants (when the third leaf was fully expanded), the maximum expression occurred after 9 and 6 h of light, respectively. Normalized against the Actin signal of the cell samples, similar amounts of Cab mRNA were detected in mesophyll cells as the leaves grew older, although the difference in the day of maximum expression remained (Fig. 5c). There appears to be a change in the response to light as the leaf aged.
Figure 5.
Time course of Cab and Actin gene expression upon illumination in barley leaf mesophyll samples from the third leaf of different aged plants (14, 19, and 24 d old). Full expansion of the leaf was around 18 d. Each plant had been maintained in continuous darkness for 40 h before illumination and analysis, except for those labeled N, which were sampled 9 h into the light period of normal diurnal plants. Each time point represents three pooled single-cell samples replicated from two different plants. a, Ethidium bromide-stained gel. b, The mRNA abundance was quantified as in Figure 2 (the data from the two plants were averaged). c, Cab to Actin ratio of gene relative expression level.
Influence of Light Conditions on Sugar Concentrations of Leaf Epidermal, Mesophyll, and Parenchymatous BS Cells
Light Intensity
After 40 h in darkness the concentrations of sugars are very low in both mesophyll and BS cells (Fig. 2c). In epidermal cells under all conditions, these concentrations are below the detection limit of the technique (approximately 5 mm; data not shown). Light treatment increases Fru, Glc, and Suc in both mesophyll and BS cells with their concentrations under moderate light being approximately double those at low light. Meanwhile, fructan increases with light intensity in the mesophyll but not in the BS cells. In general, Suc accumulation in mesophyll was much higher than that in BS cells under all light conditions.
Light Time Course
Nearly all of the sugars increased during illumination. Suc especially had increased considerably and reached a maximum at 12 h of treatment in both mesophyll and BS cells. Suc was always higher in mesophyll cells than in BS cells. In plants exposed to 5 d of continuous light, Suc had decreased significantly in both mesophyll and BS cells. However, continuous light stimulated fructan synthesis. Glc and Fru remained relatively constant over 5 d of continuous light (Fig. 3c).
Dark Time Course
The concentration of all kinds of sugar decreased gradually in continuous darkness. Very low-sugar contents were detected after 32 h of darkness (Fig. 4b).
The fructan to Suc ratio was generally higher for BS cells than for the mesophyll under different light conditions. For example, for the cells after 9 h of illumination, the fructan to Suc ratio was 0.406 in BS cells, but only 0.251 in mesophyll.
Correlation between Gene Expression and Concentration of Sugar in Mesophyll and BS Cells
To investigate whether there is a relationships at the level of the individual cells between gene transcripts and sugar status, measurements of the transcript levels (ratio of specific gene/actin) of each of the light-induced genes were compared with the concentrations of the sugars and fructan in adjacent cells of the same leaves. In one series, the leaves were exposed to the same range of light regimes as described above (40 h of darkness, 9 h of low light, and 9 h of moderate light; Fig. 2). In the second, the cells were sampled over a time course of 12 h of illumination in moderate light (Fig. 3). In both experiments, a clear correlation between Cab, RbcS, and 6-SFT gene transcript levels and cell concentrations of both Glc and Suc were observed for both mesophyll and BS cells (Figs. 2d and 3d).
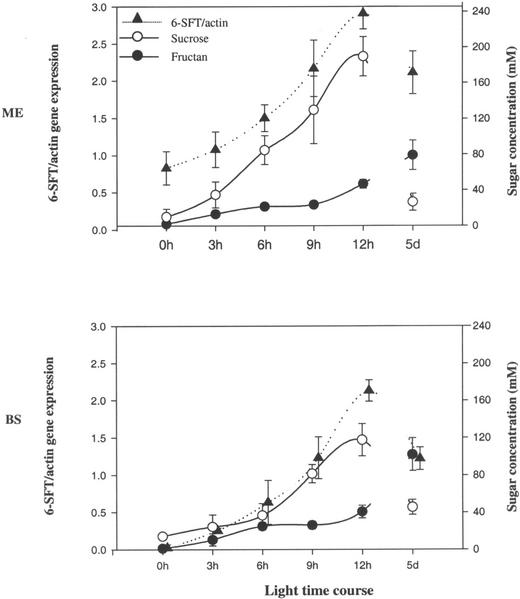
The relationship between the 6-SFT transcripts, Suc and fructan, is illustrated in Figure 6. In this case, the plants had been maintained previously in the dark for 40 h. A difference was observed in the behavior of the mesophyll and BS cells of the same leaves (Fig. 6). In both cell types, both fructan and Suc had fallen to very low levels before illumination. The 6-SFT transcript has dropped to levels below the detection limit in the BS cells, but was still detectable in this experiment at a moderate level in the mesophyll cells.
Figure 6.
A relationship between 6-SFT expression (relative to actin) and sugar concentration (Suc and fructan) in mesophyll (ME) and parenchymatous BS cells during time course of light and 5 d (5d) continuous light. Each data point is an average ± sd for three to four samples from different leaves.
In the experiment illustrated in Figure 6, both Suc and fructan were significantly elevated in these cells by 3 h, suggesting that their synthesis began immediately when light became available. Suc concentrations increased monotonically and coordinately with 6-SFT transcripts in both cell types. In contrast, fructan concentration appeared to “stall” between 6 and 9 h before recovering its increase by 12 h, after which a gentle increase was maintained to 5 d. In epidermal cells, under all conditions, sugar concentrations are below the detection limit of the technique (approximately 5 mm; data not shown).
The Nature of the Transcript Induction by Light
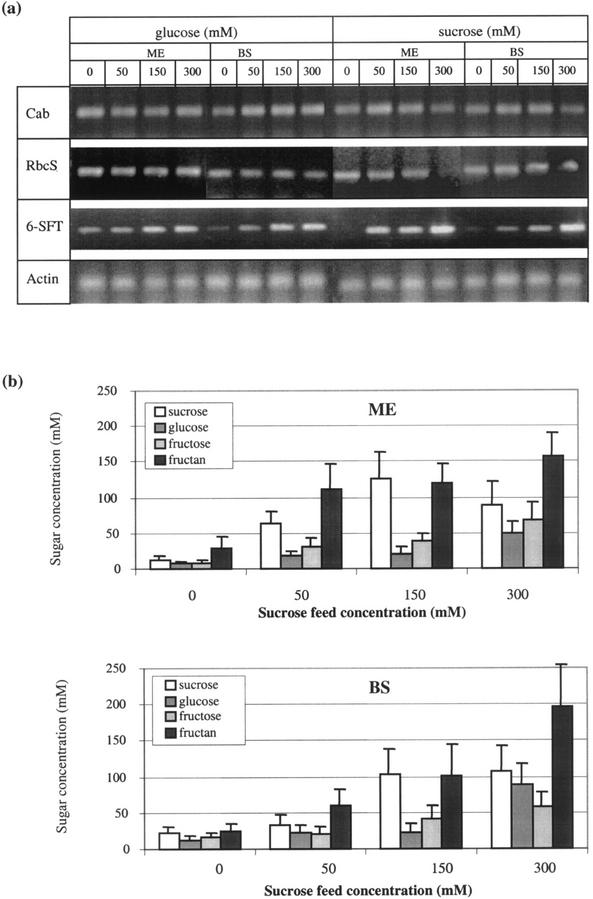
Because it was not expected that light per se is the direct inducer of 6-SFT, an experiment was performed during which the sugar content of the cells was elevated in the absence of illumination. This was achieved by feeding Suc and Glc to excised leaves via the exposed xylem. Under these conditions 6-SFT transcript was induced but that of Cab and RbcS was not (Fig. 7).
Figure 7.
Expression of light-dependent genes (Cab, RbcS, and 6-SFT) and sugar concentration in mesophyll (ME) and parenchymatous BS cells sampled from excised leaves incubated in various solutions (0–300 mm) Glc or Suc for 40 h in the dark. Each data point is an average ± sd for three to four samples from different leaves.
As discussed below, it is thought that although the 6-SFT correlation may be a direct effect of sugar on transcription, that of Cab and RbcS was not. The data provide circumstantial evidence for this.
DISCUSSION
Our aim was to test the hypothesis that the expression of the key genes RbcS, Cab, and 6-SFT underlying photosynthesis and fructan synthesis is cell type specific, matching the underlying physiology of these processes. We also asked whether the concentrations of key carbohydrate found related to the expression of these specific genes within individual cells. Before examining the answers to these questions, however, we will assess the technique we have used.
Technical Advances
The key questions are whether our RT-PCR technique is adequate for the small copy numbers sampled from individual cells and how quantitative is the technique. Being able to measure the abundance of individual mRNA species in specific cells without resorting to reporter gene technology is of considerable value in the study of tissue-level compartme-ntation.
Although RT-PCR techniques have been widely used to measure gene expression in tissues, resolution is limited by the amount of mRNA within the sample (typically 0.1–1 pg). We have previously reported a method for detecting a small range of genes from single cells using RT-PCR, however, the method was only able to detect high-expression genes (Gallagher et al., 2001). Therefore, RT-PCR procedures with higher sensitivity are needed for the reliable analysis of gene expression at the single-cell level. In this study, we describe a novel, highly efficient two-step single-cell RT-PCR method based on the use of Sensiscript RT and HotStar Taq DNA polymerase (Qiagen USA, Valencia, CA). Bosch et al. (2000) compared the Qiagen Sensiscript RT with the commonly used Moloney murine leukemia virus or Moloney murine leukemia virus H enzyme. They found the use of Sensiscript resulted in an approximately 100-fold improvement in the cDNA detection level. The highly specific PCR with HotStar Taq DNA polymerase provided for a high-temperature activation step in the PCR technique that eliminated the formation of nonspecific amplification products. Together, this combination ensured highly specific and reproducible RT-PCR. Reproducibility was maintained at all steps from mRNA extraction, through RT and PCR, to gel loading (Fig. 1, b–d).
We used two-step RT-PCR where cDNA representative of the total mRNA pool was initially synthesized by RT. The second-step PCR using this pool could then be optimized independently for each gene of interest without constraining the RT step. Furthermore, the ability to subsample aliquots of the products of the first RT reaction for second-stage PCR allowed the investigation of the spatial and temporal expression of several target genes from the same original sample. Several figures show the response to illumination of expression for four different genes (Actin, Cab, RbcS, and 6-SFT) from the same cell.
In general, a quantitative RT-PCR method consists of four steps: generation of internal standards, RT-PCR, detection of products, and data analysis. To quantify the level of expression of the genes of interest, we investigated the use of the Actin gene expression as an internal standard. Two lines of evidence suggest that Actin message is suitable for this role. First, it produced a linear standard curve, and second, it provided a remarkably uniform signal in replicate samples taken during several light-dependent time courses (Figs. 1 and 3). We took two approaches to test the quantification of our measurements, because such small quantities are involved and it was not possible to use the conventional technique of loading known aliquots of total mRNA on gels. The most direct was the construction of “standard curves” for the superabundant Cab and the less abundant Actin message. Better reproducibility was predictably obtained from the pooled samples, but even single-cell samples provided acceptable data. This suggests that reproducible cytoplasmic volumes were obtained and that the RT-PCR procedure did not enter the saturation phase of the reaction. Evidence of the absence of saturation can also be obtained from estimating the quantity of the expressed message by comparison with the quantitative standard DNA ladder run with each sample.
Finally, the northern blots obtained from whole-leaf extracts of plants treated under different light intensity showed clear qualitative similarity with the information gained from the RT-PCR products of the individual cells. The results were as would be expected if the whole leaf represented the averaged pool of the different cell types.
The Effect of Light and Sugar on Gene Expression
Measurements of expression after illumination of leaves showed significant changes in message abundance. RbcS and Cab transcript increase continuously during induction in bulk pea (Pisum sativum) leaf for up to 24 h (Khanna et al., 1999), whereas Brandt et al. (1992) showed that Cab increases in barley leaves for at least 8 h. A circadian rhythm in transcription entrained by light has also been demonstrated for Cab in Arabidopsis (Thain et al., 2000). We found a similar time course in individual mesophyll cells, although there is little increase in transcript after 6 to 9 h for Cab and 9 to 12 h for RbcS. In both cases, continuous light results in lower (or similar in the case of Southern blot) values, possibly because of the repression of these genes (Dijkwel et al., 1997) by the Suc accumulation that occurs under continuous light (Housley and Pollock, 1985).
Sprenger et al. (1995) demonstrated an increase in 6-SFT transcript in bulk extracts from leaves illuminated for 24 h. Müller et al. (2000) subsequently showed that it is also induced in the dark when Suc is supplied to excised leaves.
In this study, quantitative correlation of transcript levels of each of the studied genes with Suc, Glc, and fructan concentrations have provided novel information regarding their interrelationship (Fig. 7). There are good linear correlations between both cell Glc and Suc concentrations and the (actin-normalized) transcript levels for Cab, RbcS, and 6-SFT in both cell types under the various light regimes. This could be superficially interpreted to mean that all three genes are induced by both sugars. Furthermore, this induction would appear to be more sensitive to Glc than to Suc. However, when Glc and Suc were fed to the excised leaf bases in the dark, although 6-SFT transcript levels displayed the same correlation to the sugars, no increase in Cab and RbcS transcript was observed. This was not surprising because their induction is a direct effect of light (Quail, 1991; Kloppstech, 1997), which also (coincidentally) increases sugar content. Cab and RbcS transcription is not induced by sugar.
The 6-SFT transcript is induced in the absence of light. From our experiments, however, we are unable to determine whether Suc or Glc or both are involved. Under the conditions used here, we did not inhibit the metabolic exchange between the Glc and Suc pools. The apparent increased sensitivity to Glc probably has no significance and may merely illustrate the poise of the Suc-Glc balance in these cells.
Is Gene Expression Specific to Different Cell Types?
The genes coding for chloroplast protein, Cab and RbcS, were generally only expressed in the photosynthetic cell types of mesophyll and BS. The transcripts cannot be detected in samples from epidermal cells harvested in the light. Dark or low-light intensity grown plants exhibited that RbcS gene was transcribed at similar level in both mesophyll and BS cells; however, under moderate light, RbcS transcripts were higher in mesophyll than that in BS cells. The difference is likely regulated by light-induced developmental signals or conditions. A mutation, BS defective2, that involved maintenance of BS cell-specific photosynthetic enzymes and chloroplast structure was found in Roth's group (Roth et al., 1996). They suggested that differential accumulation of RbcS is controlled posttranscriptionally and that such mechanisms contribute to the suppression of RbcS mRNA levels in BSl cells. A much stronger differential between the two cell types is observed for Cab (Fig. 2). The differential Cab gene transcript pattern may be caused by differences in their chloroplast development. BS cells represent only about 15% of chloroplast-containing cells in the leaf (Kinsman and Pyke, 1998). Also, some evidence suggests that reduced Cab gene expression in BS cells might be caused directly by a phytochrome-pathway-specific regulator (Li et al., 1995). A CUE1 (for Cab underexpressed) gene of Arabidopsis has been isolated that is a cell-specific positive regulator linking light and intrinsic development in leaf mesophyll cells. The mutant showed defects in expression of several light-dependent genes and in chloroplast development, specifically in mesophyll cells.
Light-dependent transcript levels of 6-SFT in mesophyll cells, when normalized to Actin, are considerably higher than that in BS cells. This higher level of 6-SFT mRNA is not immediately consistent with the observation that BS cells appear to have a lower Suc threshold for the induction of fructan biosynthesis than do mesophyll cells (Koroleva et al., 1998). It suggests, however, that transcription and enzyme activity may be controlled in different ways in different cell types.
6-SFT Transcript and Fructan Synthesis in the Individual Cells
In this work, the sugar concentrations of individual epidermal, mesophyll, and BS cells were taken from cells adjacent to those sampled for gene expression. One statistically significant experiment provided further insight into the interrelationships illustrated in Figure 6. In this experiment, after 40 h of darkness, the level of 6-SFT transcripts had dropped below the detection limit in the BS cells but had not done so in the mesophyll cells. Upon illumination, the transcript level began to increase immediately with a similar time course in both cell types (Fig. 8). Upon illumination, the levels of fructan, the 6-SFT enzyme product, also immediately began to rise—reaching 20 mm (hexose equivalents) by 6 h. Such a rapid synthesis of fructan shows that significant quantities of the active enzyme must have been present in both cell types. In the case of the BS cell, this was in the absence of gene transcript and indicates the persistence of protein in the absence of message. The rate of initial fructan synthesis in these BS cells is presumably regulated by the availability of Suc substrate rather than either protein or transcript availability.
Figure 8.
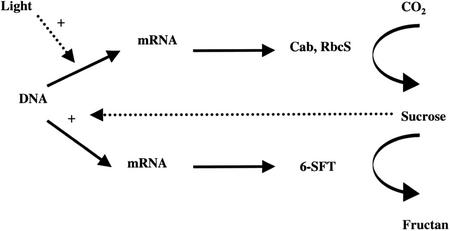
Diagram illustrates the direct and indirect effect of light on the expression of 6-SFT and the photosynthetic genes Cab and RbcS.
A reproducible feature of Figure 8 is the “stall” in fructan accumulation between 6 and 9 h. We speculate that this may be attributable to the accumulation in these (starved) cells of two classes of fructan that we cannot distinguish with our enzymatic assay. The first form, synthesized by the persistent protein, saturates at about 20 mm; whereas the second form, synthesized by protein translated from freshly transcribed message, accumulates after 9 h (reaching 80 and 100 mm in the mesophyll and BS cells, respectively, by 5 d of continuous illumination). That this second phase of fructan synthesis is a direct consequence of 6-SFT transcription is however unlikely, because we show that in the mesophyll cells, the transcript also persists at significant levels after 40 h in the dark. The actual transcript levels after 5 d in continuous light are lower than those measured 12 h into the photoperiod. It would appear that if 6-SFT does increase for 24 h during a single light period (Müller et al., 2000), additional levels of regulation prevent such accumulation in continuous light.
The fructan to Suc ratio is higher in the BS cells than that in mesophyll cells, suggesting that lower threshold for the initiation of fructan synthesis for BS cells is needed to preserve downhill gradient between mesophyll and vasculature as suggested by Koroleva et al. (1998). This is important for efficient transport of Suc toward the phloem.
The evidence in this paper supports the views that (a) different cell types in cereal leaves that differ in photosynthetic and carbohydrate metabolism show parallel differences in expression of specific genes and (b) that the expression of these genes after illumination is consistent with sugar being a signal which directly or indirectly regulates gene expression (Fig. 8).
MATERIALS AND METHODS
Plant Material and Growth Conditions
Barley (Hordeum vulgare) was grown as described previously (Koroleva et al., 1998). All samples were taken from the upper surface of the middle parts of the third leaf. For each experiment, leaves of similar developmental age (as judged by their state of full expansion) were chosen as replicates. For experiments on leaves in darkness, groups of three 18- to 20-d-old plants (14–16 d after transfer to Long-Ashton solution) were transferred to opaque 250-mL containers at 20°C, wrapped in aluminum foil, and grown on for 40 h (the nutrient solution was topped up each day). Samples were taken from plants that were illuminated for 0, 3, 5, 9, and 12 h after the 40-h dark period (at either 100 or 500 μmol photons m−2 s−1; see text). Eighteen- to 20-d-old plants were exposed to continuous light (500 μmol photons m−2 s−1) for 5 d (referred to as continuous).
mRNA Extraction from Single Cells
The cell contents were extracted from individual epidermal, mesophyll, and BS cells using a fine silanized glass microcapillary (Fricke et al., 1994; Tomos et al., 1994; Koroleva at al., 1998), except that an air-filled capillary (rather than one back-filled with buffer or oil) was used for RNA extraction. This made it much easier to see cell sap after single-cell aspiration and considerably increased the success rate. The cell contents were forced into the microcapillary by cell turgor pressure. In most cases, samples analyzed by RT-PCR were pooled from three adjacent cells sampled in sequence over approximately 1 min for epidermal and 3 min for subsurface cells. This reduced between-sample variation without losing the fine resolution of single-cell sampling and analysis. Individual epidermal and BS cell samples had a volume of approximately 100 pL, whereas those from individual mesophyll cells were smaller (20–50 pL). Samples (25 mg) of whole-leaf tissue were used as control. The glass tip was inserted through a stomatal pore to reach mesophyll and BS cell while avoiding epidermal contamination (Fricke et al., 1994; Koroleva et al., 1998). Each sample was then immediately expressed, using the air pressure from a syringe, into a 0.5-mL microcentrifuge tube containing 80 μL of lysis/binding buffer (100 mm Tris-HCl, pH 7.5, 500 mm LiCl, 10 mm EDTA, 1% [w/v] lithium dodecyl sulfate, 5 mm dithiothreitol, and 10 units of RNase inhibitor [RNAsin, Promega, Madison, WI]; Dynal Biotech, Oslo). This lysate was transferred to a new tube containing 20 μL of oligo(dT)25 (Dynabeads, Dynal Biotech) prewashed with lysis/binding buffer. The mixture was incubated at room temperature with gentle rolling for 5 min. The mRNA was then purified using a magnetic particle concentrator (Dynal Biotech) and washed twice with 100 μL of washing buffer Dynal A (10 mm Tris-HCl, pH 7.5, 0.15 m LiCl, 1 mm EDTA, and 0.1% [w/v] lithium dodecyl sulfate) and washing buffer Dynal B (10 mm Tris-HCl, pH 7.5, 0.15 m LiCl, and 1 mm EDTA).
RT-PCR
RT was performed using a Sensiscript RT kit (Qiagen USA). For each reaction, first-strand cDNA was synthesized in 20 μL containing 2 μL of 10× RT buffer, 2 μL of dNTP (final concentration of 0.5 mm each), 1 μL of RNase inhibitor (10 units μL−1; Promega), 1 μL of Sensiscript RT, and 14 μL of diethylpyrocarbonate-treated water. To start the reaction, the mix was added to the extracted mRNA bound to the magnetic beads. The reaction was incubated at 37°C for 60 min. For the PCR reaction, 4 or 5 μL of cDNA from the RT reaction was added to HotStar Taq Master Mix (Qiagen USA; 2.5 units of HotStar Taq DNA polymerase), PCR buffer (1.5 mm MgCl2, 10 mm Tris-HCl, pH 8.4, 50 mm KCl, and 5 mm dithiothreitol), 0.2 mm dNTP, and specific primers (0.5 μm each primer) in a total volume of 25 μL. Primer sequences were as follows: Cab sense primer, 5′-GACCAACGGCAGAATC GACCA; Cab antisense primer, 5′-ATGAGAAGGA CCTGGAAGCC (396 bp; accession no. X63197); Actin sense primer, 5′-CCCAG CATTGTAGGAAGGC; Actin antisense primer, 5′-CCTCGGTGCGACACGGAGC (204 bp; accession no. U21907); RbcS sense primer, 5′-AGGTGTGGCCGATTG AGGGT; RbcS antisense primer, 5′-CGATGA AGCTGACGCACTGC (342 bp; accession no. AB020943); 6-SFT sense primer, 5′-GCAGCGCAGCG GTT ACCATT; and 6-SFT antisense primer, 5′-CATGAT GACCGTCCCGTTGG (271 bp; accession no. X83233). These gene sequences were obtained from the GenBank database, and the primers were designed using Vector NTI Suite (InforMax, Bethesda, MD). The PCR program consisted of 15 min at 95°C, followed by 35 cycles of 40 s at 94°C, 40 s at 54°C to 59°C, and 60 s at 72°C. The final extension step was for 10 min at 72°C.
Quantification of PCR Products
PCR products (10 μL) were separated by electrophoresis in 1.8% (w/v) agarose, and the DNA was visualized by ethidium bromide using an UV transilluminator and then photographed. To quantify band intensities, we used a quantified 100-bp DNA ladder (New England BioLabs, Beverly, MA) as a standard. The signal intensities were estimated by ID Image Analysis Software (Kodak Digital Science, Rochester, NY). The gel was then used for Southern blotting on Hybond-N+ nylon membrane (Amersham Biosciences AB, Uppsala) and fixed using an UV cross-linker light (254 nm) of 120,000 μJ cm−2 (Hoefer UVC 500, Amersham Biosciences AB). Probes were made using an enhanced chemiluminescence labeling kit (Amersham Biosciences AB) and hybridized to the target DNA on the membrane. After hybridization, the filters were washed to remove unlabeled probe and then analyzed using an ECL detection system to make an image on x-ray film (Heslop-Harrison et al., 1990).
RNA Isolation and Northern-Blot Analysis
Total RNA was extracted using RNeasy Plant Mini Kit (Qiagen USA) according to the manufacturer's instructions. Total RNA (5–10 μg) was separated by denaturing formaldehyde agarose gel electrophoresis and transferred onto a Hybond-N+ membrane (Amersham Biosciences AB). Equal loading of RNA in each lane was verified by ethidium bromide staining of RNA in the gel. The blots were hybridized with [α-32P]dCTP gene-specific cDNA probes using Rediprime (Amersham Biosciences AB). Prehybridization, hybridization, and membrane washes were performed as described previously (Lu et al., 2001).
Sugar Assay in Individual Cell Saps
The concentration of sugar (Glc, Fru, Suc, and fructan) in single-cell samples were measured by a microfluorometric assay (Koroleva et al., 1998).
ACKNOWLEDGMENTS
We thank Dr. Ron Skadsen (U.S. Department of Agriculture, CCRU, Madison, WI), Prof. David Collinge (The Royal Veterinary and Agricultural University, Copenhagen), Dr. Tsuneo Sasanuma (Kyoto University, Japan), and Dr. Alain Meyer (Botanisches Institut der Universiät Basel, Switzerland) for the Actin, Cab, 6-SFT, and RbcS gene clones used for making probes.
Footnotes
This work was supported by the Biotechnology and Biological Sciences Research Council of the UK.
Article, publication date, and citation information can be found at www.plantphysiol.org/cgi/doi/10.1104/pp.008979.
LITERATURE CITED
- Bosch I, Melichar H, Pardee AB. Identification of differentially expressed genes from limited amounts of RNA. Nucleic Acids Res. 2000;28:E27–E27. doi: 10.1093/nar/28.7.e27. [DOI] [PMC free article] [PubMed] [Google Scholar]
- Brail LH, Jang A, Billia F, Iscove NN, Klamut H, Hill RP. Gene expression in individual cells: analysis using global single cell reverse transcription polymerase chain reaction (GSC RT-PCR) Mutat Res Genom. 1999;406:45–54. doi: 10.1016/s1383-5726(98)00009-0. [DOI] [PubMed] [Google Scholar]
- Brandt J, Nielsen VS, Thordal-Christensen H, Simpson DJ, Okkels JS. A barley cDNA clone encoding a type III chlorophyll a/b-binding polypeptide of the light harvesting complex II. Plant Mol Biol. 1992;19:699–703. doi: 10.1007/BF00026796. [DOI] [PubMed] [Google Scholar]
- Brandt S, Kehr J, Walz C, Imlan A, Willmitzer L, Fisahn J. A rapid method for detection of plant gene transcripts from single epidermal, mesophyll and companion cells of intact leaves. Plant J. 1999;20:245–250. doi: 10.1046/j.1365-313x.1999.00583.x. [DOI] [PubMed] [Google Scholar]
- Chelly J, Concordet JP, Kaplan JC, Kahn A. Illegitimate transcription: transcription of any gene in any cell type. Proc Natl Acad Sci USA. 1989;86:2617–2621. doi: 10.1073/pnas.86.8.2617. [DOI] [PMC free article] [PubMed] [Google Scholar]
- Dijkwel PP, Huijser C, Weisbeek PJ, Chua NH, Smeekens SCM. Sucrose control of phytochrome A signaling in Arabidopsis. Plant Cell. 1997;9:583–595. doi: 10.1105/tpc.9.4.583. [DOI] [PMC free article] [PubMed] [Google Scholar]
- Farrar J, Pollock C, Gallagher J. Sucrose and the integration of metabolism in vascular plants. Plant Sci. 2000;154:1–11. doi: 10.1016/s0168-9452(99)00260-5. [DOI] [PubMed] [Google Scholar]
- Fricke W, Leigh RA, Tomos AD. Concentrations of inorganic and organic solutes in extracts from individual epidermal, mesophyll and bundle-sheath cells of barley leaves. Planta. 1994;192:310–316. [Google Scholar]
- Gallagher JA, Koroleva OA, Tomos AD, Farrar JF, Pollock CJ. Single cell analysis technique for analysis of specific mRNA abundance in plant cells. J Plant Physiol. 2001;158:1089–1092. [Google Scholar]
- Giuliano G, Hoffman N, Ko K, Scolnik PA, Cashmore AR. A light-entrained circadian clock controls transcription of several plant genes. EMBO J. 1988;7:3635–3642. doi: 10.1002/j.1460-2075.1988.tb03244.x. [DOI] [PMC free article] [PubMed] [Google Scholar]
- Heslop-Harrison JS, Leitch AR, Schwarzacher T, Anamthawat-Jonsson K. Detection and characterisation of 1B/1R translocations in hexaploid wheat. Heredity. 1990;65:385–392. [Google Scholar]
- Housley TL, Pollock CJ. Photosynthesis and carbohydrate metabolism in detached leaves of Lolium temulentum L. New Phytol. 1985;99:499–507. [Google Scholar]
- Karrer EE, Lincoln JE, Hogenhout S, Bennett AB, Bostock RM, Martinean B, Lucas W, Gilchrist DG, Alexander D. In situ isolation of mRNA from individual plant cells: creation of cell-specific cDNA libraries. Proc Natl Acad Sci USA. 1995;92:3814–3818. doi: 10.1073/pnas.92.9.3814. [DOI] [PMC free article] [PubMed] [Google Scholar]
- Khanna R, Lin X, Watson J. Photoregulated expression of the PsPK3 and PsPK5 genes in pea seedlings. Plant Mol Biol. 1999;39:231–242. doi: 10.1023/a:1006154203639. [DOI] [PubMed] [Google Scholar]
- Kinsman EA, Pyke KA. Bundle sheath cells and cell-specific plastid development in Arabidopsis leaves. Development. 1998;125:1815–1822. doi: 10.1242/dev.125.10.1815. [DOI] [PubMed] [Google Scholar]
- Kloppstech K. Light regulation of photosynthetic genes. Physiol Plant. 1997;100:739–747. [Google Scholar]
- Koroleva OA, Farrar JF, Tomos AD, Pollock CJ. Carbohydrates in individual cells of epidermis, mesophyll, and bundle sheath in barley leaves with changed export or photosynthetic rate. Plant Physiol. 1998;118:1525–1532. doi: 10.1104/pp.118.4.1525. [DOI] [PMC free article] [PubMed] [Google Scholar]
- Koroleva OA, Tomos AD, Farrar JF, Gallagher J, Pollock CJ. Carbon allocation and sugar status in individual cells of barley leaves affects expression of sucrose-fructan 6-fructosyltransferase gene. Ann Appl Biol. 2001;138:27–32. [Google Scholar]
- Koroleva OA, Tomos AD, Farrar JF, Roberts P, Pollock CJ. Tissue distribution of primary metabolism between epidermal, mesophyll and parenchymatous bundle cells in barley leaves. Aust J Plant Physiol. 2000;27:747–755. [Google Scholar]
- Krapp A, Hofman B, Schäfer C, Stitt M. Regulation of expression of rbcs and other photosynthetic genes by carbohydrates: a mechanism for the “sink regulation” of photosynthesis? Plant J. 1993;3:817–828. [Google Scholar]
- Kumazaki T, Hamada K, Mitsui Y. Detection of mRNA expression in a single cell by direct RT-PCR. BioTechniques. 1994;16:1017–1018. [PubMed] [Google Scholar]
- Li HM, Culligan K, Dixon RA, Chory J. Cue1: a mesophyll cell-specific positive regulator of light-controlled gene-expression in Arabidopsis. Plant Cell. 1995;7:1599–1610. doi: 10.1105/tpc.7.10.1599. [DOI] [PMC free article] [PubMed] [Google Scholar]
- Lu CG, Zainal Z, Tucker GA, Lycett GW. Developmental abnormalities and reduced fruit softening in tomato plants expressing an antisense Rabl1 GTPase gene. Plant Cell. 2001;13:1819–1833. doi: 10.1105/TPC.010069. [DOI] [PMC free article] [PubMed] [Google Scholar]
- Matsukura C, Saitoh T, Hirose T, Ohsugi R, Perata P, Yamaguchi J. Sugar uptake and transport in rice embryo: expression of companion cell-specific sucrose transporter (OsSUT1) induced by sugar and light. Plant Physiol. 2000;124:85–93. doi: 10.1104/pp.124.1.85. [DOI] [PMC free article] [PubMed] [Google Scholar]
- Müller J, Aeschbacher RA, Sprenger N, Boller T, Wiemken A. Disaccharide-mediated regulation of sucrose: fructan-6-fructosyltransferase, a key enzyme of fructan synthesis in barley leaves. Plant Physiol. 2000;123:265–273. doi: 10.1104/pp.123.1.265. [DOI] [PMC free article] [PubMed] [Google Scholar]
- Quail PH. Phytochrome: a light-activated molecular switch that regulates plant gene-expression. Annu Rev Genet. 1991;25:389–409. doi: 10.1146/annurev.ge.25.120191.002133. [DOI] [PubMed] [Google Scholar]
- Roth R, Hall LN, Brutnell TP, Langdale JA. Bundle sheath defective2, a mutation that disrupts the coordinated development of bundle sheath and mesophyll cells in the maize leaf. Plant Cell. 1996;8:915–927. doi: 10.1105/tpc.8.5.915. [DOI] [PMC free article] [PubMed] [Google Scholar]
- Sheen J. Metabolic repression of transcription in higher plants. Plant Cell. 1990;2:1027–1038. doi: 10.1105/tpc.2.10.1027. [DOI] [PMC free article] [PubMed] [Google Scholar]
- Smeekens S. Sugar-induced signal transduction in plants. Annu Rev Plant Physiol Plant Mol Biol. 2000;51:49–81. doi: 10.1146/annurev.arplant.51.1.49. [DOI] [PubMed] [Google Scholar]
- Sprenger N, Bortlik K, Brandt A, Boller T, Wiemken A. Purification, cloning, and functional expression of sucrose-fructan 6-fructosyltransferase, a key enzyme of fructan synthesis in barley. Proc Natl Acad Sci USA. 1995;92:11652–11656. doi: 10.1073/pnas.92.25.11652. [DOI] [PMC free article] [PubMed] [Google Scholar]
- Stitt M. The use of transgenic plants to study the regulation of plant carbohydrate-metabolism. Aust J Plant Physiol. 1995;22:635–646. [Google Scholar]
- Thain SC, Hall A, Millar AJ. Functional independence of circadian clocks that regulate plant gene expression. Curr Biol. 2000;10:951–956. doi: 10.1016/s0960-9822(00)00630-8. [DOI] [PubMed] [Google Scholar]
- Tomos AD, Hinde P, Richardson P, Pritchard J, Fricke W. Microsampling and measurements of solutes in single cells. In: Harris N, Oparka K, editors. Plant Cell Biology: A Practical Approach. Oxford: IRL Press; 1994. pp. 297–314. [Google Scholar]
- Tomos AD, Leigh RA. The pressure probe: a versatile tool in plant cell physiology. Annu Rev Plant Physiol Plant Mol Biol. 1999;50:447–472. doi: 10.1146/annurev.arplant.50.1.447. [DOI] [PubMed] [Google Scholar]
- Tomos AD, Leigh RA, Koroleva OA. Spatial and temporal variation in vacuolar contents. In: Robinson DG, Rogers JC, editors. Vacuolar Compartments. Annual Plant Reviews. Vol. 5. Sheffield, UK: Sheffield Academic Press; 2000. pp. 174–198. [Google Scholar]
- Williams ML, Farrar JF, Pollock CJ. Cell specialisation within the parenchymatous bundle sheath of barley. Plant Cell Environ. 1989;12:909–918. [Google Scholar]


