Abstract
The seeds of cereals represent an important sink for metabolites during the accumulation of storage products, and seeds are an essential component of human and animal nutrition. Understanding the metabolic interconversions (networks) underpinning storage product formation could provide the foundation for effective metabolic engineering of these primary nutritional sources. In this paper, we describe the use of retrobiosynthetic nuclear magnetic resonance analysis to establish the metabolic history of the glucose (Glc) units of starch in maize (Zea mays) kernels. Maize kernel cultures were grown with [U-13C6]Glc, [U-13C12]sucrose, or [1,2-13C2]acetate as supplements. After 19 d, starch was hydrolyzed, and the isotopomer composition of the resulting Glc was determined by quantitative nuclear magnetic resonance analysis. [1,2-13C2]Acetate was not incorporated into starch. [U-13C6]Glc or [U-13C12]sucrose gave similar labeling patterns of polysaccharide Glc units, which were dominated by [1,2,3-13C3]- and [4,5,6-13C3]-isotopomers, whereas the [U-13C6]-, [3,4,5,6-13C4]-, [1,2-13C2]-, [5,6-13C2], [3-13C1], and [4-13C1]-isotopomers were present at lower levels. These isotopomer compositions indicate that there is extensive recycling of Glc before its incorporation into starch, via the enzymes of glycolytic, glucogenic, and pentose phosphate pathways. The relatively high abundance of the [5,6-13C2]-isotopomer can be explained by the joint operation of glycolysis/glucogenesis and the pentose phosphate pathway.
Plant metabolism is a complex network of many interconnected reactions and metabolites (Fien et al., 2000). For the analysis of metabolic networks, it is important to study metabolic pathways not only on the level of isolated genes or enzymes but also to quantify metabolite flux, which is involved in the formation of sink metabolites, such as starch.
The biosynthesis of starch in the storage tissue of monocotyledonous plants has been studied in detail (for review, see Neuhaus and Emes, 2000). In maize (Zea mays), Suc from source leaves is imported into the developing cob tissue and converted into a mixture of Fru and UDP-Glc in the cytosol of endosperm cells (Chourey and Nelson, 1976; Chourey et al., 1998). UDP-Glc is converted into activated hexoses (i.e. Glc-1-P and Glc-6-P), which have been reported as starch precursors in various species. In maize, Glc-1-P is converted to the starch precursor ADP-Glc, which is transported into the plastid (Shannon et al., 1998). In contrast to the well-characterized import of activated hexoses into the amyloplasts as starch precursors, there is little evidence for the incorporation of trioses into starch (Neuhaus and Emes, 2000). It is therefore conceivable that starch is formed from intact C6 units derived from cleaved Suc. However, in different systems, redistribution between C-1 and C-6 of Glc moieties of starch was observed, indicating metabolic cycling between trioses and hexoses in the cytosol (Hatzfeld and Stitt, 1990; Viola et al., 1991; Dieuaide-Noubhani et al., 1995; Krook et al., 1998). This phenomenon is also observed in starch-accumulating organs of cereals. In wheat (Triticum aestivum), 15% to 20% redistribution of 13C-label between C-1 and C-6 of Glc recovered from starch was observed (Keeling et al., 1988). In maize, randomization of the carbon moieties of starch was detected using [1-14C]Glc that was injected into developing kernels (Hatzfeld and Stitt, 1990).
In this paper, we determine the metabolic history of monosaccharide units before their incorporation into starch by retrobiosynthetic NMR analysis (Eisenreich et al., 1993), a technique that is nonintrusive and nondestructive (Szyperski, 1995; Schmidt et al., 1998; Fiaux et al., 1999; Park et al., 1999; Eisenreich and Bacher, 2000; Glawischnig et al., 2001). The maize kernel was chosen as a model system to study starch biosynthesis because seeds of cereals are an important metabolic sink. Maize is genetically well characterized, and several starch biosynthetic mutants are available.
RESULTS
The in vitro culture of maize kernels (Glawischnig et al., 2000) provides a means to study the development of intact kernels up to physiological maturity under defined conditions. More specifically, maize kernels were harvested 4 d after pollination and placed in culture for 7 d. Kernels were then supplied with culture medium containing a mixture of [U-13C6]Glc and unlabeled Glc (1:40, w/w), a mixture of [U-13C12]Suc and unlabeled Suc (1:40, w/w), or a mixture of [1,2-13C2]acetate and unlabeled Suc (1:27, w/w). After incubation for 19 d, starch was isolated and hydrolyzed enzymatically. d-Glc was purified by affinity chromatography (yield, about 10 mg Glc g−1 wet kernel tissue).
The 13C-NMR signals of Glc isolated from starch in the experiment with [1,2-13C2]acetate displayed no 13C-coupled satellite signals (data not shown). It follows that exogenous acetate could not serve as precursor for starch in the experimental system, although it has been shown earlier to be incorporated into certain amino acids (e.g. Asp, Glu, and Leu) via acetyl-CoA and citric acid cycle intermediates (Glawischnig et al., 2001).
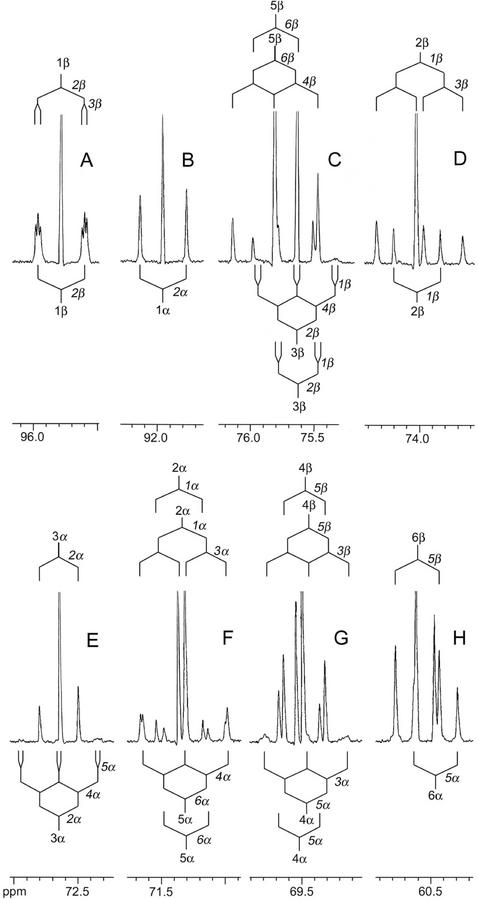
The 13C-NMR signals of d-Glc from starch in the experiment with [U-13C6]Glc are shown in Figure 1. The spectrum shows separate signal sets for the α- and β-anomers present at a ratio of 0.7:1. All signals show satellites because of 13C13C coupling. The truncated central line of each multiplet reflects a [13C1]Glc isotopomer that was predominantly derived from unlabeled Glc or was already present in the plant material before the feeding period. As a consequence of heavy isotope shift effects and of non-first-order coupling, the satellite patterns of the multiplets are not strictly symmetrical with respect to the line attributed to the respective [13C1]-isotopomer. The complexity of the multiplets is in part attributable to the superposition of the signal sets pertaining to different isotopomers that were formed from the proffered, multiply 13C-labeled precursor by metabolic cycling.
Figure 1.
13C-NMR signals of Glc isolated from starch labeled with [U-13C6]Glc. Coupling patterns are indicated.
Because every isotopomer is reflected in the signals of the α- and β-anomers, which are characterized by different chemical shifts and coupling patterns (Table I), the labeling data are overdetermined, and the accuracy of the quantitative breakdown of the isotopomer composition can be assessed by comparison of the α- and β-Glc data. Additional overdetermination of labeling patterns results from the fact that quantitative information on blocks of contiguous 13C atom groups can be gleaned from the NMR signature of each carbon atom in that group. Thus, the relative amount of each isotopomer in the isotopomer mixture can be extracted typically from at least four different NMR signal groups, and the accuracy of the data can be assessed by statistical analysis.
Table I.
NMR data of the α - and β -anomers of d-Glc
| Position | Chemical Shift | Coupling Constants |
|---|---|---|
| ppm | Hz | |
| 1a | 91.96 | 45.6 (2a) |
| 2a | 71.37 | 46.0 (1a) |
| 3a | 72.64 | 38.3 (2a) |
| 4a | 69.54 | 40.0 (5a) |
| 5a | 71.31 | 43.3 (6a) |
| 6a | 60.47 | 42.9 (5a) |
| 1b | 95.79 | 45.8 (2b), 4.2 (3b) |
| 2b | 74.03 | 46.0 (1b), 38.7 (3b) |
| 3b | 75.64 | 38.9 (2b) |
| 4b | 69.49 | 41.1 (5b) |
| 5b | 75.82 | 41.6 (6b), 39.8 (4b) |
| 6b | 60.62 | 42.9 (5b) |
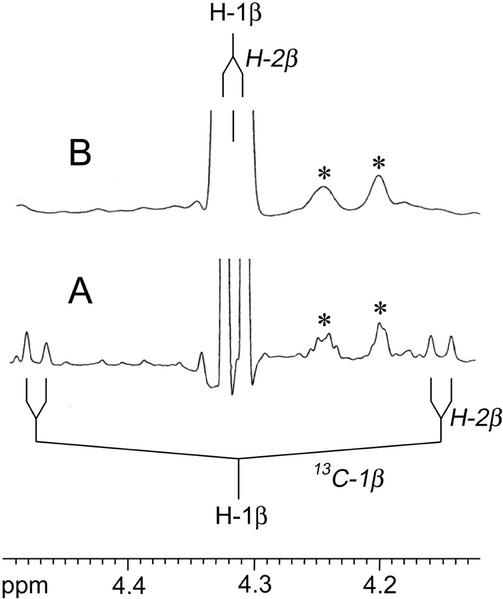
The relative overall signal integrals for each respective carbon atom in α-and β-Glc from starch in the experiment with [U-13C6]Glc are summarized in Table II. Relative 13C enrichments were determined by comparison with the signal integrals of a Glc sample at natural 13C abundance (i.e. 1.1% 13C abundance). The absolute 13C abundance of C-1α and C-1β calculated via the intensities of 13C-coupled satellites in the 1H-NMR signals (Fig. 2) is 2.5%. By multiplication of this value with the relative 13C abundances, absolute 13C abundances were obtained for each carbon atom in α- and β-Glc (Table II), and the averaged 13C abundance for all carbon atoms was 2.51% ± 0.06% in the experiment with [U-13C6]Glc corresponding to a 13C excess of 1.4% ± 0.06%. From the molar fraction of 13C-labeled Glc in the medium (approximately 2.3%), a specific incorporation rate of 61% ± 3% can be calculated. It can be concluded that approximately 60% of starch Glc were derived from the proffered precursor mixture during the feeding experiment. In other words, 40% of the analyzed starch had been present at the beginning of the [13C]Glc feeding.
Table II.
13C-NMR analysis of Glc obtained from starch in the experiment with [U-13C6]Glc
| C-atom | Signal Integralsa
|
13C
|
13C13Cb | Isotopomerc | |||
|---|---|---|---|---|---|---|---|
| Unlabeled sample Iref | Labeled sample I* | Ratio I*/Iref | rel. | abs. | |||
| % | mol % | ||||||
| 1a | 0.604 | 0.589 | 0.975 | 1.00d | 2.50 | 53.5 (a + d + e) | 1.337 (a + d + e) |
| 2a | 0.577 | 0.591 | 1.024 | 1.05 | 2.62 | 15.5 (e), nd (a + d) | 0.406 (e) |
| 3a | 0.607 | 0.583 | 0.960 | 0.98 | 2.45 | 34.1 (d + f), 6.4 (a) | 0.839 (d + f), 0.157 (a) |
| 4a | 0.600 | 0.601 | 1.002 | 1.03 | 2.57 | 11.1 (a + f), 36.7 (b) | 0.285 (a + f), 0.943 (b) |
| 5a | 0.633 | 0.609 | 0.962 | 0.99 | 2.47 | 11.0 (c), nd (b + a + f) | 0.272 (c) |
| 6a | 0.643 | 0.613 | 0.953 | 0.98 | 2.45 | 52.7 (c + b + a + f) | 1.286 (c + b + a + f) |
| 1b | 1.000 | 1.000 | 1.000 | 1.00d | 2.50 | 53.5 (a + d + e) | 1.337 (a + d + e) |
| 2b | 1.014 | 1.015 | 1.000 | 1.00 | 2.50 | 15.2 (e), 39.9 (a + d) | 0.380 (e), 0.997 (a + d) |
| 3b | 1.022 | 1.016 | 0.994 | 0.99 | 2.48 | 34.4 (d + f), 8.7 (a) | 0.853 (d + f), 0.216 (a) |
| 4b | 0.985 | 1.045 | 1.061 | 1.06 | 2.65 | 10.6 (a + f), 37.1 (b) | 0.281 (a + f), 0.983 (b) |
| 5b | 0.989 | 0.972 | 0.990 | 0.99 | 2.48 | 10.8 (c), nd (b + a + f) | 0.267 (c) |
| 6b | 1.030 | 1.039 | 1.009 | 1.01 | 2.52 | 55.4 (c + b+ f + a) | 1.396 (c + b+ f + a) |
Relative 13C-NMR signal integrals referenced to a value of 1.000 for the signals of carbon 1b.
Relative fractions of satellite signals for given isotopomers (indicated in the parenthesis) in the global 13C signal intensities of the index atom. Isotopomers as designated in Figure 5 are indicated in the parentheses.
Obtained by multiplication of %13C13C with absolute 13C abundances for a given carbon atom.
Ratio of integrals (I*/Iref) arbitrarly set to a relative 13C abundance of 1.0.
Figure 2.
1H-NMR signal of H-1β of Glc isolated from starch labeled with [U-13C6]Glc. A, Without 13C-decoupling; B, with 13C-decoupling. *, Signals arising from impurities.
The signal integrals of specific 13C satellites, in comparison with the overall signal intensity, reflect the relative amounts of a given isotopomer. By multiplication of these values with the overall 13C abundance at a given molecular position, the molar contributions of each respective isotopomer can be calculated (Tables II and III).
Table III.
Mol % of isotopomers in Glc obtained by hydrolysis of starch from experiments with [U-13C6]Glc and [U-13C12]Suc
| Isotopomer | Precursor
|
|||
|---|---|---|---|---|
| [U-13C6]Glc | [U-13C12]Suc | |||
| mol % | n | mol % | n | |
| a [U-13C6] | 0.187 ± 0.04 | 2 | 0.365 ± 0.090 | 2 |
| b [4,5,6-13C3] | 0.922 ± 0.01 | 2 | 0.675 ± 0.172 | 2 |
| c [5,6-13C2] | 0.272 ± 0.01 | 2 | 0.190 ± 0.140 | 2 |
| d [1,2,3-13C3] | 0.775 ± 0.04 | 3 | 0.622 ± 0.150 | 3 |
| e [1,2-13C2] | 0.382 ± 0.01 | 2 | 0.205 ± 0.095 | 2 |
| f [3,4,5,6-13C4] | 0.082 ± 0.05 | 2 | nda | |
| g [4-13C1] | 0.21 | nd | ||
| h [3-13C1] | 0.36 | nd | ||
nd, Not determined because of signal overlapping.
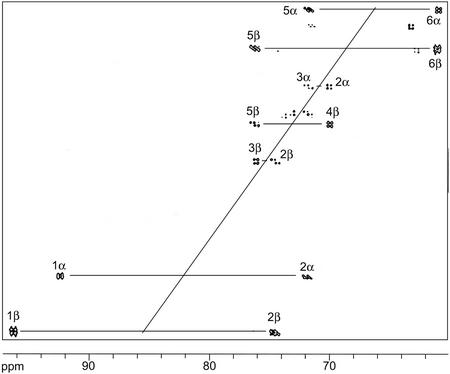
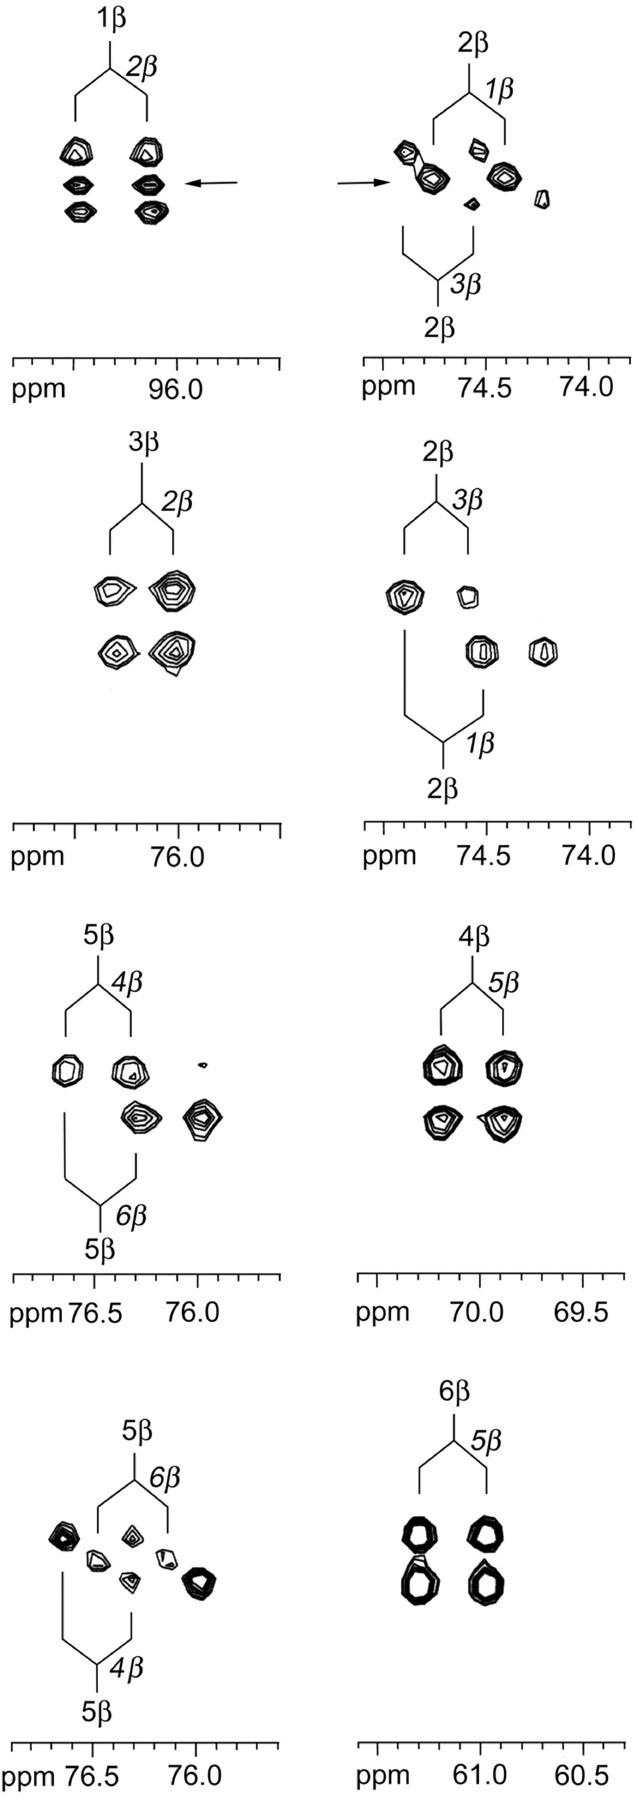
The multiply 13C labeled isotopomers were assigned by high-resolution two-dimensional incredible natural abundance double-quantum transfer (INADEQUATE) experiments (Figs. 3 and 4). In the double-quantum experiment, pairs of adjacent 13C atoms can be observed as specific double quantum coherences in the F1 dimension (i.e. the ordinate in Fig. 3). Pairs of correlated signals were detected for C-1/C-2, C-2/C-3, C-4/C-5, and C-5/C-6. From the absence of a C-3/C-4 signal pair, it can be concluded that isotopomers with contiguous 13C labeling in C-3 and C-4 (i.e. a characteristic feature of the proffered [U-13C6]Glc) were only present in relatively small amounts. The detailed analysis of the correlation peaks enabled the identification of [1,2,3-13C3]-, [1,2-13C2]-, [4,5,6-13C3]-, and [5,6-13C2]Glc with significant concentrations. The fine structure of the double quantum signals shows an abundance of additional information beyond that on the contiguous 13C pairs (Fig. 4). Thus, the correlation peaks at the double-quantum coherence of C-1 and C-2 show the expected doublet pattern for a [1,2-13C2]-isotopomer (indicated by arrows in Fig. 4). In addition, pairs of β-COSY type signals were observed with passive couplings (Mareci and Freeman, 1983) signaling the [1,2,3-13C3]-isotopomer. The correlation signals between C-5 and C-6 were similarly diagnostic of [4,5,6-13C3]- and [5,6-13C2]-isotopomers. The signals for C-3/C-2 and C-4/C-5 correlation pairs exclusively showed β-COSY-type signals with passive couplings reflecting the [1,2,3-13C3]- and [4,5,6-13C3]-isotopomers. Thus, [2,3-13C2]- and [4,5-13C2]-isotopomers were not present in significant amounts.
Figure 3.
Two-dimensional INADEQUATE spectrum of Glc isolated from starch labeled with [U-13C6]Glc.
Figure 4.
Expanded view of signals in the two-dimensional INADEQUATE spectrum of Glc isolated from starch labeled with [U-13C6]Glc. Signals arising from [1,2-13C2]Glc are indicated by arrows.
These assignments were confirmed by the detailed analysis of the coupling pattern in the one-dimensional 13C-NMR spectrum (Fig. 1). The deconvolution of this complex NMR spectrum can be illustrated by analysis of specific signals. In Figure 1B, the central peak represents carbon 1 of α-[1-13C1]Glc (subsequently designated C-1α). The symmetrical doublet reflects 13C coupling of C-1α to the adjacent C-2α. The signal integrals of the satellite lines indicate the relative abundance of Glc molecules comprising 13C atoms in positions 1 and 2 (and possibly in additional positions). The same information can be extracted from the signal in Figure 1A, which represents C-1 of the β anomer of Glc. Again, the integral of the satellites represents the relative abundance of Glc molecules comprising at least two 13C atoms in positions 1 and 2, and that information is redundant with that from the analysis of the α-anomer. Interestingly, the C-1 signal of the β-anomer (but not that of the α-anomer) allows the differentiation of an isotopomer with precisely two 13C atoms in positions 1 and 2 (i.e. [1,2-13C2]Glc) from isotopomers with more than two 13C atoms. This is because of the coupling constant of 4.2 Hz via two bonds for C-1 of the β-anomer; the long range coupling constant relating C-1 and C-3 of the α-anomer, on the other hand, is too small to be resolved.
The signal pattern of C-2β (Fig. 1D) comprises components arising by 13C coupling with C-1β and by simultaneous coupling with C-3β and C-1β. The signal for C-3α (Fig. 1E) shows intense coupling satellites attributable to coupling with C-2α and simultaneous coupling with C-2α, C-4α, and C-5α at lower intensity.
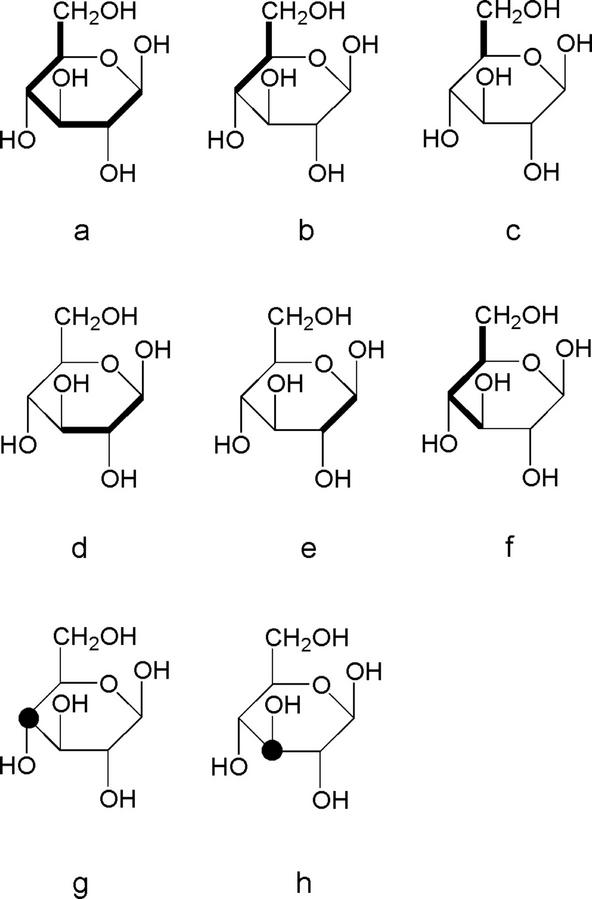
In conjunction with the results from the INADEQUATE experiment, the systematic analysis of all coupling patterns shows that six multiply 13C-labeled isotopomers are present in amounts that can be detected by the methods used (Fig. 5, isotopomers a–f). The concentration of other multiply 13C-labeled isotopomers in the sample is below 0.05 mol %.
Figure 5.
Isotopomer composition of Glc isolated from starch labeled with [U-13C6]Glc or [U-13C12]Suc. Multiply 13C-labeling (isotopomers a-f) is indicated by bold lines connecting 13C atoms. Singly 13C-labeling (isotopomers g and h) is indicated by dots. The relative fraction of each isotopomer is given in Table III.
Information on the abundance of a given isotopomer can be extracted independently from different signal groups (Table II). For example, [4,5,6-13C3]Glc (isotopomer b) is represented in the NMR signals of C-4, C-5, and C-6 of α- and β-Glc. To improve the accuracy of the quantitative assessment of different isotopomers, the relative abundance of Glc isotopomers can be averaged over the signal intensities of α- and β-Glc atoms (Tables II and III).
In summary, the isotopomer composition of Glc was characterized by high abundances of [1,2,3-13C3]- and [4,5,6-13C3]-isotopomers, whereas [U-13C6]-, [5,6-13C2]-, [1,2-13C2]-, and [3,4,5,6-13C4]Glc were present at lower molar ratios (Table III). The sds in Table III document the data quality.
By comparison of the sum of multiply 13C-labeled isotopomers with the overall 13C abundance of each specific carbon atom, it is obvious that [3-13C1]- and [4-13C1]Glc are present in amounts well above the natural abundance contributions (Table III; Fig. 5, isotopomers g and h).
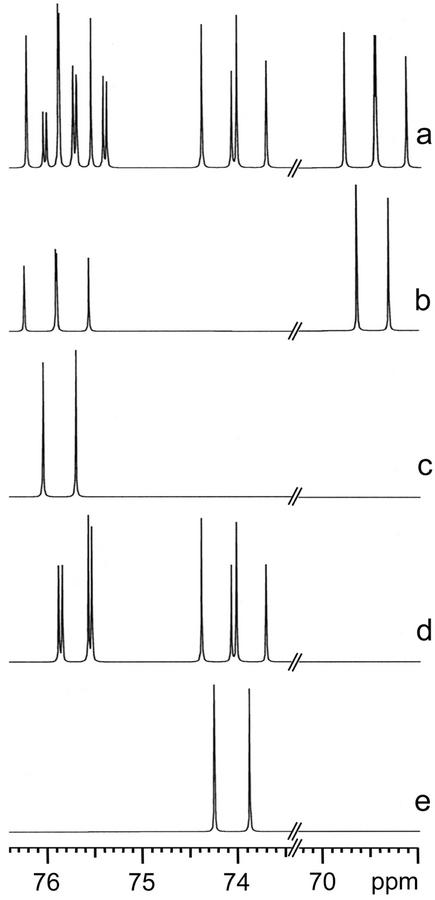
The isotopomer breakdown determined as described above can be checked rigorously by spectral simulation. For each of the isotopomers a to f in Figure 5, the complete NMR spectrum can be calculated on basis of the chemical shifts and coupling constants summarized in Table I. We used the software package NMRSIM to calculate the complete 13C-NMR spectra of isotopomers a through f in the α- and β-form (Fig. 6).
Figure 6.
Simulated 13C-NMR spectra of Glc isotopomers a though e (compare with Fig. 5).
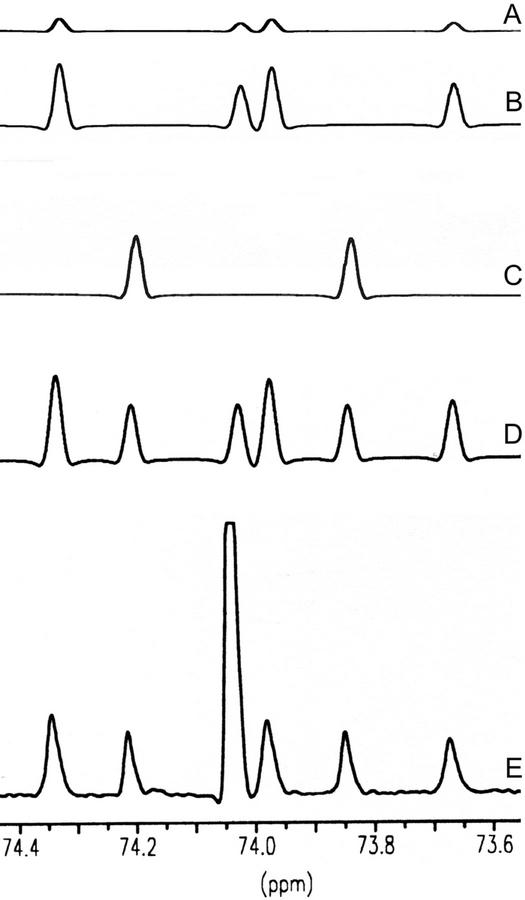
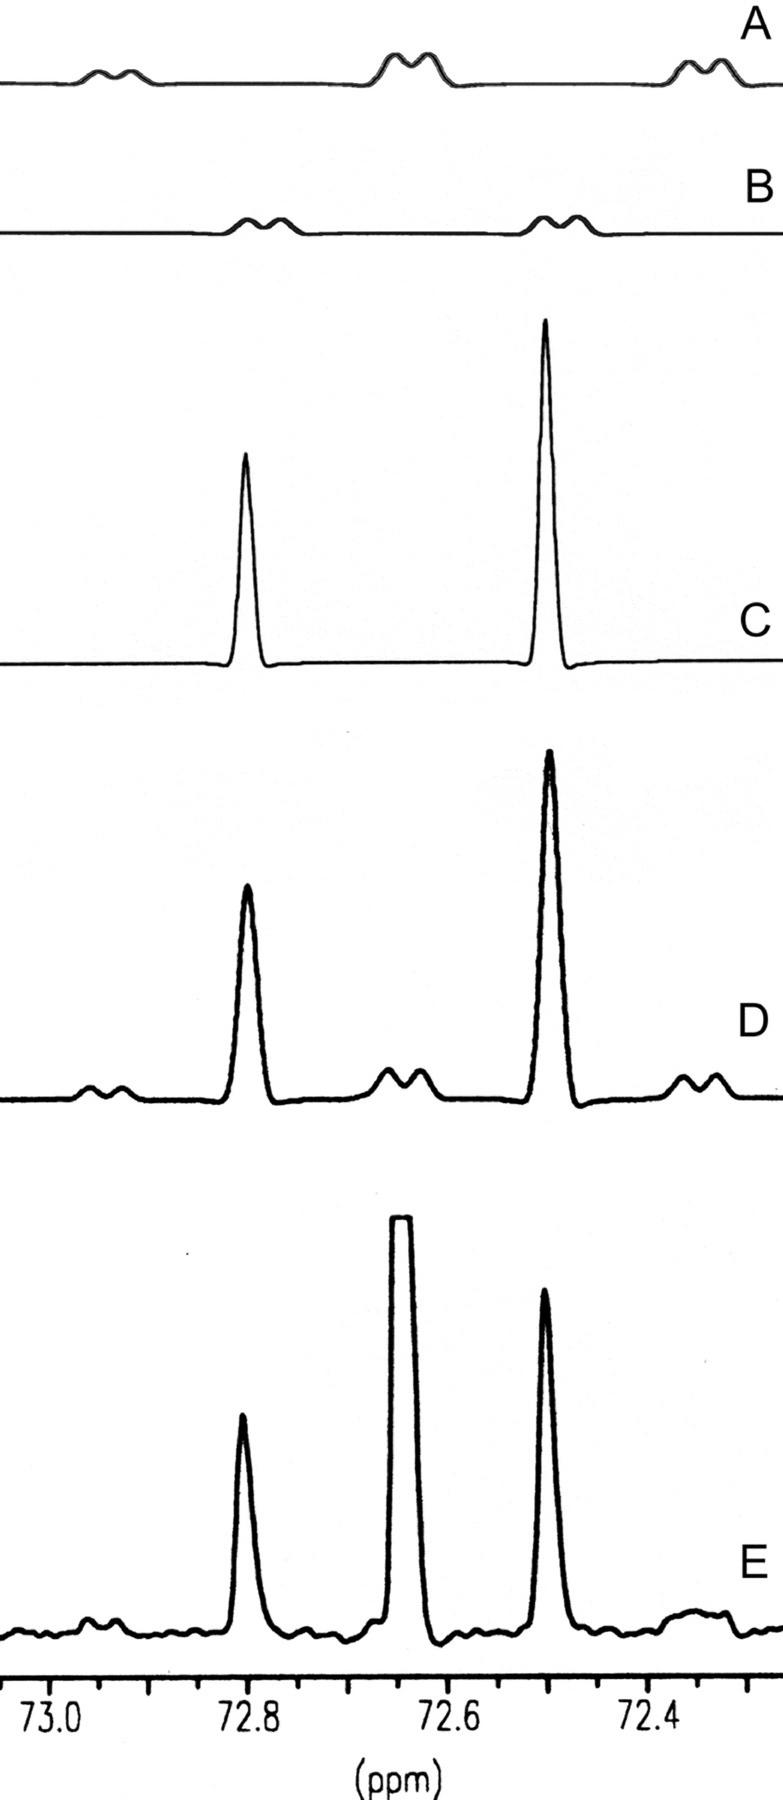
Because the Glc from starch is a mixture of the different isotopomers that occur at the same ratio in the α- and β-form, the experimentally observed spectrum contains contributions by each spectral line of the isotopomers shown in Figure 5. Because the amounts of the isotopomers in the actual Glc sample are different (Table III), it is necessary to scale the spectrum of each isotopomer before the summation of spectra to reflect the quantitative composition of the isotopomer mixture (Figs. 7 and 8). For obvious reasons, the same factors must apply for a given isotopomer in the α- and β-Glc anomer. As shown for specific examples in Figures 7 and 8 (signals for C-2β and C-3α), the summation using the scaling factors in Table III, the simulations agree closely with the experimental signals.
Figure 7.
13C-NMR signals of C-2β of Glc isolated from starch. A through C, simulated signals of isotopomers a, d, and e, respectively; D, sum of the simulated signals scaled according to the molar fractions of isotopomers in the experiment with [U-13C6]Glc (compare with Table III); E, signal of the biosynthetic sample from the experiment with experiment with [U-13C6]Glc.
Figure 8.
13C-NMR signals of C-3α of Glc isolated from starch. A through C, Simulated signals of isotopomers a, f, and d; D, sum of the simulated signals scaled according to the molar fractions of isotopomers in the experiment with [U-13C6]Glc (compare with Table III); E, signal of the biosynthetic sample from the experiment with experiment with [U-13C6]Glc.
The spectrum of Glc isolated from maize kernels grown with [U-13C12]Suc was analyzed by the same approach. As shown in Table III, the molar contributions of multiple 13C-labeled Glc isotopomers are similar but not identical to the isotopomer composition in the experiment with [U-13C6]Glc. Because the price of [U-13C12]Suc is substantially higher as compared with [U-13C6]Glc, only a relatively small amount of the tracer could be used in this experiment, and consequently the quality of the NMR data is lower as compared with the data in the Glc experiment. Most significantly, the relative amount of the [U-13C6]-isotopomer was higher as compared with the experiment with [U-13C6]Glc.
DISCUSSION
Terrestrial carbon is a mixture of 98.9% (w/v) 12C, 1.1% 13C, and traces of 14C. As a consequence, all organic compounds are complex isotopomer mixtures. For any 6-carbon compound, e.g. Glc, the number of nonradioactive carbon isotopomers is 26 = 64.
The isotopomer composition of Glc with natural 13C abundance is close to the state of chemical equilibrium; minor deviations caused by isotope selectivity of enzymatic reactions are below the level of sensitivity of the methods used in this study and can thus be disregarded. The approximate abundances of different isotopomers in naturally occurring Glc are summarized in Table IV. The multiply 13C-labeled do not occur in significant amounts at natural 13C abundance. The sum of the concentrations of all naturally occurring isotopomers with two or more 13C atoms in Glc with natural isotope abundance is notably less than 0.07 mol %.
Table IV.
Approximate natural abundance of selected Glc isotopomers
| Isotopomer | Abundance |
|---|---|
| mol % | |
| [1-13C1] | 1.1 |
| [2-13C1] | 1.1 |
| [3-13C1] | 1.1 |
| [1,2-13C2] | 0.012 |
| [5,6-13C2] | 0.012 |
| [1,2,3-13C3] | 0.00013 |
| [4,5,6-13C3] | 0.00013 |
| [3,4,5,6-13C4] | 0.0000015 |
| [U-13C6] | 0.00000000018 |
The quasi-equilibrium isotopomer distribution of biomatter can be perturbed by the introduction of any singly or multiply 13C-labeled metabolite. Cellular metabolism is then conducive to a complex relaxation process in which virtually all chemical reactions occurring in the experimental system are involved. Whereas catabolic processes direct the system to a new equilibrium state (characterized by an increased 13C abundance in case of closed systems), anabolic processes are conducive to metastable states that can be gleaned from the assimilated biomass (i.e. proteins, polymeric carbohydrates, and lipids). It is obvious that enzyme reactions involving the breaking or formation of carbon-carbon bonds play a central role in these relaxation processes.
A detailed analysis of the isotopomer populations formed by the enzyme-catalyzed relaxation processes in the wake of a perturbation (by introduction of a multiply labeled metabolite) is possible by NMR analysis and affords an abundance of information that cannot be obtained by traditional experimental setups that monitor global isotope enrichment or enrichment at selected positions but fail to document the quantitative composition of the entire isotopomer population.
Because they can yield very large amounts of experimental data, perturbation/relaxation experiments with multiply stable isotope-labeled metabolite can be used to monitor metabolite flux in complex metabolic networks characteristic of eukaryotic cells and organisms. The perturbation/relaxation experiments can also be used to dissect metabolite flux across compartmental boundaries.
From the 57 multiply labeled 13C-isotopomers of Glc, six occur with an abundance above 0.08 mol % in the Glc samples obtained by hydrolysis of the starch formed in developing maize kernels in the experiment with [U-13C6]Glc (Table III), i.e. well above their stochastic occurrence in natural abundance Glc (Table IV). The abundance of [U-13C6]Glc in the sample is notably 9 orders of magnitude above the level of that isotopomer in natural abundance Glc (compare with Tables III and IV). Two isotopomers carrying single 13C atoms ([3-13C1]- and [4-13C1]Glc) also occur with increased abundances of 0.21% and 0.36%, respectively (i.e. 18 resp. 32% excess over natural abundance) because of the metabolic processes (compare with Table III).
The global 13C enrichments show that Glc and Suc were used to a similar extent for the synthesis of starch. In closer detail, the total amount of multiply 13C-labeled Glc isotopomers was 2.06 mol % in the experiment with the Suc mixture and 2.62 mol % in the experiment with the Glc mixture. The pattern of isotopomer distributions is similar (although not identical) in the experiments with 13C-labeled Glc resp. Suc. Thus, Glc is processed in a similar way as Suc, which is the natural carbon source available to the heterotrophic endosperm cells in the developing maize kernel.
The 13C spectra of Glc obtained from starch after feeding of 13C-labeled Glc or Suc consist of complex multiplets. The most rigorous approach for the deconvolution of these complex patterns uses the numerical simulation of the spectrum of each observed isotopomer on basis of chemical shifts and coupling constants (Table I). The spectrum of the isotopomer mixture from the maize experiments can then be approximated by the summation of the simulated isotopomer spectra under consideration of their relative abundance. The agreement between the experimental and the simulated spectrum is excellent as shown in Figures 7 and 8.
The relative paucity of the [U-13C6]-isotopomer (0.19 and 0.36 mol % in the experiments with 13C-labeled Glc and Suc, respectively) shows that the carbon skeleton of the vast majority of the proffered carbohydrate precursors had been broken and reassembled at least once. Passage of Glc through the pentose phosphate pathway under regeneration of a hexose is conducive to breaking of the C2/C3 bond and/or the C3/C4 bond of hexoses. Glycolysis followed by glucogenesis is conducive to breaking of the C3/C4 bond of Glc. Evidence for both processes is immediately obvious from the relatively high abundance of [1,2-13C2]-, [1,2,3-13C3]-, [4,5,6-13C3]-, [3,4,5,6-13C4]-, and [3-13C1]-isotopomers.
The [5,6-13C2]- and [4-13C1]-isotopomer can be explained by a cooperative action of the pentose phosphate pathway and the glycolysis/glucogenesis pathways. Thus, the pentose phosphate pathway can generate [1,2-13C2]pentoses and, subsequently, [1,2-13C6]hexoses (via transketolase catalysis). Glycolysis can produce [2,3-13C2]dihydroxyacetone phosphate from the double-labeled hexose, which yields [2,3-13C2]glyceraldehyde 3-phosphate by the catalytic action of triose phosphate isomerase. Regeneration of a hexose from [2,3-13C2]glyceraldehyde phosphate, either by glucogenesis or via the pentose phosphate pathway, could afford the [5,6-13C2]Glc isotopomer observed in our experiments (0.27 and 0.19 mol % in the experiments with 13C-labeled Glc and Suc, respectively). The abundance of the [5,6-13C2]-isotopomer is only slightly lower (about 30%) as compared with the [1,2-13C2]-isotopomer from which it is proposed to be formed by the sequence of events described above. This suggests that the interconnection of the pentose phosphate pathway and the glycolysis/glycogenesis pathways is operating quite efficaciously.
This result is in accordance with earlier experiments with non-photosynthetic cells showing that intermediates of glycolysis and the pentose phosphate pathway are combined in starch synthesis. Cycling between trioses and hexoses has more specifically been inferred from transfer of label from C-1 to C-6 in Glc moieties of starch. Fifteen percent to 20% redistribution of label was found in developing wheat seeds (Keeling et al., 1988). Moreover, 15% of the label were reshuffled from the 1-position to the 6-position of hexose in maize endosperm (Hatzfeld and Stitt, 1990), as shown by experiments with 14C-labeled Glc, which was injected into developing maize cobs. Hatzfeld and Stitt (1990) also detected cycling of triose phosphates in heterotrophic plant cells including maize endosperm. The quantification of metabolic fluxes in maize root tips indicated the close cooperation of glycolysis and the pentose phosphate pathway in carbohydrate metabolism and the involvement of the transaldolase reaction (Dieuaide-Noubhani et al., 1995). The analysis of Suc and starch metabolism in carrot (Daucus carota) cells similarly provided evidence for the implication of the pentose phosphate pathway (Krook et al., 1998).
Our data indicate that 87% of the Glc moieties of this precursor are not directly derived from external Glc; rather, the hexose moiety is recycled via a “metabolic detour.” On this basis, the extent of metabolic cycling is significantly higher than the extent of cycling detected in earlier studies (see above). This discrepancy may be attributable to the different experimental setups and/or to the difference in incubation time (19 d in our experiments versus 2 h in the 14C study by Hatzfeld and Stitt [1990]).
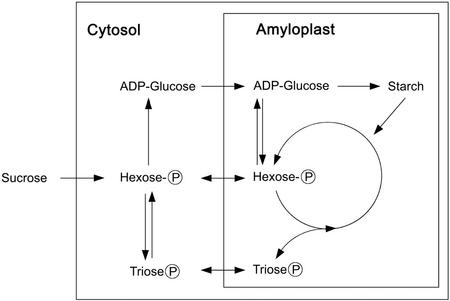
Plant metabolism is a complex issue, even when only carbohydrate metabolism in a maize endosperm cell is under investigation (Neuhaus and Emes, 2000). Metabolic reactions involving hexoses take place in the cytosol and in the amyloplast of these cells. In fact, with the exception of the nonoxidative branch of the pentose phosphate pathway, which is localized in the maize plastid (Debnam and Emes, 1999), both compartments are characterized by an almost redundant set of enzymes catalyzing both anabolic and catabolic reactions. The metabolite pools of the cytosol and the amyloplast are efficiently connected by transporters for triose phosphate, hexose phosphate, pentose phosphates, and ADP-Glc (Trethewey and ap Rees, 1994; Möhlmann et al., 1997; Schultz, 1997; Kammerer et al., 1998; Shannon et al., 1998, Flügge, 1999; Eicks et al., 2002), which enable metabolite flux and maintain the phosphorus balance in the different compartments of the cell (Tetlow et al., 1998). In this context, the extensive cycling processes inferred from the Glc-labeling pattern may reflect a flexible metabolic network that serves the physiological needs of the cell (Fig. 9).
Figure 9.
Metabolic flux involved in starch biosynthesis in growing kernels of maize. The pentose phosphate pathway is shown as a circle in the amyloplast compartment.
The nondestructive retrobiosynthetic NMR analysis exploited in this study has the power to resolve carbon flux into starch (and into other pools and sinks) within a complex metabolic context. The results obtained here corroborate earlier findings that have been obtained with single-isotope-labeled precursors in different plant systems. Using mixtures of [U-13C]-labeled carbohydrate and unlabeled carbohydrate as precursors, many multiple 13C-labeled Glc isotopomers in starch can be analyzed providing detailed information about carbon-carbon connectivities that had been retained from a given totally 13C-labeled precursor during the metabolic conversion into a sink metabolite. The technique can now be used to investigate and compare flux under different physiological conditions. The analysis of mutants in transporters or glycolytic and starch biosynthetic genes could increase our understanding of metabolite flux in the sink organs of plants and more generally in whole plant metabolism.
MATERIALS AND METHODS
Materials
[U-13C6]Glc and [1,2-13C2]acetate (sodium salt) were purchased from Isotec (Miamisburg, OH). [U-13C12]Suc was purchased from Campro Scientific (Veenendaal, The Netherlands). Glc-6-P dehydrogenase from Leuconostoc mesenteroides (550–1,100 units mg−1) and hexokinase from Brewer's yeast (Saccharomyces cerevisiae; 130–250 units mg−1) were from Sigma-Aldrich (Deisenhofen, Germany).
Culture of Developing Maize (Zea mays) Kernels
Developing kernels from field grown maize (Pioneer hybrid 3394) were placed into culture, under sterile conditions, on d 4 after pollination. Kernels were grown for 7 d in unlabeled medium (Glawischnig et al., 2000), and then moved to medium containing 10.7 mm d-[U-13C6]Glc (99.9% 13C enrichment) and 445 mm unlabeled d-Glc (experiment A), to medium containing 36 mm [1,2-13C2]acetate (99.9% 13C enrichment) and 234 mm unlabeled Suc (experiment B), or to medium containing 5.6 mm d-[U-13C12]Suc (99.9% 13C enrichment) and 234 mm unlabeled d-Suc (experiment C). After 19 d of growth in the labeled medium, kernels were separated from the cob.
Isolation of Glc from Starch
Frozen kernels were ground in liquid nitrogen using an electric coffee grinder. Frozen maize kernel powder was mixed with 3 volumes of 70% (v/v) aqueous acetone. The suspension was shaken vigorously for 15 min at room temperature. The mixture was centrifuged, and acetone extraction of the pellet was repeated twice. The residue was then extracted twice with 3 volumes of a mixture of n-hexane:acetone (1:1, v/v). The mixture was centrifuged, and the pellet (0.5 g) was treated with 1.5 mL of 0.5 m NaOH for 1 h at 65°C. The mixture was diluted with 12 mL of water, adjusted to pH 4.5 with 1 m acetic acid, and centrifuged (45 min, 4,800 rpm). Amyloglucosidase (120 units, lyophilized powder from Sigma-Aldrich) was added to the supernatant. The mixture was incubated for 3 h at 55°C and was then centrifuged (45 min, 4,800 rpm). The supernatant was concentrated under reduced pressure. The residue was dissolved in 2 mL of 0.2 m ammonium acetate. The solution was adjusted to pH 9.0 with 1 m NaOH. Glc was isolated by affinity chromatography using a 2-mL Affigel 601 (Bio-Rad, Hercules, CA) column, which had been equilibrated with 0.2 m ammonium acetate, pH 8.8. The column was washed with 20 mL of 0.2 m ammonium acetate, pH 8.8, and was then developed with 0.2 m ammonium acetate, pH 6.0. Fractions of 1 mL were collected. Aliquots of 25 μL were retrieved and added to a solution containing 50 mm MOPS/KOH, pH 7.5, 4 units mL−1 hexokinase, 1 mm ATP, 5 mm MgCl2, 1 mm EDTA, and 0.4 mm NAD. The solution was incubated at 28°C for 5 min. Two units per milliliter Glc-6-P dehydrogenase were added, and the reaction mixture was incubated at 28°C for further 5 min. The formation of NADH was monitored at 340 nm. Fractions containing Glc were combined and lyophilized.
NMR Spectroscopy
Glc was dissolved in 2H2O. 1H- and 13C-NMR spectra were recorded at 500.13 and 125.76 MHz, respectively, using a spectrometer (DRX500, Bruker, Newark, DE). The data were processed with standard Bruker software (XWINNMR 3.0). Two-dimensional INADEQUATE experiments (Bax et al., 1981) were performed with the Bruker pulse program inad using a 135° read pulse (11.5 μs). Further parameters were as follows: time domain (td) 2, 2k; number of scans (ns), 64; acquisition (aq), 0.163 s; delay (d)1, 2 s, d4, 6 ms; td1, 800; sweep width (sw)2, 50 ppm; sw1, 25 ppm; aq-mode, qsim; magnitude calculation (mc)2, qf; window (wdw)2, Gauss multiplication (gm); line broadening (lb)2, −0.6; gm2, 0.02; wdw1, qsine; shifted sine bell (ssb)1, 2. 13C-NMR spectra were simulated with NMRSIM (Bruker) using the chemical shifts and coupling constants summarized in Table I.
The analysis of 13C enrichment and isotopomer composition was performed as described (Eisenreich and Bacher, 2000). In brief, 13C-NMR spectra of isotope-labeled samples and of Glc with natural 13C abundance were recorded under the same experimental conditions. Integrals were determined for every 13C-NMR signal, and the signal integral for each respective carbon atom in the labeled compound was referenced to that of the natural abundance material, thus affording relative 13C abundances for each position in the labeled molecular species (% 13Crel. in Table II). Absolute 13C abundances for C-1 were obtained from 13C-coupling satellites in 1H-NMR signals for H-1β and H-1α where the coupling satellites were well separated (compare with Fig. 2). These values were used to convert relative to absolute 13C abundances for other positions (% 13Cabs. in Table II).
In NMR spectra of multiple-labeled samples displaying 13C13C couplings, each satellite in the 13C-NMR spectra was integrated separately. The relative fractions of each respective satellite pair (corresponding to a certain coupling pattern, compare with Fig. 1; Table II) in the total signal integral of a given carbon atom were calculated (% 13C13C in Table II). Relative isotopomer abundances were then referenced to the global absolute 13C abundance for each carbon atom (mol % in Table II).
ACKNOWLEDGMENTS
We thank Cathie Martin, Tom Hamborg Nielsen, and Gernot Schultz for helpful discussions. We thank Angelika Werner and Fritz Wendling for expert help with the preparation of the manuscript.
Footnotes
This work was supported by the Deutsche Forschungsgemeinschaft, by the Fonds der Chemischen Industrie, and by the Hans-Fischer-Gesellschaft.
Article, publication date, and citation information can be found at www.plantphysiol.org/cgi/doi/10.1104/pp.006726.
LITERATURE CITED
- Bax A, Freeman R, Frenkiel TA. An NMR technique for tracing out the carbon skeleton of an organic molecule. J Am Chem Soc. 1981;103:2102–2104. [Google Scholar]
- Chourey PS, Nelson OE. The enzymatic deficiency conditioned by the shrunken-1 mutations in maize. Biochem Genet. 1976;14:1041–1055. doi: 10.1007/BF00485135. [DOI] [PubMed] [Google Scholar]
- Chourey PS, Taliercio EW, Carlson SJ, Ruan YL. Genetic evidence that the two isozymes of sucrose synthase present in developing maize endosperm are critical, one for cell wall integrity and the other for starch biosynthesis. Mol Gen Genet. 1998;259:88–96. doi: 10.1007/s004380050792. [DOI] [PubMed] [Google Scholar]
- Debnam PM, Emes MJ. Subcellular distribution of enzymes of the oxidative pentose phosphate pathway in root and leaf tissue. J Exp Bot. 1999;50:1653–1661. [Google Scholar]
- Dieuaide-Noubhani M, Raffard G, Canioni P, Pradet A, Raymond P. Quantification of compartmented metabolic fluxes in maize root tips using isotope distribution from 13C- or 14C-labeled glucose. J Biol Chem. 1995;270:13147–13159. doi: 10.1074/jbc.270.22.13147. [DOI] [PubMed] [Google Scholar]
- Eicks M, Maurino V, Knappe S, Flügge UI, Fischer K. The plastidic pentose phosphate translocator represents a link between the cytosolic and the plastidic pentose phosphate pathways in plants. Plant Physiol. 2002;128:512–522. doi: 10.1104/pp.010576. [DOI] [PMC free article] [PubMed] [Google Scholar]
- Eisenreich W, Bacher A. Elucidation of biosynthetic pathways by retrodictive/predictive comparison of isotopomer patterns determined by NMR spectroscopy. In: Setlow J, editor. Genetic Engineering, Principles and Methods. Vol. 22. New York: Kluwer Academic/Plenum Publishers; 2000. pp. 121–153. [DOI] [PubMed] [Google Scholar]
- Eisenreich W, Strauss G, Werz U, Bacher A, Fuchs G. Retrobiosynthetic analysis of carbon fixation in the phototrophic eubacterium Chloroflexus aurantiacus. Eur J Biochem. 1993;215:619–632. doi: 10.1111/j.1432-1033.1993.tb18073.x. [DOI] [PubMed] [Google Scholar]
- Fiaux J, Andersson CJY, Holmberg N, Bülow L, Kallio PT, Szyperski T, Bailey JE, Wüthrich K. 13C NMR flux ratio analysis of Escherichia coli: central carbon metabolism in microaerobic bioprocesses. J Am Chem Soc. 1999;121:1407–1408. [Google Scholar]
- Fien O, Kopka J, Dörmann P, Altmann T, Trethewey RN, Willmitzer L. Metabolite profiling for plant functional genomics. Nat Biotechnol. 2000;18:1157–1161. doi: 10.1038/81137. [DOI] [PubMed] [Google Scholar]
- Flügge UI. Phosphate translocators in plastids. Annu Rev Plant Physiol Plant Mol Biol. 1999;50:27–45. doi: 10.1146/annurev.arplant.50.1.27. [DOI] [PubMed] [Google Scholar]
- Glawischnig E, Gierl A, Tomas A, Bacher A, Eisenreich W. Retrobiosynthetic NMR analysis of amino acid biosynthesis and intermediary metabolism: metabolic flux in developing maize kernels. Plant Physiol. 2001;125:1178–1186. doi: 10.1104/pp.125.3.1178. [DOI] [PMC free article] [PubMed] [Google Scholar]
- Glawischnig E, Tomas A, Eisenreich W, Spiteller P, Bacher A, Gierl A. Auxin biosynthesis in maize kernels. Plant Physiol. 2000;123:1109–1119. doi: 10.1104/pp.123.3.1109. [DOI] [PMC free article] [PubMed] [Google Scholar]
- Hatzfeld W-D, Stitt M. A study of the rate of recycling of triose phosphates in heterotrophic Chenopodium rubrum cells, potato tubers, and maize endosperm. Planta. 1990;180:198–204. doi: 10.1007/BF00193996. [DOI] [PubMed] [Google Scholar]
- Kammerer B, Fischer K, Hilpert B, Schubert S, Gutensohn M, Weber A, Flügge UI. Molecular characterization of a carbon transporter in plastids from heterotrophic tissues: the glucose 6-phosphate/phosphate antiporter. Plant Cell. 1998;10:105–117. doi: 10.1105/tpc.10.1.105. [DOI] [PMC free article] [PubMed] [Google Scholar]
- Keeling PL, Wood JR, Tyson RH, Bridges IG. Starch biosynthesis in developing wheat grain. Plant Physiol. 1988;87:311–319. doi: 10.1104/pp.87.2.311. [DOI] [PMC free article] [PubMed] [Google Scholar]
- Krook JD, Vreugdenhil D, Dijkema C, van der Plas LHW. Sucrose and starch metabolism in carrot (Daucus carota l.) cell suspension cultures analyzed by C-13-labelling: indications for a plastid localized oxidative pentose phosphate pathway. J Exp Bot. 1998;49:1917–1924. [Google Scholar]
- Mareci TH, Freeman R. Mapping proton-proton coupling via double-quantum coherence. J Magn Reson. 1983;51:531–535. [Google Scholar]
- Möhlmann T, Tjaden J, Henrichs G, Quick WP, Häusler R, Neuhaus HE. ADP-glucose drives starch synthesis in isolated maize endosperm amyloplasts: characterization of starch synthesis and transport properties across the amyloplast envelope. Biochem J. 1997;324:503–509. doi: 10.1042/bj3240503. [DOI] [PMC free article] [PubMed] [Google Scholar]
- Neuhaus HE, Emes MJ. Nonphotosynthetic metabolism in plastids. Annu Rev Plant Mol Biol. 2000;51:111–140. doi: 10.1146/annurev.arplant.51.1.111. [DOI] [PubMed] [Google Scholar]
- Park SM, Klapa MI, Sinskey AJ, Stephanopoulos G. Metabolite and isotopomer balancing in the analysis of metabolic cycles: II. Applications Biotechnol Bioeng. 1999;62:392–401. doi: 10.1002/(sici)1097-0290(19990220)62:4<392::aid-bit2>3.0.co;2-s. [DOI] [PubMed] [Google Scholar]
- Schmidt K, Marx A, deGraaf AA, Wiechert W, Sahm H, Nielsen J, Villadsen J. 13C Tracer experiments and metabolite balancing for metabolite flux analysis: comparing two approaches. Biotechnol Bioeng. 1998;58:254–257. doi: 10.1002/(sici)1097-0290(19980420)58:2/3<254::aid-bit19>3.0.co;2-c. [DOI] [PubMed] [Google Scholar]
- Schultz G. Assimilation of non-carbohydrate compounds. In: Raghavendra AS, editor. Photosynthesis. A Comprehensive Treatise. Cambridge, UK: Cambridge University Press; 1997. pp. 183–196. [Google Scholar]
- Shannon JC, Pien FM, Cao H, Liu KC. Brittle-1, an adenylate translocator, facilitates transfer of extraplastidial synthesized ADP-glucose into amyloplasts of maize endosperms. Plant Physiol. 1998;117:1235–1252. doi: 10.1104/pp.117.4.1235. [DOI] [PMC free article] [PubMed] [Google Scholar]
- Szyperski T. Biosynthetically directed fractional 13C-labeling of proteinogenic amino acids: an efficient analytical tool to investigate intermediary metabolism. Eur J Biochem. 1995;232:433–438. doi: 10.1111/j.1432-1033.1995.tb20829.x. [DOI] [PubMed] [Google Scholar]
- Tetlow IJ, Blissett KJ, Emes MJ. Metabolite pools during starch synthesis and carbohydrate oxidation in amyloplasts isolated from wheat endosperm. Planta. 1998;204:100–108. [Google Scholar]
- Trethewey RN, ap Rees T. The role of the hexose transporter in the chloroplasts of Arabidopsis thaliana L. Planta. 1994;195:168–174. [Google Scholar]
- Viola R, Davies HV, Chudeck AR. Pathways of starch and sucrose biosynthesis in developing tubers of potato (Solanum tuberosum L.) and seeds of faba bean (Vicia faba L.) Planta. 1991;183:202–208. doi: 10.1007/BF00197789. [DOI] [PubMed] [Google Scholar]


