Abstract
The HY1 gene of Arabidopsis encodes a plastid heme oxygenase (AtHO1) required for the synthesis of the chromophore of the phytochrome family of plant photoreceptors. To determine the enzymatic properties of plant heme oxygenases, we have expressed the HY1 gene (without the plastid transit peptide) in Escherichia coli to produce an amino terminal fusion protein between AtHO1 and glutathione S-transferase. The fusion protein was soluble and expressed at high levels. Purified recombinant AtHO1, after glutathione S-transferase cleavage, is a hemoprotein that forms a 1:1 complex with heme. In the presence of reduced ferredoxin, AtHO1 catalyzed the formation of biliverdin IXα from heme with the concomitant production of carbon monoxide. Heme oxygenase activity could also be reconstituted using photoreduced ferredoxin generated through light irradiation of isolated thylakoid membranes, suggesting that ferredoxin may be the electron donor in vivo. In addition, AtHO1 required an iron chelator and second reductant, such as ascorbate, for full activity. These results show that the basic mechanism of heme cleavage has been conserved between plants and other organisms even though the function, subcellular localization, and cofactor requirements of heme oxygenases differ substantially.
Phytochromobilin (PΦB), the chromophore of the phytochrome family of photoreceptors, is synthesized in the plastid from 5-aminolevulinic acid via the heme branch of the tetrapyrrole pathway (Terry et al., 1993). There are two enzymatic steps in the synthesis of PΦB from heme: The conversion of heme to biliverdin (BV) IXα (Weller et al., 1996) and the reduction of BV IXα to 3Z-PΦB (Terry et al., 1995), and two corresponding mutants, hy1 and hy2, have been identified in Arabidopsis (Koornneef et al., 1980). Recently, the HY1 (Muramoto et al., 1999) and HY2 (Kohchi et al., 2001) genes were cloned from Arabidopsis. The deduced amino acid sequence of the HY1 gene shows low but significant homology to heme oxygenases from non-plant species (Muramoto et al., 1999), whereas the HY2 gene is a member of a novel bilin reductase gene family (Frankenberg et al., 2001; Kohchi et al., 2001). Preliminary experiments using crude extracts of Escherichia coli confirmed that recombinant HY1 protein has heme oxygenase activity (Muramoto et al., 1999), although no characterization of the purified protein was performed. The HY1 protein also includes a transit peptide that was shown to target the gene product to plastids (Muramoto et al., 1999). Thus, the Arabidopsis HY1 gene encodes for a plastidic heme oxygenase, AtHO1 (Arabidopsis heme oxygenase-1), required for phytochrome chromophore biosynthesis. Recently, three additional genes for heme oxygenase (AtHO2 through AtHO4) that show sequence similarity to AtHO1 were also detected in the genome sequence database (Davis et al., 1999; Muramoto et al., 1999), and a role for AtHO2 in phytochrome chromophore biosynthesis has been proposed (Davis et al., 2001).
Heme oxygenase catalyzes the stereospecific cleavage of heme to BV with the release of Fe2+ and CO (Ortiz de Montellano, 1998). In general, it is the IXα isomer of BV that is produced, although recently a heme oxygenase catalyzing the conversion of heme to predominantly BV IXβ was reported (Ratliff et al., 2001). Genes encoding heme oxygenases have been isolated from a wide variety of organisms including humans, other animals, red algae, cryptophytes, cyanobacteria, and pathogenic bacteria (Ortiz de Montellano and Wilks, 2001). These heme oxygenases perform a wide variety of cellular functions and exhibit different enzymatic characteristics. In mammals, heme oxygenases are involved not only in heme catabolism, but are also thought to be important in neural function and in protection against oxidative stress and tissue injury (Ortiz de Montellano and Wilks, 2001). In some pathogenic bacteria, heme oxygenase is used to scavenge iron from the host during infection (Ortiz de Montellano and Wilks, 2001), whereas in cyanobacteria and algae, heme oxygenase is required for the synthesis of the phycobilin chromophores for photosynthetic light harvesting (Beale, 1993).
These different functions are reflected in different cellular locations and enzymatic properties. Animal heme oxygenase is a membrane-bound enzyme localized in microsomes (Ortiz de Montellano and Wilks, 2001). In this system, the electrons required for the reaction are derived from NADPH-cytochrome P450 reductase. In contrast algal, cyanobacterial, and bacterial heme oxygenases are soluble enzymes (Cornejo and Beale, 1988; Cornejo et al., 1998; Wilks and Schmitt, 1998). The algal heme oxygenase, which is probably localized in plastids, requires reduced ferredoxin to provide the electrons required for the reaction (Rhie and Beale, 1992). The cyanobacterial heme oxygenase has similar requirements and the activity of both enzymes was substantially increased by the presence of a second reductant such as ascorbate (Rhie and Beale, 1995; Cornejo et al., 1998). Analysis of heme oxygenase from Corynebacterium diphtheriae in vitro identified yet another redox partner, a putidaredoxin/putidaredoxin reductase system, although the nature of the reductant in vivo is not known for any of the bacterial heme oxygenase isozymes (Wilks and Schmitt, 1998). The mammalian heme oxygenase reaction has been studied in some detail using recombinant proteins (Suzuki et al., 1992; Wilks and Ortiz de Montellano, 1993; Wilks et al., 1995; Ortiz de Montellano and Wilks, 2001). The first step of the reaction is the formation of a stable complex with a heme molecule that is used as both substrate and prosthetic group. This is followed by three successive monooxygenation reactions to produce BV with the α-methene bridge carbon atom removed as carbon monoxide and the release of Fe2+.
The redox partner used by higher plant heme oxygenases is not currently known. The plastid location of this enzyme suggests that ferredoxin could be the preferred electron donor; however, analysis of known heme oxygenase sequences indicates that the core domain of AtHO1 appears to be equally divergent from that of both animal and cyanobacterial/algal sequences (Davis et al., 2001; Terry et al., 2002). To understand how the mechanism and cofactor requirements of plant heme oxygenases compare with those of its mammalian, algal, and bacterial counterparts we have purified recombinant AtHO1 expressed from an E. coli expression system and characterized the reaction catalyzed by this enzyme. We show that AtHO1 is expressed in high yield and shows a dependence on reduced ferredoxin, a second reductant, and a strong iron chelator for maximum activity. These attributes are discussed in an evolutionary and functional context.
RESULTS
Expression and Purification of AtHO1
E. coli BL21 cells were transformed with the pGEX-HY1ΔTP plasmid and expression of AtHO1 fused to glutathione S-transferase (GST) was induced with isopropyl-β-d-thiogalactopyranoside. This resulted in the cells turning a yellow-brown color (data not shown), in contrast to the situation reported previously for the expression of mammalian (Suzuki et al., 1992; Wilks and Ortiz de Montellano, 1993), cyanobacterial (Cornejo et al., 1998), and bacterial (Wilks and Schmitt, 1998) heme oxygenases in E. coli in which the cells turned green because of BV accumulation. This may indicate that AtHO1 is unable to use E. coli reductases to complete the heme oxygenase reaction or, alternatively, that the fusion protein is not fully active in vivo.
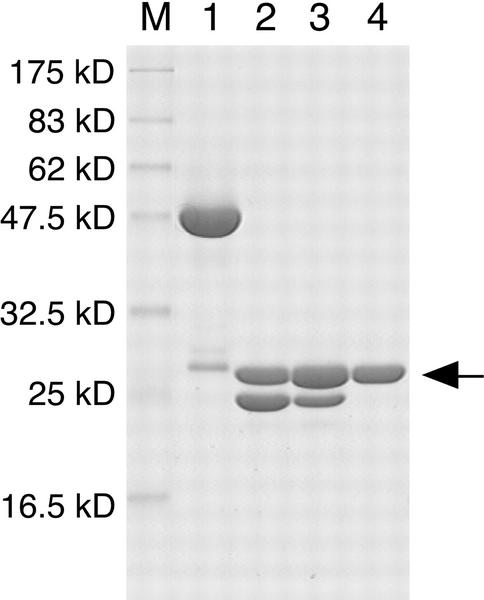
The GST:AtHO1 fusion protein was expressed as a soluble protein of 53 kD as determined by SDS-PAGE (Fig. 1, lane 1). Recombinant AtHO1 was purified by affinity chromatography, thrombin digestion, and anion-exchange chromatography to yield a protein that gave a single band at 27 kD (Fig. 1, lane 4). The final yield of purified AtHO1 from a 1-L culture was estimated to be about 100 mg. Full activity of AtHO1 was maintained for at least 3 months during storage at −30°C in 50 mm HEPES-NaOH (pH 7.2) containing 40% (v/v) glycerol.
Figure 1.
Purification of recombinant AtHO1 protein. SDS-PAGE analysis of recombinant AtHO1. Lane M, Molecular mass markers. Lane 1, GST: AtHO1 after glutathione-Sepharose affinity chromatography. Lane 2, GST: AtHO1 after thrombin digestion. Lane 3, Flow-through fraction of glutathione-Sepharose affinity chromatography of sample shown in lane 2. Lane 4, Purified AtHO1 after Q Sepharose column chromatography. Arrow indicates the position of AtHO1. The protein fraction shown in lane 4 was used for further study.
Formation of the Heme-AtHO1 Complex
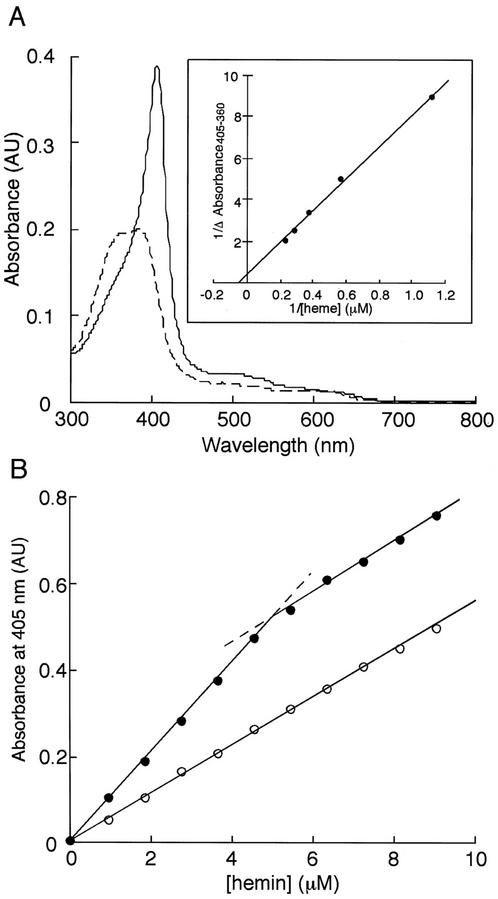
One of the unusual characteristics of heme oxygenases is that they use heme both as a substrate and a prosthetic group, and can form a stable complex with heme (Yoshida and Kikuchi, 1978a). To investigate whether recombinant AtHO1 could form such a complex, AtHO1 was incubated with heme and the absorption spectrum recorded after removal of excess heme by passage through a hydroxyapatite column. The absorption spectrum of the heme-AtHO1 complex is shown in Figure 2A. The spectrum is typical of a hemoprotein with a Soret maximum at 405 nm similar to that previously reported for ferric heme-heme oxygenase complexes (Yoshida and Kikuchi, 1978a; Wilks and Ortiz de Montellano, 1993; Wilks and Schmitt, 1998).
Figure 2.
The heme-AtHO1 complex. A, Absorption spectrum of the heme-AtHO1 complex (solid line) and free heme (dotted line). Inset, Reciprocal plot for heme binding determined by difference absorption spectroscopy. B, Spectrophotometric titration of AtHO1: black circles, hemin with 5 μm AtHO1; and white circles, hemin only. The dashed lines indicate the extensions of the two linear phases of the AtHO1:hemin titration data.
Titration of AtHO1 with hemin was carried out by after absorbance changes at 405 nm, close to the Soret maxima of bound and free hemin. As shown in Figure 2B, the titration curve of AtHO1 with hemin gave a well-defined inflection point corresponding to a molar stoichiometry of heme and AtHO1 of 1:1. We calculated the heme binding constant (Kd) by difference absorption spectroscopy according to the method of Wilks and Schmitt (1998) and obtained a value of approximately 1.5 μm (Fig. 2A, inset). This is close to the values of 2.5 and 0.84 μm reported for recombinant C. diptheriae (Wilks and Schmitt, 1998) and human (Wilks et al., 1996) heme oxygenases, respectively.
AtHO1 Is a Ferredoxin-Dependent Heme Oxygenase
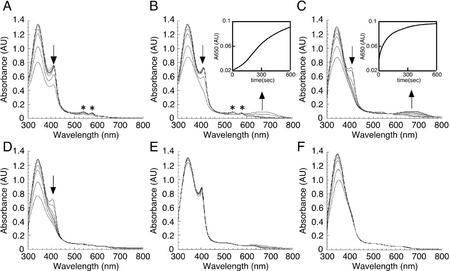
To confirm that AtHO1 is a heme oxygenase, we followed the reaction spectrophotometrically (Fig. 3). Incubation of AtHO1 and heme with reduced ferredoxin resulted in the disappearance of the AtHO1-heme complex with a shift of the Soret peak to 410 nm and the appearance of two peaks with maxima at 540 and 578 nm (Fig. 3A). These peaks are indicative of a ferrous dioxyheme complex [Heme(Fe2+)-O2] as has been observed previously (Yoshida and Kikuchi, 1978a; Wilks and Ortiz de Montellano, 1993; Wilks and Schmitt, 1998). Under these conditions, no BV formation was detected. When the iron chelator desferrioxamine was included in the assay, a broad peak at around 650 to 670 nm was observed indicating the formation of BV (Fig. 3B). Analysis of other potential iron chelators indicated that o-phenanthrolin was almost as effective as desferrioxamine, whereas 4,5-dihydroxy-1,3-benzene disulphonic acid (Tiron) also supported BV formation (Table I).
Figure 3.
Catalytic activity of AtHO1. Time-dependent absorbance changes were monitored during the AtHO1 reaction with spectra taken at 0, 5, 20, 60, 120, 300, and 600 s after the addition of NADPH. A, Control reaction including recombinant AtHO1 (10 μm), hemin (10 μm), and ferredoxin (50 μg mL−1). Inset, Change in A650 as a function of time. B, Reaction + desferrioxamine (2 mm). C, Reaction + ascorbate (5 mm), +desferrioxamine. Inset, Change in A650 as a function of time. D, Reaction + ascorbate, −ferredoxin. E, Reaction + ascorbate, +desferrioxamine, −ferredoxin. F, Reaction − AtHO1, +ascorbate, + desferrioxamine. Asterisks indicate α-/β-bands of the ferrous dioxyheme complex. Arrows indicate the direction of absorbance changes during incubation.
Table I.
The effect of chelators on the AtHO1 reaction
| Chelator (2 mm) | BV | Relative Activity |
|---|---|---|
| nmol min−1 | % | |
| Desferrioxamine | 1.71 | 100 |
| Tiron | 0.81 | 47.3 |
| o-Phenanthrolin | 1.71 | 100 |
| EDTA | 0.69 | 40.4 |
| No chelator | 0.43 | 25.1 |
| No enzyme | 0.02 | 1.1 |
Reactions were carried out for 10 min using the standard heme oxygenase assay as described in “Materials and Methods” with desferrioxamine replaced by different chelators.
Both algal (Rhie and Beale, 1992) and cyanobacterial (Cornejo et al., 1998) heme oxygenases use ferredoxin as the principal reductant. In these systems, a second reductant substantially increases enzyme activity; therefore, we examined the effect of additional reductants on AtHO1 activity. Ascorbate increased the rate of BV formation by about 10-fold (Fig. 3C; Table II), with isoascorbate and 6-hydroxy-2,5,7,8-tetramethylchroman-2-carboxylic acid (Trolox) also significantly increasing AtHO1 activity (Table II). Interestingly, the peaks at 540 and 578 nm that appeared during the reaction with ferredoxin (with or without desferrioxamine; Fig. 3, A and B) were not apparent in the presence of ascorbate (Fig. 3, C and D), indicating that the ferrous dioxyheme complex did not accumulate under these conditions. Consistent with this observation, the time course for AtHO1 activity in the absence of ascorbate showed a lag phase, indicating that this reaction does not show typical Michaelis-Menten kinetics for BV formation with ferredoxin alone (Fig. 3B, inset). In contrast, in the presence of ascorbate, the reaction proceeded without a lag phase (Fig. 3C, inset) and showed normal Michaelis-Menten kinetics (data not shown). Control experiments in which either AtHO1 was excluded from the reaction (Fig. 3F) or ferredoxin was removed (Fig. 3E) did not result in the appearance of the ferrous dioxyheme complex or BV, indicating that both components are absolutely essential for the reaction to proceed under these conditions. In addition, AtHO1 was not active if cytochrome P450 reductase was substituted for ferredoxin (data not shown).
Table II.
The effect of reductants on the AtHO1 reaction
| Reductants (5 mm) | BV | Relative Activity |
|---|---|---|
| nmol min−1 | % | |
| Ascorbate | 1.46 | 100 |
| Iso-ascorbate | 1.18 | 81.0 |
| Dehydroascorbate | 0.23 | 15.8 |
| Dithothreitol | NDa | ND |
| Trolox | 0.81 | 55.3 |
| None | 0.14 | 9.8 |
Reactions were carried out for 10 min using the standard heme oxygenase assay as described in “Materials and Methods” with ascorbate replaced by different reductants.
ND, Not detectable.
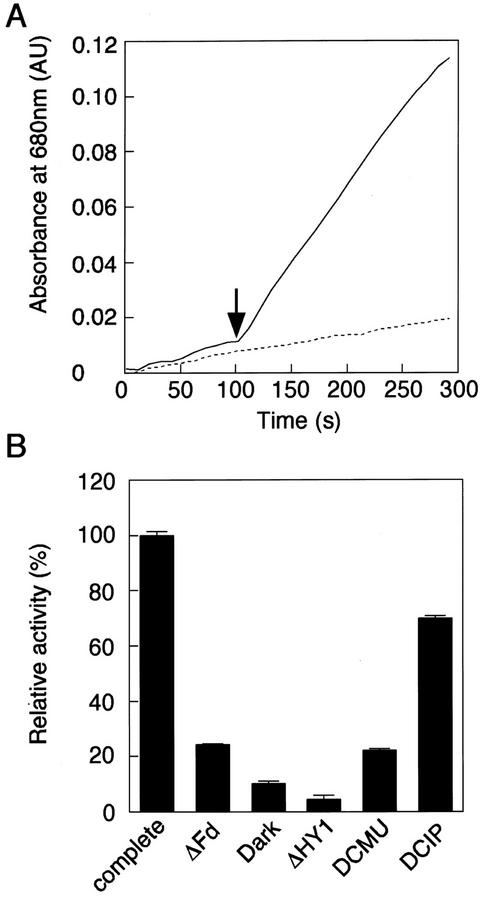
To gain further insight into the function of AtHO1 in vivo, we tested the ability of isolated thylakoid membranes to drive ferredoxin-mediated BV synthesis in the presence of light. Figure 4 shows that the conversion of heme to BV was dramatically increased upon illumination. This result was dependent on the presence of ferredoxin and AtHO1 and BV production was prevented by the electron transport inhibitor DCMU (Fig. 4B). Furthermore, inhibition by DCMU could be overcome if electrons were donated directly to PSI using reduced dichloroindophenol, indicating that PSI is the site of ferredoxin reduction. These results indicate that ferredoxin can mediate light-driven BV formation by AtHO1 and support a role for ferredoxin as the primary electron donor in vivo.
Figure 4.
Light dependency of the AtHO1 reaction. Light dependency of the AtHO1 reaction was observed using isolated thylakoid membranes as an electron donor. A, The reaction was incubated at 25°C in the dark (dashed line) or irradiated with white light after 100 s (solid line) as indicated by the arrow and absorbance was monitored at 680 nm (indicating BV synthesis). B, The relative AtHO1 activity determined as the rate of change of A680 was measured in the complete reaction in the light (complete) and in darkness (dark), in the absence of ferredoxin (ΔFd) or AtHO1 (ΔHY1), and in the presence of 10 μm dichlorophenyldimethylurea (DCMU) or 10 μm DCMU and 100 μm dichloroindophenol. Error bars indicate ± se.
AtHO1 Converts Heme to BV IXα and CO
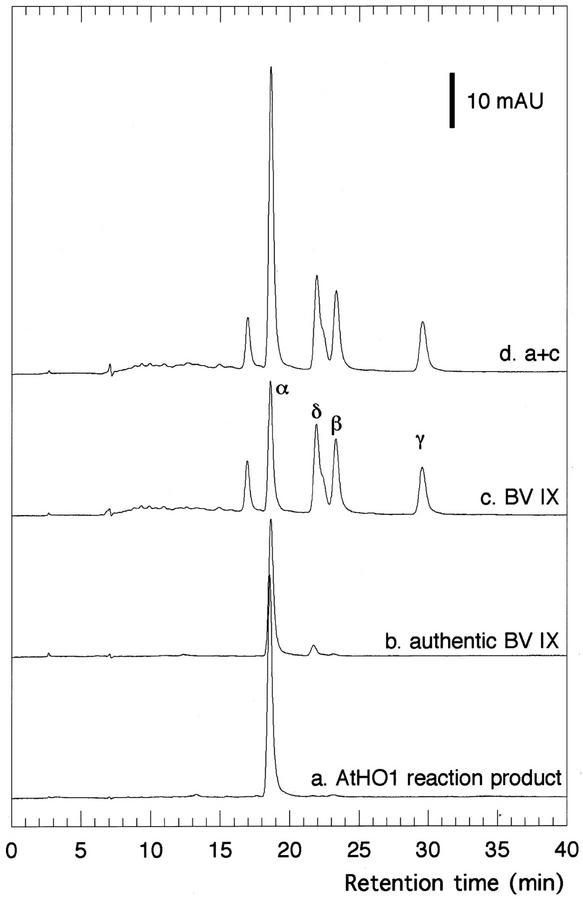
To establish that only the IXα isomer of BV was produced during the heme oxygenase reaction, pigments were extracted from the reaction mixture after completion of the reaction, esterified, and analyzed by HPLC (Fig. 5). The extracted products are shown in trace a (Fig. 5). The major peak with a retention time of 18.6 min corresponded to authentic BV IXα (trace b). The chemically synthesized products containing all four isomers of BV IX were also analyzed (trace c) and the product of the AtHO1 reaction was shown to co-elute with the IXα isomer of BV (trace d). Therefore, the product of the AtHO1 reaction is exclusively BV IXα.
Figure 5.
BV IXα is a product of the AtHO1 reaction. Heme oxygenase reaction products were analyzed by reverse-phase HPLC after esterification. Trace a, Products from the complete AtHO1 reaction. Trace b, Authentic BV IXα. Trace c, Mixture of BV IX isomers obtained by chemical oxidative degradation of hemin. Trace d, Products from the complete AtHO1 reaction co-injected with the mixture of BV IX isomers. Absorbance was monitored at 380 nm.
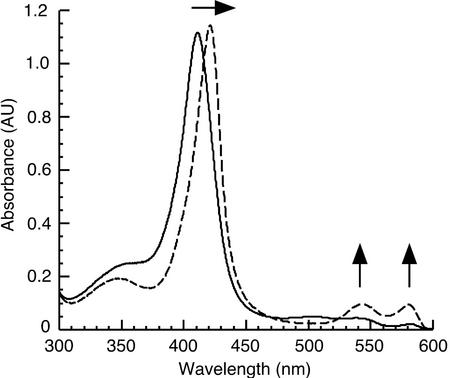
Oxidative cleavage of heme results in the release of CO; therefore, we analyzed CO synthesis using a myoglobin-binding assay based on difference absorption spectroscopy (Wilks and Schmitt, 1998). After incubation with the AtHO1 reaction mixture, the myoglobin Soret band was observed to shift from 408 to 421 nm, with the appearance of α/β absorption bands at 568 and 538 nm, respectively (Fig. 6). The conversion of the ferric myoglobin to the ferrous carbon monoxide-bound myoglobin indicates that CO is a product of the AtHO1 reaction. We monitored the production of CO under a number of different reaction conditions. CO production was observed in the absence of ascorbate, although the rate of production was reduced (data not shown). Similarly, the exclusion of the iron chelator desferrioxamine also resulted in a reduced rate of CO production (data not shown).
Figure 6.
CO is a product of the AtHO1 reaction. Absorption spectra of myoglobin before (solid line, Soret peak 408 nm) and 10 min after (dotted line, Soret peak 421 nm) the addition of the AtHO1 reaction products.
Reaction Properties
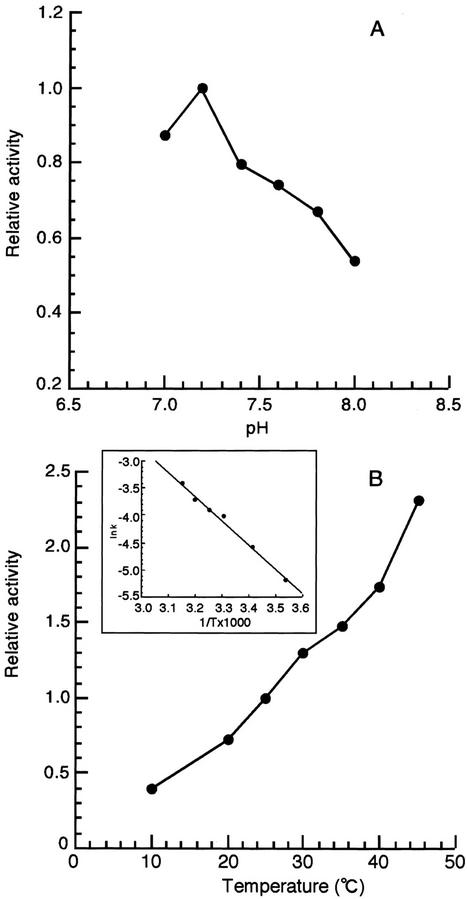
We determined the optimum pH and temperature for the AtHO1 reaction (Fig. 7). These experiments were performed in the presence of excess ferredoxin NADP+ reductase so that the results reflected the properties of AtHO1. Under these conditions, the optimum pH was 7.2 and dropped sharply either side of this value (Fig. 7A). The rate of the AtHO1 reaction increased to a temperature of 50°C and declined thereafter (Fig. 7B). From an Arrhenius plot (Fig. 7B, inset), the activation energy of the AtHO1 reaction was calculated to be 8,740 calories mol−1.
Figure 7.
pH and temperature dependence of the AtHO1 reaction. The relative activity of AtHO1 was calculated by BV formation. A, pH dependency; B, temperature dependency. B, inset, Arrhenius plot of data shown in B.
We estimated kinetic parameters for the AtHO1 reaction. Under these conditions, the Vmax was 156 nmol BV h nmol−1 protein with an apparent Km value for hemin of 1.3 μm. These values are comparable with those previously reported for human heme oxygenase (Wilks et al., 1995). The apparent Km values for ferredoxin and ascorbate were 1.9 μm and 0.42 mm, respectively.
DISCUSSION
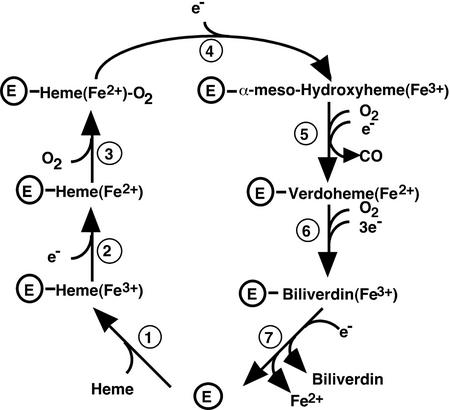
The results described here demonstrate that the mechanism of heme cleavage is broadly conserved between higher plants and previously identified mammalian and bacterial heme oxygenases and results in the production of BV IXα and CO (Figs. 3, 5, and 6). In addition, AtHO1 was able to bind to heme and form a stable complex with a similar absorption spectrum to that obtained with mammalian heme oxygenases. This suggests that although the amino acid sequence of AtHO1 is not closely related to mammalian heme oxygenase sequences, the structure of the heme-binding site is conserved. Consistent with this, the proximal heme-binding ligand of human HO-1, His-25 (Sun et al., 1994), is conserved in AtHO1 as His-86 (His-31 in the mature protein after cleavage of the transit peptide; Muramoto et al., 1999). The proposed mechanism of the heme cleavage reaction based on the scheme proposed for mammalian heme oxygenases is shown in Figure 8.
Figure 8.
The proposed mechanism of BV IXα synthesis from heme mediated by heme oxygenase. This model has been adapted and modified from Ortiz de Montellano (1998).
Not all aspects of the heme oxygenase reaction are conserved, however, and one factor that is highly variable between different groups of organisms is the source of reducing equivalents. The mammalian enzyme uses NADPH cytochrome P450 reductase as its sole source of electrons (Yoshida and Kikuchi, 1978b), whereas the algal and cyanobacterial heme oxygenases use reduced ferredoxin (Cornejo and Beale, 1988; Rhie and Beale, 1992; Cornejo et al., 1998). A third redox partner, putidaredoxin, has been identified from in vitro studies for heme oxygenase from C. diphtheriae (Wilks and Schmitt, 1998). As a plastid-localized enzyme, it might be predicted that AtHO1 would be most similar to the algal heme oxygenases that are encoded in the plastid genome (Reith and Munholland, 1995; Richaud and Zabulon, 1997) or the corresponding cyanobacterial enzyme (Cornejo et al., 1998). Nuclear-encoded Arabidopsis proteins predicted to be of plastid origin have generally been shown to be most similar to proteins from the cyanobacterium Synechocystis sp. PCC 6803 (Arabidopsis Genome Initiative, 2000). However, such an evolutionary relationship was not supported by phylogenetic analysis of heme oxygenase sequences (Davis et al., 2001; Terry et al., 2002). In these analyses, AtHO1 was found to be at least equally divergent from a branch containing algal and cyanobacterial sequences as it was from mammalian sequences. Therefore, it is unclear whether AtHO1 has its origin in the plastid genome or has a different lineage.
To examine if there is biochemical conservation between the plant and algal/cyanobacterial proteins, we determined the reductant requirements for the plant enzyme. The results demonstrate that AtHO1 activity is supported by reduced ferredoxin (Figs. 3 and 4), but not by cytochrome P450 reductase. In addition, we have shown that ferredoxin-mediated AtHO1 activity can be driven directly by light in the presence of isolated thylakoid membranes. This supports the view that ferredoxin is the electron donor in vivo, although we cannot rule out other possibilities. The observation that the plant enzyme uses ferredoxin is consistent with its localization in plastids (Muramoto et al., 1999) and it appears that the use of ferredoxin as an electron donor is conserved in all photosynthetic organisms examined to date. The next enzyme in the pathway, PΦB synthase, is also ferredoxin dependent (Kohchi et al., 2001).
A second feature that AtHO1 has in common with the algal and cyanobacterial enzymes is the requirement for a second reductant for BV formation. In this case, activity in the absence of any second reductant was just 10% of the activity with the most effective, ascorbate (Table II). Activity with Trolox was about one-half that with ascorbate. These results are similar to those obtained with partially purified heme oxygenase from Cyanidium caldarium (Cornejo and Beale, 1988; Rhie and Beale, 1995), whereas the cyanobacterial enzyme was most active with Trolox and could also partially function without any second reductant (14% of maximum activity; Cornejo et al., 1998). The function of the ascorbate in the heme oxygenase reaction is not known. Rhie and Beale (1995) were able to exclude a role for it solely in the reduction of Fe3+-heme (step 2, Fig. 8) or Fe3+-BV (step 7), leaving the reduction of the ferrous dioxyheme complex to α-meso-hydroxyheme (step 4) and/or the reduction of verdoheme to Fe3+-BV (step 6) as possibilities. The observation that the ferrous dioxyheme complex does not accumulate in the presence of ascorbate (Fig. 3), together with a reduction in CO production in the absence of ascorbate, suggests that this reductant may play a role in the formation of α-meso-hydroxyheme (step 4). However, some CO is produced under these conditions and ascorbate is clearly not absolutely required for this step or for the reduction of Fe3+-heme (step 2), in agreement with Rhie and Beale (1995). In contrast, ferredoxin is absolutely required for the reaction to progress through step 5 (Figs. 3 and 8). If ascorbate is not required for Fe3+-BV reduction as suggested previously (Rhie and Beale, 1995), then we may propose that ascorbate also has a role in the reduction of verdoheme to Fe3+-BV (step 6). Interestingly, the effect of ascorbate is saturable (Km = 0.42 mm), suggesting that ascorbate is reversibly binding to the enzyme and, therefore, may function as a cofactor rather than simply as a reductant.
Another important feature of the plant enzyme is the dependence on the presence of an iron chelator for BV formation. This effect has been observed previously for Cyanidium caldarium heme oxygenase (Rhie and Beale, 1995) and is believed to be required for the release of iron from the ferric-BV complex (step 7; Fig. 8). In both cases, desferrioxamine was found to be most effective (Table I; Rhie and Beale, 1995). A requirement for chelators for full activity was not reported for heme oxygenase from the cyanobacterium Synechocystis sp. PCC 6803 (Cornejo et al., 1998), but a small stimulation of activity was seen with pig (Sus crofa) microsomal heme oxygenase (Yoshida and Kikuchi, 1978b) and the C. diptheriae enzyme also requires an iron chelator (A. Wilks, personal communication). We can speculate that the strong dependence on iron chelators of the plant and algal heme oxygenases may be related to the plastid environment in which the Arabidopsis and C. caldarium heme oxygenases are localized. It has been reported that more than 90% of cellular iron is in the chloroplast (Terry and Abadía, 1986) and this high endogenous iron concentration may partially explain the requirement for an iron chelator for full activity. It has been proposed that the iron chelator nicotianamine controls the availability of iron to chloroplast-localized ferrochelatase (Stephan, 1995) and it is possible that this chelator may also have a role in promoting heme oxygenase activity in vivo.
It is clear that other biochemical properties of AtHO1 are also well suited to its role as a plastid-localized enzyme required for phytochrome chromophore biosynthesis. Ferredoxin is plastid localized and chloroplasts also contain very high levels of ascorbate (Smirnoff et al., 2001). The pH optimum of AtHO1 activity was 7.2, close to the pH of the stroma at night (Enser and Heber, 1980). During the day, the stromal pH is 8.0 and AtHO1 activity, therefore, would be predicted to be higher at night. However, more reducing power would be available during the day because of higher rates of photosynthetic activity. The expression of AtHO1 is also slightly higher in the light (Davis et al., 1999). The significance of these observations for the regulation of heme oxygenase activity is not yet clear. Very little information is available on the flux through heme branch of the plant tetrapyrrole pathway. Overexpression of phytochrome apoprotein in plant cells leads to a substantial increase in active holoprotein (e.g. Cherry et al., 1991) and it is not thought that chromophore synthesis is limiting under normal conditions. However, analysis of diurnal fluctuations in the expression and activity of tetrapyrrole biosynthesis enzymes has revealed that the flux through the heme and chlorophyll branches of the pathway is carefully controlled and it has been suggested that there is a channeling of precursors to the heme branch after the light to dark transition (Papenbrock et al., 1999). It may be that the amount and activity of AtHO1 is more responsive to the demands of heme degradation than PΦB synthesis, but testing this hypothesis will require a much more detailed understanding of the regulation of heme and PΦB synthesis. With the recent cloning of PΦB synthase (Kohchi et al., 2001), physiological and molecular studies can now be undertaken to provide a much better understanding of how PΦB synthesis is regulated in plants.
MATERIALS AND METHODS
Expression and Purification of Recombinant AtHO1
The plasmid pGEX-HY1ΔTP containing the HY1 gene (excluding the coding region for the transit peptide) fused at the 5′ end to the gene coding for Schistosoma japonicum GST was constructed and transformed into Escherichia coli as described previously (Muramoto et al., 1999), except that the E. coli strain used was BL21 (DE3). Cells containing the expressed AtHO1 were isolated and washed also as previously described (Muramoto et al., 1999) and were lysed by sonication for 2 min on ice. The lysate was centrifuged at 100,000g for 30 min and the supernatant applied to a glutathione-Sepharose 4B column (1.5 × 2.7 cm; Amersham Pharmacia Biotech, Uppsala). The fusion protein was purified, digested with thrombin, and separated from GST according to the manufacturer's instructions (Amersham Pharmacia Biotech). Protein fractions containing AtHO1 were further purified on a Q Sepharose HP column (HR 16/10) equilibrated with 100 mm HEPES-NaOH (pH 7.4) containing 100 mm NaCl. The protein was eluted with a linear gradient of 100 to 300 mm NaCl buffered with HEPES-NaOH (pH 7.4) and fractions containing heme oxygenase activity were pooled. The protein concentration of AtHO1 was determined using an extinction coefficient at 280 nm of 34.1 mm−1 cm−1 calculated from the deduced amino acid composition (Gill and von Hippel, 1989).
Reconstitution and Titration of AtHO1 with Heme
The heme-AtHO1 complex was prepared as described previously for the heme-heme oxygenase complex (Yoshida and Kikuchi, 1978a). Hemin (Sigma Chemical Co., St. Louis) was added to the purified AtHO1 to give a final 2:1 heme:protein ratio. The sample was applied to a hydroxyapatite column (1.0 × 3.0 cm) equilibrated with 10 mm potassium phosphate buffer (pH 7.4). The column was then washed with the same buffer until no more free heme could be detected spectrophotometrically, and the protein eluted in 200 mm potassium phosphate buffer (pH 7.4). The fractions containing the heme-AtHO1 complex were pooled and dialyzed against 100 mm HEPES-NaOH (pH 7.4).
Titration of AtHO1 with heme was monitored by absorption spectroscopy. Aliquots of heme (0.1–10 μm) were added to the cuvette containing 5 μm AtHO1 at 25°C. Spectra were recorded 5 min after heme addition and the Kd value was obtained from the absorbance difference between 405 and 350 nm.
Heme Oxygenase Assay
Heme oxygenase activity was assayed as previously described with minor modifications (Muramoto et al., 1999). The assays (1-mL final volume unless otherwise indicated) contained 0.1 μm recombinant AtHO1, 10 μm hemin, 0.15 mg mL−1 bovine serum albumin, 50 μg mL−1 (4.2 μm) spinach (Spinacia oleracea) ferredoxin (Sigma Chemical Co.), 0.025 units mL−1 spinach ferredoxin-NADP+ reductase (Sigma Chemical Co.), 5 mm ascorbate, and 2 mm desferrioxamine in 100 mm HEPES-NaOH buffer (pH 7.2). The reaction was started by adding NADPH to a final concentration of 100 μm and absorbance changes between 300 and 800 nm were recorded for 10 min. The rate of BV IXα formation at 25°C was calculated using the absorbance change at 650 nm. The concentration of BV IXα was estimated using a molar absorption coefficient at 650 nm of 6.25 mm−1 cm−1 in 0.1 m HEPES-NaOH buffer (pH 7.2) determined from published values in other solvents (Brindle et al., 1986). Km and Vmax values were calculated for AtHO1 using Hanes-Woolf plots. For hemin, the data were obtained using the standard assay, with an AtHO1 concentration of 0.2 μm, with the heme concentration varied between 0.5 and 20 μm. For ascorbate and ferredoxin, the concentrations of these reductants were varied between 0.1 and 10 mm and 0.17 and 33.6 μm, respectively. The effects of temperature and pH were determined using the standard assay conditions as described above.
Experiments on light- and thylakoid-mediated BV synthesis were based on those of Miyake and Asada (1994). Recombinant AtHO1 (6 μm) was incubated with 20 μm hemin, 0.3 mg mL−1 bovine serum albumin, 7 μm spinach ferredoxin, isolated thylakoid membranes (10 μg of chlorophyll), 5 mm ascorbate, and 2 mm desferrioxamine in 100 mm HEPES-NaOH buffer (pH 7.2) either in the dark or for 100 s in the dark followed by irradiation with 400 W m−2 of actinic white light. Absorbance was monitored at 680 nm and AtHO1 activity was calculated by the rate of absorbance change at this wavelength.
HPLC Analysis of AtHO1 Reaction Products
On completion of the heme oxygenase reaction, glacial acetic acid (50 μL) and 5 m HCl (100 μL) were added to 500-μL aliquots of the reaction mixture and the products extracted into chloroform (500 μL) as described by Wilks and Ortiz de Montellano (1993). The organic layer was washed with distilled water (3 × 500 μL) and the chloroform was removed under a stream of argon. The residue was dissolved in 100 μL of 4% (v/v) sulfuric acid in methanol and esterified overnight at room temperature. The sample was then diluted with distilled water (400 μL) and the esters were extracted into chloroform. The organic layer was washed repeatedly and chloroform was removed as described above. The samples were dissolved in HPLC solvent consisting of methanol:water (85:15 [v/v]) and centrifuged at 12,000g for 15 s. The sample was analyzed by reverse phase HPLC on a Wakosil-II 5C18HG column (5 μm, C18, 4.6 × 250 mm, Wako, Osaka) with elution at a flow rate of 0.4 mL min−1 and monitored at 380 nm (Zhu et al., 2000). The mixture of all four BV IX isomers was synthesized by oxidative degradation of hemin (O'Cara and Colleran, 1970). BV IXα was purchased from Porphyrin Products Inc. (Logan, Utah). All BV standards were esterified as described above.
Detection of Carbon Monoxide as a Reaction Product
Detection of carbon monoxide was carried out according to the method of Wilks and Schmitt (1998) with minor modifications. Ten micromolar recombinant AtHO1, 10 μm hemin, 50 μg mL−1 spinach ferredoxin, 0.025 units mL−1 spinach ferredoxin-NADP+ reductase, 5 mm ascorbate, and 2 mm desferrioxamine in 100 mm HEPES-NaOH buffer (pH 7.2) were placed in both the reference and reaction cuvettes (1-mL final volume). Myoglobin (10 μm) was added only to the reaction cuvette and the reaction started by adding 200 μm NADPH to both cuvettes. The difference spectrum was recorded by absorption spectroscopy at 1 min intervals between 300 and 600 nm and the transition from 404 to 421 nm was monitored.
ACKNOWLEDGMENTS
We thank Professor J. Clark Lagarias and Michael T. McDowell (University of California, Davis) for helping with the initial assay of AtHO1 activity and for useful suggestions. We also thank Drs. Kanji Ohyama (Kyoto University, Japan), Miho Takemura, Chikahiro Miyake, and Mr. Munehisa Masuda (Nara Institute of Science and Technology, Japan) for helpful discussions and encouragement, and Dr. Philip J. Linley (University of Southampton, UK) for help with the HPLC assay. We also thank Dr. Angela Wilks (University of Maryland, Baltimore) for critical reading of the manuscript.
Footnotes
This work was supported in part by the “Research for the Future” Program 00L01605 from the Japan Society for the Promotion of Science (to T.K.), by the Royal Society University (Research Fellowship to M.J.T.), and by the UK Biotechnology and Biological Sciences Research Council (grant nos. 51/P10948 and ISIS982 to M.J.T.).
Article, publication date, and citation information can be found at www.plantphysiol.org/cgi/doi/10.1104/pp.008128.
LITERATURE CITED
- Arabidopsis Genome Initiative. Analysis of the genome sequence of the flowering plant Arabidopsis thaliana. Nature. 2000;408:796–815. doi: 10.1038/35048692. [DOI] [PubMed] [Google Scholar]
- Beale SI. Biosynthesis of phycobilins. Chem Rev. 1993;93:785–802. [Google Scholar]
- Brindle NJM, North ACT, Brown SB. Theoretical prediction and experimental measurement of the bile-pigment isomer pattern obtained from degradation of catalase haem. Biochem J. 1986;236:303–306. doi: 10.1042/bj2360303. [DOI] [PMC free article] [PubMed] [Google Scholar]
- Cherry JR, Hershey HP, Vierstra RD. Characterization of tobacco expressing functional oat phytochrome. Plant Physiol. 1991;96:775–785. doi: 10.1104/pp.96.3.775. [DOI] [PMC free article] [PubMed] [Google Scholar]
- Cornejo J, Beale SI. Algal heme oxygenase from Cyanidium caldarium. J Biol Chem. 1988;263:11915–11921. [PubMed] [Google Scholar]
- Cornejo J, Willows RD, Beale SI. Phytobilin biosynthesis: cloning and expression of a gene encoding soluble ferredoxin-dependent heme oxygenase from Synechocystis sp. PCC6803. Plant J. 1998;15:99–107. doi: 10.1046/j.1365-313x.1998.00186.x. [DOI] [PubMed] [Google Scholar]
- Davis SJ, Bhoo SH, Durski AM, Walker JM, Vierstra RD. The heme-oxygenase family required for phytochrome chromophore biosynthesis is necessary for proper photomorphogenesis in higher plants. Plant Physiol. 2001;126:656–669. doi: 10.1104/pp.126.2.656. [DOI] [PMC free article] [PubMed] [Google Scholar]
- Davis SJ, Kurepa J, Vierstra RD. The Arabidopsis thaliana HY1 locus, required for phytochrome-chromophore biosynthesis, encodes a protein related to heme oxygenase. Proc Natl Acad Sci USA. 1999;96:6541–6546. doi: 10.1073/pnas.96.11.6541. [DOI] [PMC free article] [PubMed] [Google Scholar]
- Enser U, Heber U. Metabolic regulation by pH gradients. Inhibition of photosynthesis by indirect proton transfer across the chloroplast envelope. Biochim Biophys Acta. 1980;592:577–591. doi: 10.1016/0005-2728(80)90102-4. [DOI] [PubMed] [Google Scholar]
- Frankenberg N, Mukougawa K, Kohchi T, Lagarias JC. Functional genomic analysis of the HY2 family of ferredoxin-dependent bilin reductases from oxygenic photosynthetic organisms. Plant Cell. 2001;13:965–978. doi: 10.1105/tpc.13.4.965. [DOI] [PMC free article] [PubMed] [Google Scholar]
- Gill SC, von Hippel PH. Calculation of protein extinction coefficients from amino acid sequence. Anal Biochem. 1989;182:319–326. doi: 10.1016/0003-2697(89)90602-7. [DOI] [PubMed] [Google Scholar]
- Kohchi T, Mukougawa K, Frankenberg N, Masuda M, Yokota A, Lagarias JC. The Arabidopsis HY2 gene encodes phytochromobilin synthase, a ferredoxin-dependent biliverdin reductase. Plant Cell. 2001;13:425–436. doi: 10.1105/tpc.13.2.425. [DOI] [PMC free article] [PubMed] [Google Scholar]
- Koornneef M, Rolff E, Spruit CJP. Genetic control of light-inhibited hypocotyl elongation in Arabidopsis thaliana (L.) Heynh. Z Pflanzenphysiol. 1980;100:147–160. [Google Scholar]
- Miyake C, Asada K. Ferredoxin-dependent photoreduction of the monoascorbate radical in spinach thylakoids. Plant Cell Physiol. 1994;35:539–549. [Google Scholar]
- Muramoto T, Kohchi T, Yokota A, Hwang I, Goodman HM. The Arabidopsis photomorphogenic mutant hy1 is deficient in phytochrome chromophore biosynthesis as a result of a mutation in a plastid heme oxygenase. Plant Cell. 1999;11:335–348. doi: 10.1105/tpc.11.3.335. [DOI] [PMC free article] [PubMed] [Google Scholar]
- O'Cara P, Colleran E. Separation and identification of biliverdin isomers and isomer analysis of phycobilin and bilirubin. J Chromatogr. 1970;50:458–468. doi: 10.1016/s0021-9673(00)97973-1. [DOI] [PubMed] [Google Scholar]
- Ortiz de Montellano PR. Heme oxygenase mechanism: evidence for an electrophilic, ferric peroxide species. Acc Chem Res. 1998;31:543–549. [Google Scholar]
- Ortiz de Montellano PR, Wilks A. Heme oxygenase structure and mechanism. Adv Inorg Chem. 2001;51:359–407. [Google Scholar]
- Papenbrock J, Mock HP, Kruse E, Grimm B. Expression studies in tetrapyrrole biosynthesis: inverse maxima of magnesium chelatase and ferrochelatase activity during cyclic photoperiods. Planta. 1999;208:264–273. [Google Scholar]
- Ratliff M, Zhu W, Deshmukh R, Wilks A, Stojiljkovic I. Homologues of the Nesserial heme oxygenase in gram-negative bacteria: degradation of heme by the product of the pigA gene of Pseudomonas aeruginosa. J Bacteriol. 2001;183:6394–6403. doi: 10.1128/JB.183.21.6394-6403.2001. [DOI] [PMC free article] [PubMed] [Google Scholar]
- Reith ME, Munholland J. Complete nucleotide sequence of the Porphyra purpurea chloroplast genome. Plant Mol Biol Rep. 1995;13:333–335. [Google Scholar]
- Richaud C, Zabulon G. The heme oxygenase gene (pbsA) in the red alga Rhodella violacea is discontinuous and transcriptionally activated during iron limitation. Proc Natl Acad Sci USA. 1997;94:11736–11741. doi: 10.1073/pnas.94.21.11736. [DOI] [PMC free article] [PubMed] [Google Scholar]
- Rhie G, Beale SI. Biosynthesis of phycobilins. Ferredoxin-supported NADPH-independent heme oxygenase and phycobilin-forming activities from Cyanidium caldarium. J Biol Chem. 1992;267:16088–16093. [PubMed] [Google Scholar]
- Rhie G, Beale SI. Phycobilin biosynthesis: reductant requirements and product identification for heme oxygenase from Cyanidium caldarium. Arch Biochem Biophys. 1995;320:182–194. doi: 10.1006/abbi.1995.1358. [DOI] [PubMed] [Google Scholar]
- Smirnoff N, Conklin PL, Loewus FA. Biosynthesis of ascorbic acid in plants: a renaissance. Annu Rev Plant Physiol Plant Mol Biol. 2001;52:437–467. doi: 10.1146/annurev.arplant.52.1.437. [DOI] [PubMed] [Google Scholar]
- Stephan UW. The plant-endogenous Fe(II)-chelator nicotianamine restricts the ferrochelatase activity of tomato chloroplast. J Exp Bot. 1995;46:531–537. [Google Scholar]
- Sun J, Loehr TM, Wilks A, Ortiz de Montellano PR. Identification of histidine 25 as the heme ligand in human liver heme oxygenase. Biochemistry. 1994;33:13734–13740. doi: 10.1021/bi00250a026. [DOI] [PubMed] [Google Scholar]
- Suzuki T, Sato M, Ishikawa K, Yoshida T. Nucleotide sequence of cDNA for porcine heme oxygenase and its expression in Escherichia coli. Biochem Int. 1992;28:887–893. [PubMed] [Google Scholar]
- Terry MJ, Linley PJ, Kohchi T. Making light of it: the role of plant heme oxygenases in phytochrome chromophore synthesis. Biochem Soc Trans. 2002;30:604–609. doi: 10.1042/. [DOI] [PubMed] [Google Scholar]
- Terry MJ, McDowell MT, Lagarias JC. (3Z)- and (3E)-phytochromobilin are intermediates in the biosynthesis of the phytochrome chromophore. J Biol Chem. 1995;270:11111–11118. doi: 10.1074/jbc.270.19.11111. [DOI] [PubMed] [Google Scholar]
- Terry MJ, Wahleithner JA, Lagarias JC. Biosynthesis of the plant photoreceptor phytochrome. Arch Biochem Biophys. 1993;306:1–15. doi: 10.1006/abbi.1993.1473. [DOI] [PubMed] [Google Scholar]
- Terry N, Abadía J. Function of iron in chloroplasts. J Plant Nutr. 1986;9:609–646. [Google Scholar]
- Weller JL, Terry MJ, Rameau C, Reid JB, Kendrick RE. The phytochrome-deficient pcd1 mutant of pea is unable to convert heme to biliverdin IXα. Plant Cell. 1996;8:55–67. doi: 10.1105/tpc.8.1.55. [DOI] [PMC free article] [PubMed] [Google Scholar]
- Wilks A, Black SM, Miller WL, Ortiz de Montellano PR. Expression and characterization of truncated human heme oxygenase (hHO-1) and a fusion protein of hHO-1 with human cytochrome P450 reductase. Biochemistry. 1995;34:4421–4427. doi: 10.1021/bi00013a034. [DOI] [PubMed] [Google Scholar]
- Wilks A, Ortiz de Montellano PR. Rat liver heme oxygenase: high level expression of a truncated soluble form and nature of the meso-hydroxylating species. J Biol Chem. 1993;268:22357–22362. [PubMed] [Google Scholar]
- Wilks A, Ortiz de Montellano PR, Sun J, Loehr TM. Heme oxygenase (HO-1): His-132 stabilizes a distal water ligand and assists catalysis. Biochemistry. 1996;35:930–936. doi: 10.1021/bi952405f. [DOI] [PubMed] [Google Scholar]
- Wilks A, Schmitt MP. Expression and characterization of a heme oxygenase (HmuO) from Corynebacterium diphtherae. J Biol Chem. 1998;273:837–841. doi: 10.1074/jbc.273.2.837. [DOI] [PubMed] [Google Scholar]
- Yoshida T, Kikuchi G. Purification and properties of heme oxygenase from pig spleen microsomes. J Biol Chem. 1978a;253:4224–4229. [PubMed] [Google Scholar]
- Yoshida T, Kikuchi G. Features of the reaction of heme degradation catalyzed by the reconstituted microsomal heme oxygenase system. J Biol Chem. 1978b;253:4230–4236. [PubMed] [Google Scholar]
- Zhu W, Wilks A, Stojiljkovic I. Degradation of heme in gram-negative bacteria: The product of the hemO gene of Neisseriae is a heme oxygenase. J Bacteriol. 2000;182:6783–6790. doi: 10.1128/jb.182.23.6783-6790.2000. [DOI] [PMC free article] [PubMed] [Google Scholar]


