Abstract
The cyanobacterium Synechocystis sp. PCC 6803 accumulates the compatible solute glucosylglycerol (GG) and sucrose under salt stress. Although the molecular mechanisms for GG synthesis including regulation of the GG-phosphate synthase (ggpS) gene, which encodes GgpS, has been intensively investigated, the role of GG in protection against salt stress remains poorly understood. In our study of the role of GG in the tolerance to salt stress, we found that salt stress due to 450 mm NaCl inhibited cell division and significantly increased cell size in ΔggpS mutant cells, whereas the inhibition of cell division and increase in cell size were observed in wild-type cells at high concentrations of NaCl, such as 800 mm. Electron microscopy revealed that, in ΔggpS cells, separation of daughter cells was incomplete, and aborted division could be recognized by the presence of a structure that resembled a division ring. The addition of GG to the culture medium protected ΔggpS cells against salt stress and reversed the adverse effects of NaCl on cell division and cell size. These observations suggest that GG is important for salt tolerance and thus for the proper division of cells under salt stress conditions.
When a bacterium, such as Escherichia coli, is exposed to a sudden increase in the external concentration of NaCl, three major events occur. The first event is the rapid influx of Na+ and Cl− ions into the cytoplasm (Koch, 1984; Csonka, 1989); the second is the removal of Na+ ions via the actions of Na+/H+ antiporters and the exchange of Na+ for K+ ions (Goldberg et al., 1987; Pinner et al., 1992; Ivey et al., 1993); and the third is the accumulation of compatible solutes, such as trehalose and Gly betaine, as a result of synthesis de novo or uptake (Vijaranakul et al., 1995; Kempf and Bremer, 1998; Record et al., 1998). These responses enable cells to exclude toxic cations and to acclimate to high concentrations of salt in the growth medium.
Cyanobacteria are prokaryotic microorganisms that perform oxygenic photosynthesis (Pfenning, 1978). Upon an upward shift in the concentration of NaCl in the medium, cells of Synechocystis sp. PCC 6803 accumulate glucosylglycerol (GG) as a major compatible solute and transiently accumulate traces of Suc, which enable cells to tolerate as much as 1.2 m NaCl (Reed and Stewart, 1985). Synechocystis sp. PCC 6803 cells synthesize GG-phosphate from ADP-Glc and glycerol 3-phosphate in a reaction catalyzed by GG-phosphate synthase (GgpS), and they dephosphorylate the intermediate GG-phosphate to yield GG in a reaction catalyzed by GG-phosphate phosphatase (Hagemann and Erdmann, 1994). GgpS and GG-phosphate phosphatase are encoded by the ggpS and stpA genes, respectively (Hagemann et al., 1997b; Marin et al., 1998). The ggpS gene has been cloned, and ΔggpS mutant cells, which are defective in the ggpS gene, have been generated (Marin et al., 1998; Hagemann et al., 2001). ΔggpS cells are sensitive to salt stress, and their tolerance threshold is below 0.3 m NaCl in liquid medium (Marin et al., 1998) and 0.425 m on agar plates (Karandashova et al., 2002). Wild-type cells can also take up GG from the medium via an ABC-type transport system, which is encoded by the ggtA gene and the ggtBCD gene cluster (Mikkat et al., 1996, 1997; Hagemann et al., 1997a; Mikkat and Hagemann, 2000). In an earlier study by DNA microarray analysis, we demonstrated that an increase in the concentration of NaCl to 0.5 m alters the expression of 375 genes, which include the ggpS gene (Kanesaki et al., 2002). The level of ggpS mRNA increases more than 10-fold during incubation in 0.5 m NaCl for 30 min.
In this study, we found that ΔggpS cells were unable to divide when subjected to 450 mm NaCl stress. Furthermore, these cells almost doubled in diameter. Addition of GG to the growth medium reversed the effects of NaCl on both cell size and cell division. Our results suggest that salt stress inhibits cell division and that GG is crucial for successful cell division by Synechocystis sp. PCC 6803 under salt stress.
RESULTS
Growth of Wild-Type and ΔggpS Cells under Salt Stress Conditions
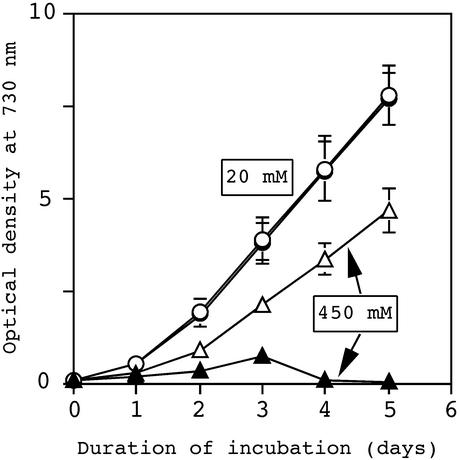
We examined the effects of several different concentrations of NaCl (200–800 mm) in our investigations of the tolerance of wild-type and ΔggpS mutant cells to salt stress. When the concentration of NaCl was lower than 300 mm, ΔggpS cells were able to grow similarly to wild-type cells (data not shown). However, the growth of ΔggpS cells in the presence of 450 mm NaCl was markedly retarded (Fig. 1), and at 500 mm NaCl, ΔggpS cells did not grow at all (data not shown). By contrast, the growth of wild-type cells was not significantly affected at 450 mm NaCl (Fig. 1), but was seriously retarded at ≥800 mm NaCl (data not shown).
Figure 1.
Effects of 450 mm NaCl on the growth of wild-type and ΔggpS cells. Cells that had been grown under normal conditions in BG-11 medium that contained 20 mm NaCl were seeded at an A730 of 0.1 in BG-11 medium (abbreviated as 20 mm NaCl) or in BG-11 medium that had been supplemented with NaCl to a final concentration of 450 mm NaCl (abbreviated as 450 mm NaCl). Growth was monitored in terms of A730. Graphs show growth of wild-type (○) and ΔggpS mutant (●) cells in 20 mm NaCl and growth of wild-type (▵) and ΔggpS (▴) cells in the presence of 450 mm NaCl. Data and error bars were calculated from the results of at least five independent experiments.
Effects of Salt Stress on the Size of Cells
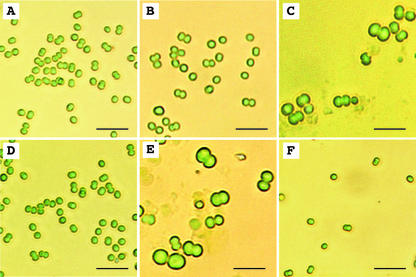
We examined the changes in shape of wild-type and ΔggpS cells during incubation with 450 mm NaCl by optical microscopy (Fig. 2), and we detected no significant changes in the size of wild-type cells during incubation with 450 mm NaCl (Fig. 2, A and B). However, a significant increase in the diameter of wild-type cells was observed at 800 mm NaCl (Fig. 2C). On the other hand, the diameter of ΔggpS cells almost doubled during incubation for 3 d in medium supplemented with 450 mm NaCl (Fig. 2, D and E). Furthermore, after 3 d, all of the ΔggpS cells seemed to be in the process of dividing. These observations suggested that the increase in cell size might have been caused by inhibition of cell division. Salt stress due to 800 mm NaCl totally inhibited the growth of ΔggpS cells (Fig. 2F). Therefore, to investigate the protection of ΔggpS cells by GG, we used 450 mm NaCl as the salt stress in our subsequent experiments.
Figure 2.
Effects of NaCl on the size of Synechocystis sp. PCC 6803 cells. Wild-type and ΔggpS cells that had been grown in 20 mm NaCl were cultured in the presence of 20, 450, or 800 mm NaCl for 3 d. The other experimental conditions were the same as those described in the legend to Figure 1. Light micrographs show wild-type cells in 20 mm NaCl (A), wild-type cells in 450 mm NaCl (B), wild-type cells in 800 mm NaCl (C), ΔggpS cells in 20 mm NaCl (D), ΔggpS cells in 450 mm NaCl (E), and ΔggpS cells in 800 mm NaCl (F). Bars = 10 μm.
Effect of Salt Stress on Cell Density of Cultures
Flow cytometry analysis revealed that the cell density of culture of ΔggpS cells did not increase during a 3-d incubation in the presence of 450 mm NaCl (Table I). This result confirmed that ΔggpS cells were unable to divide under salt stress due to 450 mm NaCl. After more than 3 d, the cell density of the culture decreased rapidly (Table I, fifth column), suggesting that most of the ΔggpS cells lysed.
Table I.
Effects of exogenous GG on the cell count of ΔggpS cells under salt stress
| Days of Incubation | Cell Count of ΔggpS Cells
|
||||
|---|---|---|---|---|---|
| 20 mm NaCl 450 mm NaCl | |||||
| No GG | 1 mm GG Added after
|
No GG | |||
| 1 d | 2 d | 3 d | |||
| 107 mL−1 | |||||
| 0 | 0.80 ± 0.10 | 0.81 ± 0.08 | 0.80 ± 0.08 | 0.79 ± 0.05 | 0.80 ± 0.03 |
| 1 | 3.76 ± 0.12 | 0.87 ± 0.04 | 0.82 ± 0.05 | 0.78 ± 0.04 | 0.79 ± 0.03 |
| 2 | 13.44 ± 1.31 | 1.10 ± 0.11 | 0.90 ± 0.11 | 0.83 ± 0.03 | 0.82 ± 0.02 |
| 3 | 22.48 ± 2.11 | 3.03 ± 0.01 | 1.82 ± 0.01 | 1.00 ± 0.02 | 0.92 ± 0.03 |
| 4 | 29.53 ± 2.54 | 7.85 ± 0.33 | 6.11 ± 0.13 | 0.17 ± 0.30 | 0.055 ± 0.008 |
| 5 | 37.92 ± 2.75 | 11.0 ± 0.10 | 9.17 ± 0.14 | 0.62 ± 0.05 | 0.016 ± 0.009 |
ΔggpS cells that had been grown with 20 mm NaCl were cultured with 20 or 450 mm NaCl in the absence or presence of 1 mm GG that was added to the medium 1, 2, or 3 d after the start of salt stress. Means and sds were calculated from the results of three independent experiments.
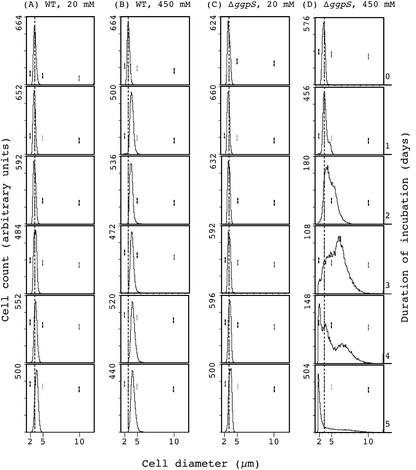
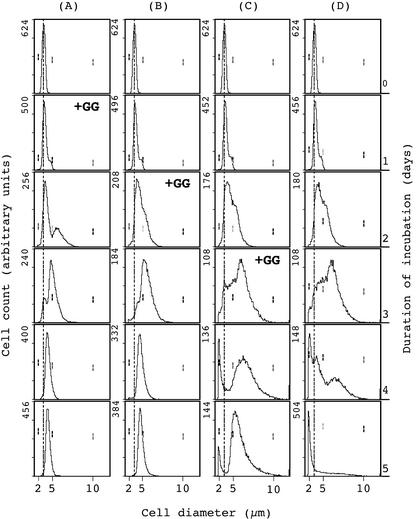
We also examined the distribution of cell size by flow cytometry (Fig. 3). Whereas the size of wild-type cells increased slightly during incubation with 450 mm NaCl (Fig. 3, A and B), the size of ΔggpS cells increased gradually, and the apparent diameter had approximately doubled at 3 d (Fig. 3, C and D). These observations suggest that 450 mm NaCl arrested cell division, with significant resultant enlargement of ΔggpS cells. It is noticeable that the increase in cell size of ΔggpS cells represented an increase in average cell diameter plus the formation of cell duplets.
Figure 3.
Effects of 450 mm NaCl on the distribution of the sizes of Synechocystis sp. PCC 6803 cells, as determined by flow cytometry. Wild-type and ΔggpS cells that had been grown with 20 mm NaCl were cultured in the presence of 20 or 450 mm NaCl. Aliquots of both types of cell were withdrawn, and the distribution of cell sizes was analyzed by flow cytometry after appropriate dilutions. A, Wild-type cells in 20 mm NaCl; B, wild-type cells in 450 mm NaCl; C, ΔggpS cells in 20 mm NaCl; and D, ΔggpS cells in 450 mm NaCl. Arbitrary scales have been used to provide a better view of the distribution of cell sizes. Numbers in the top left part of plots represent the cell count of each plot but do not have a quantitative meaning for the cell density of cultures during the 5-d time course. Vertical dashed lines represent the initial sizes of wild-type and ΔggpS cells before salt stress. The three pairs of vertical dashes represent the positions of size markers with diameters of 2, 5, and 10 μm.
Ionic stress due to NaCl disturbs ion homeostasis but NaCl also has an osmotic effect (Hagemann and Erdmann, 1997; Hayashi and Murata, 1998). Therefore, we attempted to examine the effects of osmotic stress on the growth, division, and size of Synechocystis sp. PCC 6803 cells. Osmotic stress due to 900 mm sorbitol, which has approximately the same osmotic effect as 450 mm NaCl, arrested the growth of both wild-type and ΔggpS mutant cells, which was measured by A730. In addition, the cell density of cultures of wild-type and ΔggpS cells, as determined by flow cytometry, did not increase in response to 900 mm sorbitol, suggesting that cell division was inhibited. However, whereas 450 mm NaCl caused a clear increase in the size of ΔggpS cells, we observed a slight decrease (about 10%∼20%) in the size of wild-type and ΔggpS cells when they were incubated with 900 mm sorbitol when we examined cells by optical microscopy and by flow cytometry.
Effects of Salt Stress on the Ultrastructure of Synechocystis Cells
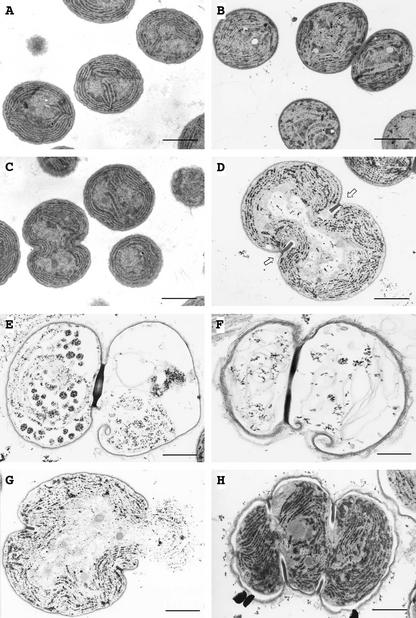
To clarify the effects of salt stress in greater detail, we examined the ultrastructure of cells by transmission electron microscopy. The size and the ultrastructure of wild-type cells were not significantly affected by salt stress (Fig. 4, A and B). However, after incubation for 3 d in the presence of 450 mm NaCl, ΔggpS cells were much larger than wild-type cells, and a structure that resembled a division ring was visible at the equator of cells (Fig. 4, C and D). Moreover, the presence of division ring-like structures, as shown in Figure 4D, suggested that NaCl might specifically inhibit the cell division machinery in ΔggpS cells.
Figure 4.
Effects of 450 mm NaCl on the ultrastructure of wild-type and ΔggpS cells of Synechocystis sp. PCC 6803, as examined by electron microscopy. Wild-type and ΔggpS cells that had been grown with 20 mm NaCl were cultured in the presence of 20 or 450 mm NaCl. A, Wild-type cells in 20 mm NaCl for 3 d; B, wild-type cells in 450 mm NaCl for 3 d; C, ΔggpS cells in 20 mm NaCl for 3 d; and D, ΔggpS cells in 450 mm NaCl for 3 d. Arrows in D indicate a division ring-like structure at the cell's equator. E through H, ΔggpS cells in 450 mm NaCl for 4 d. Bars = 1 μm.
We next examined ΔggpS cells that had been incubated with 450 mm NaCl for 4 d. Figure 4, E and F, shows that ΔggpS cells were unable to complete cell division and lysed, leaving a division ring that adhered closely to the cell envelope. Figure 4G shows a cell that appears to have burst during preparation for electron microscopy. Figure 4H shows a triplet with an unusual division pattern, demonstrating again the dramatic effects of NaCl on the cell division machinery.
Effects of Salt Stress on Levels of Proteins, DNA, and Chlorophyll in ΔggpS Cells
To determine the effects of salt stress on the biosynthesis of proteins, DNA, and chlorophyll, we examined the levels of these macromolecules during incubation with 450 mm NaCl. The results in Table II show that in 20 mm NaCl, levels of these macromolecules in ΔggpS cells remained almost constant during incubation for 3 d. However, when ΔggpS cells were incubated in 450 mm NaCl, levels of proteins, DNA, and chlorophyll per cell increased approximately 7-, 4-, and 4-fold, respectively (Table II). Under salt-stress conditions, ΔggpS cells almost doubled in diameter, an increase that is equivalent to an approximately 8-fold increase in cell volume. Taken together, the results suggest that the concentration of proteins in each cell remained almost constant, whereas concentrations of DNA and chlorophyll were reduced to about 50% under salt stress (Table II). It is noteworthy that the amount of DNA in each cell increased only 4-fold during incubation with 450 mm NaCl for 3 d, whereas the level of proteins increased in parallel with the increase in cell volume. Thus, although NaCl totally arrested the division of ΔggpS cells, the biosynthesis of proteins, DNA, and chlorophyll was not totally inhibited.
Table II.
Effects of 450 mm NaCl on levels of proteins, DNA, and chlorophyll in ΔggpS cells
| Days of Incubation | Proteins
|
DNA
|
Chlorophyll
|
|||
|---|---|---|---|---|---|---|
| 20 mm | 450 mm | 20 mm | 450 mm | 20 mm | 450 mm | |
| μg 10−7 cells | ||||||
| 0 | 0.98 ± 0.10 (1.00)a | 0.98 ± 0.10 (1.00) | 1.21 ± 0.30 (1.00) | 1.33 ± 0.19 (1.00) | 0.48 ± 0.02 (1.00) | 0.48 ± 0.02 (1.00) |
| 1 | 1.25 ± 0.18 (1.27) | 1.42 ± 0.08 (1.44) | 1.36 ± 0.52 (1.12) | 1.61 ± 0.40 (1.21) | 0.44 ± 0.03 (0.91) | 0.47 ± 0.08 (0.97) |
| 2 | 1.73 ± 0.08 (1.76) | 1.83 ± 0.13 (1.86) | 1.15 ± 0.50 (0.95) | 3.08 ± 0.22 (2.31) | 0.44 ± 0.04 (0.91) | 0.79 ± 0.05 (1.64) |
| 3 | 1.34 ± 0.14 (1.36) | 6.96 ± 1.31 (7.10) | 1.32 ± 0.47 (1.09) | 5.71 ± 0.50 (4.29) | 0.55 ± 0.05 (1.14) | 2.16 ± 0.02 (4.50) |
ΔggpS cells that had been grown with 20 mm NaCl were cultured with 20 or 450 mm NaCl for 3 d. Aliquots of cultures were withdrawn at designated times, and levels of proteins, DNA, and chlorophyll were determined. Means and sds were calculated from the results of three independent experiments.
Numbers in parentheses indicate increases relative to d 0.
Accumulation of GG and Suc under Salt Stress
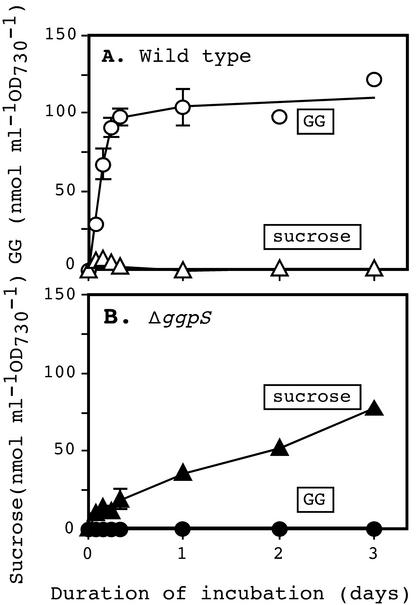
Synechocystis sp. PCC 6803 cells accumulate GG and Suc in response to salt stress (Reed and Stewart, 1985; Marin et al., 1998; Hagemann and Marin, 1999). We examined the effects of the mutation in ΔggpS cells on levels of GG and Suc during incubation in 450 mm NaCl. Figure 5A shows that the concentration of GG reached a maximum in wild-type cells 8 h after the onset of salt stress and remained constant thereafter. However, Suc accumulated transiently and at only a low level and had almost disappeared within 10 h. By contrast, ΔggpS cells were unable to accumulate GG but synthesized and accumulated a much higher level of Suc than wild-type cells (Fig. 5B).
Figure 5.
Effects of 450 mm NaCl on levels of GG and Suc in wild-type and ΔggpS cells. Wild-type and ΔggpS cells that had been grown in the presence of 20 mm NaCl were transferred to medium that contained 450 mm NaCl. A, Levels of GG (○) and Suc (▵) in wild-type cells. B, Levels of GG (●) and Suc (▴) in ΔggpS cells.
Effects of Exogenous GG on Cell Division
Although ΔggpS cells are unable to synthesize GG in response to salt stress, they are capable in taking up GG from the medium via an ABC-type transport system, which is encoded by the ggtA and ggtBCD gene cluster (Mikkat et al., 1996, 1997; Hagemann et al., 1997a; Mikkat and Hagemann, 2000). Thus, we examined the effect of exogenously supplemented GG on both cell size and cell count of ΔggpS cells.
Flow-cytometric analysis revealed that exogenously supplied GG at 1 mm reversed the effects of 450 mm NaCl on cell size (Fig. 6) and cell count (Table I). Figure 6D shows the distribution of ΔggpS cells incubated with 450 mm NaCl for 5 d. When GG was added to the medium 24 and 48 h after the onset of salt stress, cells decreased significantly in size over the course of the next few days (Fig. 6, A and B). GG also increased cell count for as long as 5 d (Table I), and the results suggested that GG accelerated cell division and prevented cell lysis. However, when added at 3 d after the onset of salt stress, GG was only partially effective (Fig. 6C; Table I). Nonetheless, even in this case, cell lysis was somewhat retarded and ΔggpS cells began to grow again 2 d after the addition of GG to the medium (Table I). Finally, we found that the presence of GG during incubation of wild-type cells with 450 mm NaCl had no effect at all.
Figure 6.
Effects of exogenous GG on the distribution of sizes of ΔggpS mutant cells, as determined by flow cytometry. ΔggpS cells that had been grown with 20 mm NaCl were cultured with 450 mm NaCl in the presence of exogenous GG, which was added to independent cultures 1 d (A), 2 d (B), or 3 d (C) after the onset of salt stress, or in the absence of GG (D). The sizes of cells were analyzed by flow cytometry, as described in the legend to Figure 3. Numbers in the top left part of plots represent the cell count of each plot but do not have a quantitative meaning for the cell density of cultures during the 5-d time course. Vertical dashed lines represent initial sizes of ΔggpS cells before the onset of salt stress. The three pairs of vertical dashes represent the positions of size markers of 2, 5, and 10 μm in diameter.
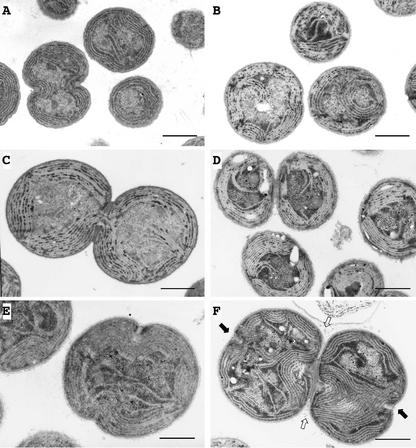
We also examined the effects of exogenous GG on ΔggpS cells by electron microscopy. When GG was added simultaneously with exposure of cells to salt stress (450 mm), the size and ultrastructure of ΔggpS cells were unaffected (Fig. 7, A and B). These results suggested that the uptake of exogenous GG counteracted the effects of salt stress. Figure 7C shows that incubation with 450 mm NaCl for 48 h caused a significant increase in the size of ΔggpS cells as compared with ΔggpS cells that had been grown in the presence of 20 mm NaCl (see Fig. 7A). After addition of GG to medium that contained 450 mm NaCl for 2 d, cell size decreased significantly (Fig. 7D), suggesting that cell division resumed. This observation was in good agreement with the effect of exogenous GG on cell size, as determined by flow cytometry (Fig. 6; Table I). Finally, upon addition of GG to a culture of ΔggpS cells that had been incubated with 450 mm NaCl for 3 d, we observed very large tetrads (Fig. 7, E and F). Although most cells lysed subsequently, cell lysis was retarded by the addition of GG, and tetrads might have represented an intermediate stage before the reinitiation of cell division.
Figure 7.
Effects of exogenous GG on the ultrastructure of ΔggpS cells cultured with 450 mm NaCl. ΔggpS cells that had been grown with 20 mm NaCl were incubated for 3 d with 20 mm NaCl (A) or with 450 mm NaCl plus 1 mm GG (B). ΔggpS cells that had been cultured for 2 d with 450 mm NaCl (C) were cultured for 2 d further in the presence of 1 mm GG (D). ΔggpS cells that had been cultured for 3 d with 450 mm NaCl (E) were cultured for a further 2 d in the presence of 1 mm GG (F). White arrows indicate the first septation site, and black arrows indicate the starting positions of the second septation site. Bars = 1 μm.
DISCUSSION
Inhibition of Cell Division and Induction of Cell Lysis by Salt Stress
In wild-type cells, cell division and cell size were unaffected by NaCl at 450 mm, which completely inhibited cell division of ΔggpS cells (Fig. 2, B and E). However, at high concentrations of NaCl, such as 800 mm, cell division was impaired, and the apparent cell size significantly increased in wild-type cells (Fig. 2C), which synthesize GG at about 110 mg mL−1 (Ritchie and Islam, 2001; Marin et al., 2002). These observations suggest that the high concentrations of NaCl inhibit cell division without significantly affecting cell growth in wild-type cells.
We found that ΔggpS mutant cells, which were unable to synthesize GG, were sensitive to salt stress due to 450 mm NaCl. At this concentration, NaCl arrested cell division but did not inhibit cell growth. As a result, ΔggpS cells increased significantly in size. After 3 d of salt stress, cells started to lyse. Osmotic stress due to 900 mm sorbitol also prevented cell division by inhibiting cell growth but not inducing cell lysis. Thus, salt stress and osmotic stress had different effects on the proliferation of ΔggpS cells of Synechocystis sp. PCC 6803. In a previous study, our DNA microarray analysis indicated that salt stress and osmotic stress are recognized by Synechocystis sp. PCC 6803 as different stimuli and induce the regulation of expression of different sets of genes (Kanesaki et al., 2002).
To date, little attention has been paid to the morphological changes that occur in Synechocystis sp. PCC 6803 cells under stress conditions. After careful examination of cellular ultrastructure, we identified previously unreported structures that we named “division ring-like structures,” the formation of which was specifically induced by salt stress (Fig. 4).
Although we have no direct experimental evidence for a specific mechanism of cell lysis, it is possible that NaCl might somehow change the structure of peptidoglycans. In fact, 2.5 m NaCl shortened peptidoglycan interpeptide bridge of Staphylococcus aureus (Vijaranakul et al., 1995). However, because after 3 d of salt stress, ΔggpS cells had dramatically increased in size (Figs. 2E and 3D), it is likely that the lysis of ΔggpS cells might be attributable in part to weakened cell walls and the swelling of ΔggpS cells that was induced by salt stress.
Bacterial cells usually divide by generating a central septum across the middle of the mother cell (for reviews, see Bramhill, 1997; Rothfield et al., 1999). Recent studies indicate that the assembly of a fairly complicated protein complex is required at the site of division for orchestration of the division into daughter cells. Several of our electron micrographs revealed the formation of incomplete septa (Fig. 4), suggesting that NaCl might arrest the formation of the septum and the separation of daughter cells. It is also likely that the high concentration (450 mm) of NaCl inhibited the correct assembly of such a protein complex, thereby inhibiting cell division.
The results of flow cytometry demonstrated clearly that ΔggpS cells under salt stress were highly heterogeneous with respect to size, ranging from 2 to 10 μm in diameter (Fig. 3D). Because we used non-synchronized cultures of ΔggpS cells, this heterogeneity might have been due to differential effects of NaCl on cells at different stages of the cell cycle. It will be of interest to identify the stage in the cell cycle at which stress exerts its effects.
GG Counteracts the Effects of Salt Stress
Ionic homeostasis within cells is disturbed by salt stress and such stress may be ultimately toxic. Upon exposure to salt stress, Synechocystis sp. PCC 6803 synthesizes GG, which reaches a maximal level within 8 h (Marin et al., 1998, 2002; Fig. 5). This rapid response to NaCl stress in combination with the exclusion of Na+ ions by Na+/H+ antiporters (Inaba et al., 2001; Elanskaya et al., 2002) protects wild-type cells from the toxic effects of excess Na+ ions. Thus, wild-type cells are able to proliferate in the presence of high concentrations of NaCl (Reed and Stewart, 1985). However, the ΔggpS null mutant lacked this acclimative response to NaCl stress. The negative effects of NaCl on several metabolic pathways, including photosynthesis (Marin et al., 1998; Allakhverdiev et al., 2002), are much more serious in ΔggpS cells than in wild-type cells.
The structural aberrations and morphological abnormalities induced by NaCl stress (Figs. 2 and 4) were efficiently reversed by the addition of GG to the growth medium (Fig. 7). In ΔggpS cells, GG had an “anti-NaCl effect,” returning cell size to close to normal and stimulating both normal cell growth and cell division (Figs. 6 and 7; Table I). The mechanism(s) whereby GG sustains cell division and regulates cell size remains to be elucidated.
The timing of inclusion of GG in the growth medium after the onset of salt stress was also critical in the protection of ΔggpS cells (Figs. 6 and 7), suggesting that GG is able to rescue Synechocystis sp. PCC 6803 until a certain amount of NaCl-induced damage has occurred. However, when most cell functions have been seriously damaged after a long incubation with NaCl, GG can no longer efficiently reverse the damage caused by NaCl.
The effects of salt stress on cell size and cell division of the halotolerant bacterium S. aureus was investigated in detail (Vijaranakul et al., 1995, 1997). Salt shock due to 2.5 m NaCl increased the cell size and inhibited separation of daughter cells. The addition of Gly betaine to the culture medium alleviated the adverse effects of salt stress by reducing cell size and accelerating cell division. These effects of Gly betaine on cell size and cell division are similar to that of GG in Synechocystis sp. PCC 6803 cells, as described herein. Thus, GG and Gly betaine might have similar effects on the regulation of cell size and might play similar roles in the protection of cell division. However, such does not seem to be the case for all compatible solutes. Thus, despite the high concentration of Suc accumulated in ΔggpS cells under salt stress (Fig. 5), protection from salt stress was insufficient. These observations demonstrate a qualitative difference between the protective effects of Suc and those of GG and suggest that these compounds play different roles in protection against salt stress.
MATERIALS AND METHODS
Growth Conditions and Salt Stress
A Glc-tolerant strain of Synechocystis sp. PCC 6803 was kindly provided by Dr. J.G.K. Williams (DuPont de Nemours and Co., Wilmington, DE). The ΔggpS mutant (previously designated ΔGK2) was produced as described previously (Marin et al., 1998). Wild-type and ΔggpS mutant strains were cultured at 34°C in BG-11 medium (Stanier et al., 1971), buffered with 20 mm HEPES-NaOH (pH 7.6), which contained 20 mm NaCl. Cell cultures were bubbled with air containing 1% (v/v) CO2 and under constant illumination at 70 μE m−2 s−1 from incandescent lamps (Ono and Murata, 1981).
Salt stress was applied by adding an appropriate volume of a stock solution of 5 m NaCl to cultures to give a final concentration of 450 mm. Growth of cells was monitored by measuring changes in A730 using a spectrophotometer (model 200–20, Hitachi, Tokyo) after suitable dilution of aliquots from cell cultures.
Optical and Electron Microscopy
Optical microscopy was performed with a microscope (Axioskop FL, Carl Zeiss, Gottingen, Germany) that was equipped with a high-definition image-capture camera (model HC-1000, Fujix, Tokyo).
For electron microscopy, cells were pelleted by centrifugation at 3,000g for 5 min and then immediately fixed for 1 h with 2% (v/v) glutaraldehyde in 100 mm sodium phosphate (pH 7.2). After rinsing overnight in sodium phosphate buffer, samples were post-fixed in 1% (v/v) osmium tetroxide for 1 h before dehydration by passage through a graded ethanol series (50%–100%, v/v). Then samples were infiltrated with and embedded in resin (Araldite CY-212, Ouken, Tokyo). Thin sections were mounted on copper grids, stained with uranyl acetate, and examined under an electron microscope (model 1200EX, JEOL, Tokyo).
Flow Cytometry
For flow cytometry, aliquots of culture (1 mL) were withdrawn at 24-h intervals. Samples were analyzed with a flow cytometer (EPICS XL, Beckman Coulter, Miami). As size standards, we used 2-, 5-, and 10-μm polystyrene latex beads (Beckman Coulter), and excitation at 488 nm was provided by an argon-ion laser. For the determination of cell density of cultures, count fluorospheres (Beckman Coulter) were mixed with samples (1:1, v/v), and the system was programmed to stop the cell count at 30,000. All data were collected and analyzed with the cytometer's software (v3.0 EPICS XL System II, Beckman Coulter).
Quantitation of GG and Suc
Aliquots (4 mL) were withdrawn from cultures (A730 = 0.6) and cells were collected by centrifugation at 3,000g for 10 min at 4°C. Absolute ethanol (1 mL) was added to each pellet, and tubes were shaken vigorously for extraction of sugars. The ethanol was then evaporated on a centrifugal concentrator (model CC-101, Tomy, Tokyo). Dried pellets were suspended in distilled water. Sugars, amino acids, and organic acids were separated, and the sugar fraction was analyzed by gas chromatography, as described previously by Adams et al. (1999). Minor modifications and additions to the protocol were made to improve the separation of the various sugars.
Quantitation of Total Proteins, DNA, and Chlorophyll
For quantitation of proteins, 1 mL of cell suspension was supplemented with 0.1 g of trichloroacetic acid, and then the precipitate was collected by centrifugation at 15,000g for 10 min at 4°C. The pellet was suspended in 1 n NaOH. The suspension was boiled for 30 min, cooled, and then centrifuged at 15,000g for 5 min. The protein in the supernatant was quantitated as described by Lowry et al. (1951) with bovine serum albumin as the standard.
Concentrations of DNA were estimated as described by Labarca and Paigen (1980). For the quantitation of chlorophyll, cells in 1 mL of culture were collected by centrifugation at 15,000g for 10 min at 4°C. Pigments were extracted by suspending cells in 1 mL of a mixture of methanol:water (9:1, v/v). After removal of the precipitate by centrifugation at 15,000g for 5 min, chlorophyll in the supernatant was quantified in terms of A665 (Talling and Driver, 1961; Porra, 1991).
ACKNOWLEDGMENT
We acknowledge the excellent assistance of Shigemi Takami (National Institute for Basic Biology Center for Analytical Instruments) in the analyses by flow cytometry.
Footnotes
This work was supported in part by the Ministry of Education, Science and Culture, Japan (Grants-in-Aid for Scientific Research [S] nos. 13854002 to N.M. and I.S. and for Scientific Research on Priority Area no. 14086207 to N.M.) and by the Cooperative Research Program of the National Institute for Basic Biology on the Stress Tolerance of Plants. R.S. was the recipient of a postdoctoral fellowship for foreign researchers from the Japanese Society for the Promotion of Science (no. P–01108).
Article, publication date, and citation information can be found at www.plantphysiol.org/cgi/doi/10.1104/pp.102.017277.
LITERATURE CITED
- Adams MA, Chen Z, Landman P, Colmer TD. Simultaneous determination by capillary gas chromatography of organic acids, sugars, and sugar alcohols in plant tissue extracts as their trimethylsilyl derivatives. Anal Biochem. 1999;266:77–84. doi: 10.1006/abio.1998.2906. [DOI] [PubMed] [Google Scholar]
- Allakhverdiev SI, Nishiyama Y, Miyairi S, Yamamoto H, Inagaki N, Murata N. Salt stress inhibits the repair of photodamaged photosystem II by suppressing the transcription and translation of psbA genes in Synechocystis. Plant Physiol. 2002;130:1–12. doi: 10.1104/pp.011114. [DOI] [PMC free article] [PubMed] [Google Scholar]
- Bramhill D. Bacterial cell division. Annu Rev Cell Dev Biol. 1997;13:395–424. doi: 10.1146/annurev.cellbio.13.1.395. [DOI] [PubMed] [Google Scholar]
- Csonka LN. Physiological and genetic responses of bacteria to osmotic stress. Microbiol Rev. 1989;53:121–147. doi: 10.1128/mr.53.1.121-147.1989. [DOI] [PMC free article] [PubMed] [Google Scholar]
- Elanskaya IV, Karandashova IV, Bogachev AV, Hagemann M. Functional analysis of the Na+/H+ antiporter encoding genes of the cyanobacterium Synechocystis PCC 6803. Biochemistry. 2002;67:432–440. doi: 10.1023/a:1015281906254. [DOI] [PubMed] [Google Scholar]
- Goldberg EB, Arbel T, Chen J, Karpel R, Mackie GA, Schuldiner S, Padan E. Characterization of a Na+/H+ antiporter gene of Escherichia coli. Proc Natl Acad Sci USA. 1987;84:2615–2619. doi: 10.1073/pnas.84.9.2615. [DOI] [PMC free article] [PubMed] [Google Scholar]
- Hagemann M, Effmert U, Kerstan T, Schoor A, Erdmann N. Biochemical characterization of glucosylglycerol-phosphate synthase of Synechocystis sp. strain PCC 6803: comparison of crude, purified, and recombinant enzymes. Curr Microbiol. 2001;43:278–283. doi: 10.1007/s002840010301. [DOI] [PubMed] [Google Scholar]
- Hagemann M, Erdmann N. Activation and pathway of glucosylglycerol synthesis in the cyanobacterium Synechocystis sp. PCC 6803. Microbiology. 1994;140:1427–1431. [Google Scholar]
- Hagemann M, Erdmann N. Environmental stresses. In: Rai AK, editor. Cyanobacterial Nitrogen Metabolism and Environmental Biotechnology. Heidelberg: Springer-Verlag; 1997. pp. 156–221. [Google Scholar]
- Hagemann M, Marin K. Salt-induced sucrose accumulation is mediated by sucrose-phosphate-synthase in cyanobacteria. J Plant Physiol. 1999;155:424–430. [Google Scholar]
- Hagemann M, Richter S, Mikkat S. The ggtA gene encodes a subunit of the transport system for the osmoprotective compound glucosylglycerol in Synechocystis sp. strain PCC 6803. J Bacteriol. 1997a;179:714–720. doi: 10.1128/jb.179.3.714-720.1997. [DOI] [PMC free article] [PubMed] [Google Scholar]
- Hagemann M, Schoor A, Jeanjean R, Zuther E, Joset F. The stpA gene from Synechocystis sp. strain PCC 6803 encodes the glucosylglycerol-phosphate phosphatase involved in cyanobacterial osmotic response to salt shock. J Bacteriol. 1997b;179:1727–1733. doi: 10.1128/jb.179.5.1727-1733.1997. [DOI] [PMC free article] [PubMed] [Google Scholar]
- Hayashi H, Murata N. Genetically engineered enhancement of salt tolerance in higher plants. In: Sato K, Murata N, editors. Stress Responses of Photosynthetic Organisms: Molecular Mechanisms and Molecular Regulation. Amsterdam: Elsevier; 1998. pp. 133–148. [Google Scholar]
- Inaba M, Sakamoto A, Murata N. Functional expression in Escherichia coli of low-affinity and high-affinity Na+(Li+)/H+ antiporters of Synechocystis. J Bacteriol. 2001;183:1376–1384. doi: 10.1128/JB.183.4.1376-1384.2001. [DOI] [PMC free article] [PubMed] [Google Scholar]
- Ivey DM, Guffanti AA, Zemsky J, Pinner E, Karpel R, Padan E, Schuldiner S, Krulwich TA. Cloning and characterization of a putative Ca2+/H+ antiporter gene from Escherichia coli upon functional complementation of Na+/H+ antiporter-deficient strains by the overexpressed gene. J Biol Chem. 1993;268:11296–11303. [PubMed] [Google Scholar]
- Kanesaki Y, Suzuki I, Allakhverdiev SI, Mikami K, Murata N. Salt stress and hyperosmotic stress regulate the expression of different sets of genes in Synechocystis sp. PCC 6803. Biochem Biophys Res Commun. 2002;290:339–348. doi: 10.1006/bbrc.2001.6201. [DOI] [PubMed] [Google Scholar]
- Karandashova I, Elanskaya I, Marin K, Vinnemeier J, Hagemann M. Identification of genes essential for growth at high salt concentrations using salt-sensitive mutants of the cyanobacterium Synechocystis sp. strain PCC 6803. Curr Microbiol. 2002;44:184–188. doi: 10.1007/s00284-001-0035-3. [DOI] [PubMed] [Google Scholar]
- Kempf B, Bremer E. Uptake and synthesis of compatible solutes as microbial stress responses to high-osmolality environments. Arch Microbiol. 1998;170:319–330. doi: 10.1007/s002030050649. [DOI] [PubMed] [Google Scholar]
- Koch AL. Shrinkage of growing Escherichia coli cells by osmotic challenge. J Bacteriol. 1984;159:919–924. doi: 10.1128/jb.159.3.919-924.1984. [DOI] [PMC free article] [PubMed] [Google Scholar]
- Labarca C, Paigen K. A simple, rapid, and sensitive DNA assay procedure. Anal Biochem. 1980;102:344–352. doi: 10.1016/0003-2697(80)90165-7. [DOI] [PubMed] [Google Scholar]
- Lowry OH, Rosebrough NJ, Farr AL, Randall RJ. Protein measurement with the folin phenol reagent. J Biol Chem. 1951;193:265–275. [PubMed] [Google Scholar]
- Marin K, Huckauf J, Fulda S, Hagemann M. Salt-dependent expression of glucosylglycerol-phosphate synthase, involved in osmolyte synthesis in the cyanobacterium Synechocystis sp. strain PCC 6803. J Bacteriol. 2002;184:2870–2877. doi: 10.1128/JB.184.11.2870-2877.2002. [DOI] [PMC free article] [PubMed] [Google Scholar]
- Marin K, Zuther E, Kerstan T, Kunert A, Hagemann M. The ggpS gene from Synechocystis sp. strain PCC 6803 encoding glucosylglycerol-phosphate synthase is involved in osmolyte synthesis. J Bacteriol. 1998;180:4843–4849. doi: 10.1128/jb.180.18.4843-4849.1998. [DOI] [PMC free article] [PubMed] [Google Scholar]
- Mikkat S, Effmert U, Hagemann M. Uptake and use of the osmoprotective compounds trehalose, glucosylglycerol, and sucrose by the cyanobacterium Synechocystis sp. PCC6803. Arch Microbiol. 1997;167:112–118. [PubMed] [Google Scholar]
- Mikkat S, Hagemann M. Molecular analysis of the ggtBCD gene cluster of Synechocystis sp. strain PCC 6803 encoding subunits of an ABC transporter for osmoprotective compounds. Arch Microbiol. 2000;174:273–282. doi: 10.1007/s002030000201. [DOI] [PubMed] [Google Scholar]
- Mikkat S, Hagemann M, Schoor A. Active transport of glucosylglycerol is involved in salt adaptation of the cyanobacterium Synechocystis sp. strain PCC 6803. Microbiology. 1996;142:1725–1732. doi: 10.1099/13500872-142-7-1725. [DOI] [PubMed] [Google Scholar]
- Ono T, Murata N. Chilling susceptibility of the blue-green alga Anacystis nidulans: effect of growth temperature. Plant Physiol. 1981;67:176–182. doi: 10.1104/pp.67.1.176. [DOI] [PMC free article] [PubMed] [Google Scholar]
- Pfenning N. General physiology and ecology of photosynthetic bacteria. In: Clayton RK, Sistrom WR, editors. The Photosynthetic Bacteria. New York: Plenum Press; 1978. pp. 3–18. [Google Scholar]
- Pinner E, Padan E, Schuldiner S. Cloning, sequencing, and expression of the nhaB gene, encoding a Na+/H+ antiporter in Escherichia coli. J Biol Chem. 1992;267:11064–11068. [PubMed] [Google Scholar]
- Porra RJ. Recent advances and reassessments in chlorophyll extraction and assay procedures for terrestrial, aquatic and marine organisms, including recalcitrant algae. In: Sheer H, editor. Chlorophylls. Boca Raton, FL: CRC Press; 1991. pp. 31–57. [Google Scholar]
- Record MT, Jr, Courtenay ES, Cayley DS, Guttman HJ. Responses of E. coli to osmotic stress: large changes in amounts of cytoplasmic solutes and water. Trends Biochem Sci. 1998;23:143–148. doi: 10.1016/s0968-0004(98)01196-7. [DOI] [PubMed] [Google Scholar]
- Reed RH, Stewart WDP. Osmotic adjustment and organic solute accumulation in unicellular cyanobacteria from freshwater and marine habitats. Mar Biol. 1985;88:1–9. [Google Scholar]
- Ritchie RJ, Islam N. Permeability of methylamine across the membrane of a cyanobacterial cell. New Phytol. 2001;152:203–211. [Google Scholar]
- Rothfield L, Justice S, Garcia-Lara J. Bacterial cell division. Annu Rev Genet. 1999;33:423–448. doi: 10.1146/annurev.genet.33.1.423. [DOI] [PubMed] [Google Scholar]
- Stanier RY, Kunisawa R, Mandel M, Cohen-Bazire G. Purification and properties of unicellular blue-green algae (order Chroococcales) Bacteriol Rev. 1971;35:171–205. doi: 10.1128/br.35.2.171-205.1971. [DOI] [PMC free article] [PubMed] [Google Scholar]
- Talling JF, Driver D. Some problems in the extraction of chlorophyll a in phytoplankton biomass. In: Doty M, editor. Primary Productivity Measurement, Marine and Fresh-Water. U.S. Washington, DC: Atomic Energy Engineering Commission; 1961. pp. 142–146. [Google Scholar]
- Vijaranakul U, Nadakavukaren MJ, Bayles DO, Wilkinson BJ, Jayaswal RK. Characterization of an NaCl-sensitive Staphylococcus aureus mutant and rescue of the NaCl-sensitive phenotype by glycine betaine but not by other compatible solutes. Appl Environ Microbiol. 1997;63:1889–1897. doi: 10.1128/aem.63.5.1889-1897.1997. [DOI] [PMC free article] [PubMed] [Google Scholar]
- Vijaranakul U, Nadakavukaren MJ, de Jonge BLM, Wilkinson BJ, Jayaswal RK. Increased cell size and shortened peptidoglycan interpeptide bridge of NaCl-stressed Staphylococcus aureus and their reversal by glycine betaine. J Bacteriol. 1995;177:5116–5121. doi: 10.1128/jb.177.17.5116-5121.1995. [DOI] [PMC free article] [PubMed] [Google Scholar]


