


Abstract
The HIV positive selection mutation database is a large-scale database available at http://www.bioinformatics.ucla.edu/HIV/ that provides detailed selection pressure maps of HIV protease and reverse transcriptase, both of which are molecular targets of antiretroviral therapy. This database makes available for the first time a very large HIV sequence dataset (sequences from ∼50 000 clinical AIDS samples, generously contributed by Specialty Laboratories, Inc.), which makes possible high-resolution selection pressure mapping. It provides information about not only the selection pressure on individual sites but also how selection pressure at one site is affected by mutations on other sites. It also includes datasets from other public databases, namely the Stanford HIV database [S. Y. Rhee, M. J. Gonzales, R. Kantor, B. J. Betts, J. Ravela and R. W. Shafer (2003) Nucleic Acids Res., 31, 298–303]. Comparison between these datasets in the database enables cross-validation with independent datasets and also specific evaluation of the effect of drug treatment.
INTRODUCTION
The HIV-1 virus is the causative agent of AIDS, a growing worldwide epidemic and also a fascinating system for studying fundamental scientific questions. For example, one major clinical problem in the treatment of AIDS is HIV's ability to develop resistance to antiviral drugs rapidly, often within weeks of introduction of a new drug (1–3). Foremost among the factors responsible for this are the virus' extremely high mutation rate (4,5) and replication rate (3,6–8). For this reason, there is great medical interest in understanding both the specific causes of drug resistance, and predicting fast versus slow evolutionary pathways to multiple drug resistance. At the same time, HIV provides an extraordinary wealth of data about fundamental scientific questions such as the fitness landscape for protein evolution (9,10).
Evolutionary biology has developed a powerful and general approach for investigating such problems: metrics of selection pressure that measure whether a particular genetic change is selected for or against during evolution. Such metrics can reveal important selection forces either constraining or driving evolution of a protein, directly from raw sequence variation data (11,12). One very widely used metric of selection pressure on amino acid mutations is known as Ka/Ks or dn/ds (13,14) and measures the ratio of observed amino acid mutations over observed synonymous mutations, normalized by the ratio expected under a neutral model. Thus a Ka/Ks = 1 value indicates neutral selection. Ordinarily Ka/Ks is ≪ 1, indicating negative selection against amino acid mutations (far fewer observed than expected under a neutral model). Ka/Ks > 1 is referred to as positive selection (i.e. amino acid mutations increase reproductive fitness) and is observed in rare cases where new evolutionary challenges create strong pressure for rapid evolution of a protein (e.g. immune system genes like MHC that are involved in recognizing pathogenic antigens). Ordinarily, a single Ka/Ks value is calculated for a whole gene, but with very large datasets it becomes possible to estimate distinct Ka/Ks values for individual codon positions or amino acid mutations. This yields a ‘selection pressure map’ of a gene, revealing its detailed functional constraints and in rare cases positive selection peaks that signal important new evolutionary pressures such as drug treatment. We used Ka/Ks because it provides a powerful tool for detecting positive selection. Phylogenetic analysis of our HIV sequence dataset using Phylip (15) shows a star-like topology (data are available at www.bioinformatics.ucla.edu/HIV/topo.png, but will be presented in detail elsewhere), in agreement with previous studies (16,17).
We have assembled a large-scale database that provides researchers detailed selection pressure maps of HIV proteins involved in drug resistance. These data have many possible applications, including prediction of mutations contributing to drug resistance, distinguishing primary drug resistance mutations from accessory mutations, rate measurements of fast versus slow evolutionary pathways to multiple drug resistance, and the evolutionary dynamics of different types of mutations as the virus moves from untreated to drug-treated conditions and back. This database makes available for the first time a very large HIV sequence dataset (sequences from ∼50 000 clinical AIDS samples), which makes possible high-resolution selection pressure mapping, as well as smaller datasets from other public databases. The methods and most of the data described herein have been published previously (12,18).
DATABASE CONTENT, INTERFACE AND APPLICATIONS
Datasets
The primary dataset consists of sequences for HIV protease and reverse transcriptase (RT) for ∼50 000 clinical AIDS patient samples from the United States, collected during 1999–2003 (12), and mostly under drug treatment. These data cover 1.4 kb each [300 000 chromatograms; six overlapping reads per sample, including both strands; see (12) for details] and were generously contributed by Specialty Laboratories Inc. Owing to HIV's high mutation rate, on average each sequence contains 32 mutations/kb [with respect to the Los Alamos reference sequence (12)], for a total of more than 2 million mutation observations in the dataset (12). Over 5000 distinct codon mutations were observed, each with an average count of 364 samples (12). For comparison, this density of polymorphism information is equivalent to sequencing ∼1 million people. This very large dataset, made available publicly for the first time, has made detailed selection pressure mapping possible. Of the samples, 99.3% are subtype B; non-subtype-B samples were excluded from the analysis (12). The dataset is fully HIPAA-compliant; all information concerning the source patients was removed by Specialty.
The database currently includes two additional datasets, also covering HIV protease and RT. These datasets were obtained from the Stanford HIV database (19). The Stanford-Treated dataset consists of 1797 subtype B samples with known drug treatments. This dataset provides a useful comparison with the Specialty results, for validating whether a specific mutation is reproducibly selected by drug treatment. The Stanford-Untreated dataset consists of 2628 subtype B samples not under drug treatment. By comparing results from this dataset with Specialty and Stanford-Treated, users can assess whether a specific mutation is more likely to be associated with drug resistance or other types of phenotypic fitness effects (e.g. interactions with the immune system).
The Specialty raw sequence data are available as a gzip'ed FASTA file at http://www.bioinformatics.ucla.edu/HIV/Specialty_sequences.fasta.gz.
Amino acid selection pressure mapping
The first aspect of the database is mapping of Ka/Ks selection pressure at each codon position in HIV protease and the first 381 codon positions of RT (Figure 1). Further positions in RT were not sequenced in this dataset. Codon-specific selection pressure (12) was calculated using the following formula:
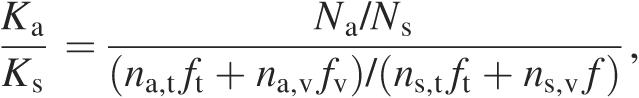 |
where Na and Ns are the number of amino acid mutations and synonymous mutations observed at the codon, na,t is the number of possible transition mutations in the codon that would change the resulting amino acid, ns,t is the number of possible transition mutations that are synonymous, na,v and ns,v are the equivalent numbers for transversions, and ft and fv are the transition and transversion frequencies, respectively. We calculated an LOD confidence score for a codon to be under positive selection pressure according to the following formula:
where N is the total number of mutations observed in the codon and q is calculated as follows:
This analysis includes Ka/Ks values for 2946 individual amino acid mutations (12) at 399 codon positions with LOD scores >2. These data have many applications. For example, strong positive selection (Ka/Ks > 1) indicates drug-resistance mutations or important fitness effects. Experimental validation data in HIV protease (where causes of drug resistance are well characterized) showed that 19 of 23 known drug resistance codons were correctly predicted by our database, which also accurately predicts the mutant enzyme's activity phenotype (12,20). Of the 47 positively selected sites found in the Specialty dataset, 28 were also found in the Stanford-Untreated dataset, possibly indicating that those sites can harbor fitness mutations (18). The database has a simple graphical interface (Figure 1): users can peruse the codon-position selection pressure map directly, click on a position, and inspect detailed tabular results grouped either by codon position, individual amino acid mutations or individual nucleotide mutations (e.g. to see whether two different nucleotide mutations producing the same amino acid replacement show the same Ka/Ks value).
Figure 1.

The interface to the positive selection mutation database is a clickable imagemap. Clicking on any codon position performs a query and returns the results in an easy-to-read format. (Specialty dataset is shown.)
Selection pressure interaction mapping
The massive size of the Specialty dataset makes it possible to measure how selection pressure for one amino acid mutation Y is affected by amino acid mutations at other sites X. Specifically, the database computes Ka/Ks for mutation Y conditioned on the presence of amino acid mutations at site X versus the absence of any mutation at site X. This ‘conditional Ka/Ks’ (18) calculation is performed as follows:
where and are the numbers of amino acid mutations and synonymous mutations at site Y observed in the presence of amino acid mutations at site X and all other variables retain their previous definitions. Dividing this result by the one obtained in the absence of any mutation at site X to arrive at the ‘conditional selection ratio’ (18) results in the following expression:
where and are the numbers of samples containing either an amino acid mutation or synonymous mutation at Y and no mutation at X. The LOD score by which we evaluated the significance of apparent positive conditional selection was calculated using the following:
 |
where and q as defined above. For experimental validation, this database correctly predicted 80 of 92 known mutation positive interaction pairs identified in HIV protease by independent experimental studies (P-value = 10−70) (11,18). The database again provides a graphical interface (Figure 2) as a 2D heatmap showing all pairwise interactions, which users can click at any position to inspect detailed tabular results.
Figure 2.

Selection pressure interaction map. The degree to which a mutation at one site X (horizontal axis) affects the selection pressure at another site Y (vertical axis) is shown as the condtional selection ratio for all amino acid mutations at site Y conditioned on any amino acid mutation at site X. The color coding scale indicates increasing values of positive conditional selection ratio. Interactions showing conditional selection ratios >1 (positive conditional selection) with LOD scores >3 are shown, with blue indicating stronger interactions and yellow indicating weaker ones. Clicking any particular square provides details on the numbers used in the calculation.
These data can yield useful insights into HIV drug resistance. For example, the data show a significant interaction between protease site 90 (a known drug resistance mutation site) and site 10 (Figure 3). Amino acid mutations at 90 displayed strong, unconditional positive selection, indicating that they directly cause drug resistance. In contrast, mutations at 10 are negatively selected in the absence of the 90 mutation, but become positively selected in the presence of the 90 mutation (Figure 3). These results closely match previous experimental studies showing that mutations at 90 cause drug resistance, while mutations at 10 have an accessory effect of compensating for the destabilizing effect of mutations at 90 (21). Thus, our database can help users by providing information that can distinguish primary drug-resistance mutations from accessory mutations (18). Users can navigate through links on every result page, to see mutations that strongly select for a given mutation, mutations that are strongly selected for by this mutation, or links to the Stanford (22) and Los Alamos HIV databases (23) giving further information about mutations at this site.
Figure 3.

For the two possible pathways from wild-type protease to the 10/90 double mutant, we computed the conditional Ka/Ks values for each mutation conditioned on the presence or absence of the other mutation (shown as numbers next to each edge in the figure). For example, in the absence of the 10 mutation, the 90 mutation shows strong positive selection in both the Specialty and Stanford-Treated datasets, but was negatively selected in the Stanford-Untreated dataset. Since the steady-state speed of a multistep path is determined by its slowest step, we highlighted the rate-limiting step in each path (boldface). For example, in the Specialty dataset, the steady-state rate of the upper pathway appears to be ∼10-fold faster than that of the lower pathway. (a) Specialty dataset, (b) Stanford-Treated dataset and (c) Stanford-Untreated dataset.
Comparison between the independent datasets in the database can shed additional light on such questions. For example, users can assess whether positively selected mutations in the Specialty dataset are really due to drug resistance, by comparing with the Stanford-Treated and Stanford-Untreated datasets. As shown in Figure 3b and c, the Stanford-Treated data strongly corroborate the Specialty result, while the Stanford-Untreated data show that 90 is indeed involved in drug resistance; it becomes strongly negatively selected in the absence of drug treatment. These data can help users distinguish genuine drug-treatment mutations from those that affect phenotype in other ways, e.g. interactions with the host immune system. Detailed analysis of these datasets demonstrates that the Ka/Ks results are highly reproducible: independent datasets from different sets of patients show strong quantitative agreement (18).
FUTURE ADDITIONS
We are currently working to add new data and features to the database. We will add a number of new datasets to the database. First, we will add data for additional HIV genes, such as the env gene, which is important for HIV immune evasion (24); although these datasets have smaller numbers of sequences, our analysis has shown that useful Ka/Ks mapping information can be obtained from such counts. Second, we will analyze mutation data from patients under specific drug-treatment to compare selection pressures caused by different drugs. Third, we will add datasets for other HIV subtypes (e.g. subtype C) to reveal, where selection pressure patterns appear to be consistent with those seen in subtype B (allowing diagnostic criteria from subtype B to be applied to other subtypes) versus where there are important differences. Fourth, we will add a new very large dataset for the Hepatitis C core gene, consisting of approximately 60 000 samples, generously donated by Specialty Laboratories. Lastly, we will add new analyses and graphical interfaces to the database, including phylogenetic analysis and clickable pathway diagrams.
Acknowledgments
Funding to pay the Open Access publication charges for this article was provided by NIH Grants U54 RR021813 entitled Center for Computational Biology (CCB) and T32-HG002536.
Conflict of interest statement. None declared.
REFERENCES
- 1.Dybul M., Fauci A.S., Bartlett J.G., Kaplan J.E., Pau A.K., Panel on Clinical Practices for Treatment of HIV Guidelines for using antiretroviral agents among HIV-infected adults and adolescents. Ann. Intern. Med. 2002;137:381–433. doi: 10.7326/0003-4819-137-5_part_2-200209031-00001. [DOI] [PubMed] [Google Scholar]
- 2.Richman D.D., Havlir D., Corbeil J., Looney D., Ignacio C., Spector S.A., Sullivan J., Cheeseman S., Barringer K., Pauletti D., et al. Nevirapine resistance mutations of human immunodeficiency virus type 1 selected during therapy. J. Virol. 1994;68:1660–1666. doi: 10.1128/jvi.68.3.1660-1666.1994. [DOI] [PMC free article] [PubMed] [Google Scholar]
- 3.Wei X., Ghosh S.K., Taylor M.E., Johnson V.A., Emini E.A., Deutsch P., Lifson J.D., Bonhoeffer S., Nowak M.A., Hahn B.H., et al. Viral dynamics in human immunodeficiency virus type 1 infection. Nature. 1995;373:117–122. doi: 10.1038/373117a0. [DOI] [PubMed] [Google Scholar]
- 4.Mansky L.M., Temin H.M. Lower in vivo mutation rate of human immunodeficiency virus type 1 than that predicted from the fidelity of purified reverse transcriptase. J. Virol. 1995;69:5087–5094. doi: 10.1128/jvi.69.8.5087-5094.1995. [DOI] [PMC free article] [PubMed] [Google Scholar]
- 5.Korber B., Theiler J., Wolinsky S. Limitations of a molecular clock applied to considerations of the origin of HIV-1. Science. 1998;280:1868–1871. doi: 10.1126/science.280.5371.1868. [DOI] [PubMed] [Google Scholar]
- 6.Ho D.D., Neumann A.U., Perelson A.S., Chen W., Leonard J.M., Markowitz M. Rapid turnover of plasma virions and CD4 lymphocytes in HIV-1 infection. Nature. 1995;373:123–126. doi: 10.1038/373123a0. [DOI] [PubMed] [Google Scholar]
- 7.Perelson A.S., Neumann A.U., Markowitz M., Leonard J.M., Ho D.D. HIV-1 dynamics in vivo: virion clearance rate, infected cell life-span and viral generation time. Science. 1996;271:1582–1586. doi: 10.1126/science.271.5255.1582. [DOI] [PubMed] [Google Scholar]
- 8.Coffin J.M. HIV population dynamics in vivo: implications for genetic variation, pathogenesis, and therapy. Science. 1995;267:483–489. doi: 10.1126/science.7824947. [DOI] [PubMed] [Google Scholar]
- 9.Kuhmann S.E., Pugach P., Kunstman K.J., Taylor J., Stanfield R.L., Snyder A., Strizki J.M., Riley J., Baroudy B.M., Wilson I.A., et al. Genetic and phenotypic analyses of human immunodeficiency virus type 1 escape from a small-molecule CCR5 inhibitor. J. Virol. 2004;78:2790–2807. doi: 10.1128/JVI.78.6.2790-2807.2004. [DOI] [PMC free article] [PubMed] [Google Scholar]
- 10.Bonhoeffer S., Chappey C., Parkin N.T., Whitcomb J.M., Petropoulos C.J. Evidence for positive epistasis in HIV-1. Science. 2004;306:1547–1550. doi: 10.1126/science.1101786. [DOI] [PubMed] [Google Scholar]
- 11.Wu T.D., Schiffer C.A., Gonzales M.J., Taylor J., Kantor R., Chou S., Israelski D., Zolopa A.R., Fessel W.J., Shafer R.W. Mutation patterns and structural correlates in human immunodeficiency virus type 1 protease following different protease inhibitor treatments. J. Virol. 2003;77:4836–4847. doi: 10.1128/JVI.77.8.4836-4847.2003. [DOI] [PMC free article] [PubMed] [Google Scholar]
- 12.Chen L., Perlina A., Lee C.J. Positive selection detection in 40,000 human immunodeficiency virus (HIV) type 1 sequences automatically identifies drug resistance and positive fitness mutations in HIV protease and reverse transcriptase. J. Virol. 2004;78:3722–3732. doi: 10.1128/JVI.78.7.3722-3732.2004. [DOI] [PMC free article] [PubMed] [Google Scholar]
- 13.Nei M., Gojobori T. Simple methods for estimating the numbers of synonymous and nonsynonymous nucleotide substitutions. Mol. Biol. Evol. 1986;3:418–426. doi: 10.1093/oxfordjournals.molbev.a040410. [DOI] [PubMed] [Google Scholar]
- 14.Li W.H. Unbiased estimation of the rates of synonymous and nonsynonymous substitution. J. Mol. Evol. 1993;36:96–99. doi: 10.1007/BF02407308. [DOI] [PubMed] [Google Scholar]
- 15.Felsenstein J. PHYLIP—phylogeny inference package (version 3.2) Cladistics. 1989;5:164–166. [Google Scholar]
- 16.Grassly N.C., Harvey P.H., Holmes E.C. Population dynamics of HIV-1 inferred from gene sequences. Genetics. 1999;151:427–438. doi: 10.1093/genetics/151.2.427. [DOI] [PMC free article] [PubMed] [Google Scholar]
- 17.Anderson J.P., Rodrigo A.G., Learn G.H., Wang Y., Weinstock H., Kalish M.L., Robbins K.E., Hood L., Mullins J.I. Substitution model of sequence evolution for the human immunodeficiency virus type 1 subtype B gp120 gene over the C2-V5 region. J. Mol. Evol. 2001;53:55–62. doi: 10.1007/s002390010192. [DOI] [PubMed] [Google Scholar]
- 18.Chen L., Lee C. Distinguishing HIV-1 drug resistance, accessory, and viral fitness mutations using conditional selection pressure analysis of treated versus untreated patient samples. Biol. Direct. 2006;1:14. doi: 10.1186/1745-6150-1-14. [DOI] [PMC free article] [PubMed] [Google Scholar]
- 19.Rhee S.Y., Gonzales M.J., Kantor R., Betts B.J., Ravela J., Shafer R.W. Human immunodeficiency virus reverse transcriptase and protease sequence database. Nucleic Acids Res. 2003;31:298–303. doi: 10.1093/nar/gkg100. [DOI] [PMC free article] [PubMed] [Google Scholar]
- 20.Loeb D.D., Hutchison C.A., 3rd, Edgell M.H., Farmerie W.G., Swanstrom R. Mutational analysis of human immunodeficiency virus type 1 protease suggests functional homology with aspartic proteinases. J. Virol. 1989;63:111–121. doi: 10.1128/jvi.63.1.111-121.1989. [DOI] [PMC free article] [PubMed] [Google Scholar]
- 21.Para M.F., Glidden D.V., Coombs R.W., Collier A.C., Condra J.H., Craig C., Bassett R., Leavitt R., Snyder S., McAuliffe V., et al. Baseline human immunodeficiency virus type 1 phenotype, genotype, and RNA response after switching from long-term hard-capsule saquinavir to indinavir or soft-gel-capsule saquinavir in AIDS clinical trials group protocol 333. J. Infect. Dis. 2000;182:733–743. doi: 10.1086/315769. [DOI] [PubMed] [Google Scholar]
- 22.Rhee S.Y., Gonzales M.J., Kantor R., Betts B.J., Ravela J., Shafer R.W. Human immunodeficiency virus reverse transcriptase and protease sequence database. Nucleic Acids Res. 2003;31:298–303. doi: 10.1093/nar/gkg100. [DOI] [PMC free article] [PubMed] [Google Scholar]
- 23.Kuiken C., Korber B., Shafer R.W. HIV sequence databases. AIDS Rev. 2003;5:52–61. [PMC free article] [PubMed] [Google Scholar]
- 24.Johnson W.E., Desrosiers R.C. Viral persistance: HIV's strategies of immune system evasion. Annu. Rev. Med. 2002;53:499–518. doi: 10.1146/annurev.med.53.082901.104053. [DOI] [PubMed] [Google Scholar]