Abstract
The submergence-tolerant species Rumex palustris (Sm.) responds to complete submergence by an increase in petiole angle with the horizontal. This hyponastic growth, in combination with stimulated elongation of the petiole, can bring the leaf tips above the water surface, thus restoring gas exchange and enabling survival. Using a computerized digital camera set-up the kinetics of this hyponastic petiole movement and stimulated petiole elongation were studied. The hyponastic growth is a relatively rapid process that starts after a lag phase of 1.5 to 3 h and is completed after 6 to 7 h. The kinetics of hyponastic growth depend on the initial angle of the petiole at the time of submergence, a factor showing considerable seasonal variation. For example, lower petiole angles at the time of submergence result in a shorter lag phase for hyponastic growth. This dependency of the hyponastic growth kinetics can be mimicked by experimentally manipulating the petiole angle at the time of submergence. Stimulated petiole elongation in response to complete submergence also shows kinetics that are dependent on the petiole angle at the time of submergence, with lower initial petiole angles resulting in a longer lag phase for petiole elongation. Angle manipulation experiments show that stimulated petiole elongation can only start when the petiole has reached an angle of 40° to 50°. The petiole can reach this “critical angle” for stimulated petiole elongation by the process of hyponastic growth. This research shows a functional dependency of one response to submergence in R. palustris (stimulated petiole elongation) on another response (hyponastic petiole growth), because petiole elongation can only contribute to the leaf reaching the water surface when the petiole has a more or less upright position.
The semi-aquatic species Rumex palustris (Sm.) occurs in flooding-prone parts of river floodplains. It occupies a position on the submergence-tolerant side of a gradient of Rumex spp., ranging from tolerant species such as R. palustris and Rumex maritimus in low, frequently flooded regions, to relatively intolerant species such as Rumex acetosa and Rumex thyrsiflorus on higher, rarely flooded sites (Blom et al., 1990). In accordance with its location, the submergence-tolerant R. palustris possesses a range of adaptations to flooding (for review, see Peeters et al., 2002) including stimulated petiole elongation (Voesenek and Blom, 1989; Voesenek et al., 1993), the formation of aerenchymatous adventitious roots (Visser et al., 1996), and a switch to anaerobic metabolism (Nabben, 2001).
One of the first phenotypic modifications that occurs in completely submerged R. palustris plants is an increase in the angle of the younger petioles with the horizontal. This hyponastic growth changes the orientation of these petioles from prostrate to almost vertical, thus decreasing the distance between the leaf blade and the water surface (Voesenek and Blom, 1989; Banga et al., 1997). During complete submergence of R. palustris, hyponastic growth, in combination with stimulated petiole elongation, can bring (part of) the leaf blade above the water surface, given that the water table is not too high (Voesenek and Blom, 1989). This combination of two submergence-induced responses restores gas exchange between the atmosphere and the leaf, thus contributing to increased survival upon submergence (Voesenek et al., 1992, 2003).
Previous research has shown that an increased concentration of the gaseous plant hormone ethylene, which results from ethylene accumulation in the submerged shoots, induces petiole elongation and hyponastic growth in submerged R. palustris plants (Voesenek et al., 1989; Cox et al., 2003). Gibberellins are also involved in submergence-induced petiole elongation (Rijnders et al., 1997). The role of plant hormones in hyponastic growth is currently under investigation.
Nastic responses are common in the plant kingdom and can be defined as rapidly developing organ curvatures or changes in organ orientation induced by developmental processes or (a)biotic environmental factors (Palmer, 1985). Epinastic (downward) and hyponastic (upward) curvatures are caused by differential growth, with more rapid growth on the adaxial and the abaxial side of the organ, respectively (Kang, 1979). Flooding-induced hyponastic growth (Ranunculus repens and Caltha palustris [Ridge, 1987]; Leontodon taraxacoides [Grimoldi et al., 1999]; and Paspalum dilatatum [Insausti et al., 2001]) and epinastic growth (tobacco [Nicotiana tabacum; Kramer and Jackson, 1954]; sunflower [Helianthus annuus; Kawase, 1974]; and tomato [Lycopersicon esculentum; Jackson and Campbell, 1975]) have been described for a number of plant species. Hyponastic leaf movement has also been observed in reaction to a number of other environmental factors, for example shading (Clúa et al., 1996; Gautier et al., 1997; Ballaré, 1999).
The kinetics of submergence-induced hyponastic growth and petiole elongation in R. palustris have not been described in much detail (see Banga et al., 1997). The present work examines the kinetics of these two processes and the possibility that there is an interaction between hyponastic growth and petiole elongation. We hypothesize that hyponastic growth is a prerequisite for the onset of stimulated petiole elongation in submerged R. palustris plants. Because R. palustris is a rosette plant, its leaves have a rather horizontal orientation. If elongation in response to submergence were to occur in these prostrate petioles, it would not serve to bring the leaf tip above the water surface. Stimulated petiole elongation would only be useful when the leaves have reached a more upright orientation by the process of hyponastic growth. Our objectives for the present study were to determine (a) the kinetics of hyponastic growth and stimulated petiole elongation, (b) whether hyponastic growth is necessary for the onset of stimulated petiole elongation, and (c) the petiole angle at which stimulated petiole elongation takes place.
To measure hyponastic growth and stimulated elongation of an individual petiole of a R. palustris plant, a computerized digital camera set-up was designed. This system provides time lapse images, which allow monitoring of growth responses of individual plants in time, in a noninvasive manner, with high accuracy and time resolution.
Using this camera set-up, we showed that the kinetics of both hyponastic growth and petiole elongation were dependent on the petiole angle at the start of submergence. Furthermore, a functional interaction between hyponastic growth and stimulated petiole elongation in submerged R. palustris petioles is discussed.
RESULTS
The Kinetics of Hyponastic Growth Depend on the Initial Petiole Angle at the Time of Submergence
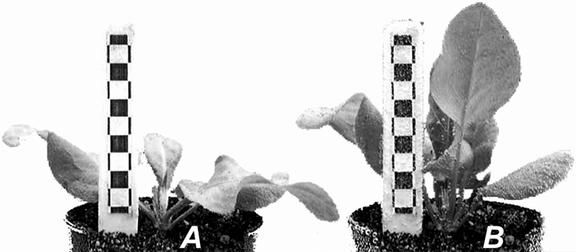
Figure 1 shows a typical example of the hyponastic growth of a submerged R. palustris plant. After 6 h of submergence the leaves showed a more upright position compared with the start of submergence.
Figure 1.
Typical example of the hyponastic growth of a R. palustris plant (27 d old) that has been submerged for 6 h (B) compared with the same plant at the start of submergence (A).
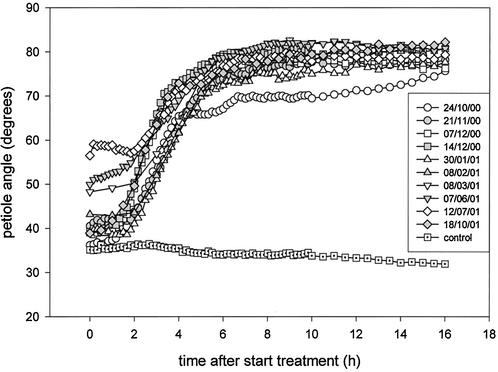
Throughout the course of 1 year a number of replicate experiments were carried out to determine the kinetics of hyponastic growth of submerged R. palustris plants (Fig. 2). Submergence caused a strong increase in petiole angle compared with a slight decrease in petiole angle of plants exposed to air. A maximal angle of 70° to 80° was reached after approximately 6 h. Furthermore, Figure 2 shows that the petiole angle at the start of the submergence treatment varied considerably between experiments, with higher initial angles in northern hemisphere spring and summer, and lower initial angles in autumn and winter. Interestingly, the kinetics of hyponastic growth varied with these differences in the angle of the petiole at the start of submergence (Fig. 2).
Figure 2.
Hyponastic growth kinetics of submerged R. palustris plants (27 d old) that displayed natural variation in initial petiole angle at the time of submergence. Plots represent the angle of the third petiole (four replicate plants) during 16 h of complete submergence, for several batches of plants grown during the course of 1 year. Dates of the individual experiments are listed in the graph (day/month/year). A typical control plot (eight replicate plants) is shown. Mean se never exceeded 6%.
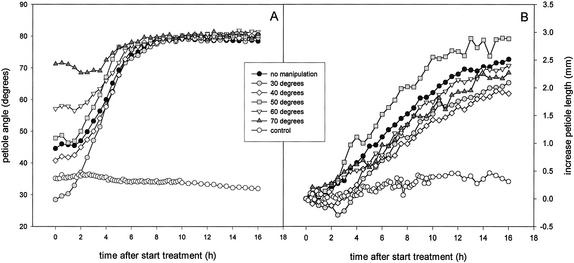
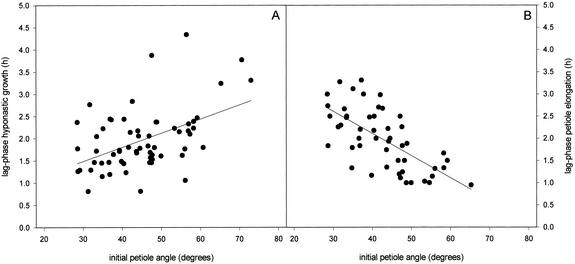
The dependency of the hyponastic growth kinetics on the initial petiole angle at the time of submergence was further explored by manipulating petiole angles before submergence. This manipulation also resulted in a dependency of the hyponastic growth kinetics on the orientation of the petiole at the start of submergence (Fig. 3A). A logistic function, giving a number of parameters describing the hyponastic growth kinetics, was fitted for the individual plants from Figures 2 and 3A. Mean values for these parameters are shown in Table I (the results of this fit for Figs. 2 and 3A were pooled, because they were statistically similar). An initial petiole angle lower than 50° resulted in a shorter lag phase for hyponastic growth than an initial petiole angle higher than 50° (P < 0.05; Table I). This positive dependency of the lag phase of hyponastic growth on the initial petiole angle is also shown in Figure 4A (P < 0.001). Plants with an initial angle of 30° had a lag phase of approximately 1.5 h, whereas this lag phase was almost doubled in plants with an initial angle of 70° (Fig. 4A). Hyponastic growth was finished after 6 h, independent of the initial petiole angle (Table I). However, plants with an initial petiole angle lower than 50° reached a slightly lower final angle compared with plants with an initial petiole angle higher than 50° (P < 0.01, Table I). Curves for plants with a lower initial angle reached their point of inflection (X0) earlier than plants with a higher initial angle (P < 0.05), whereas the factor determining the steepness of the curve (p) did not depend on the initial angle of the petiole (Table I).
Figure 3.
Kinetics of hyponastic growth (A) and petiole length increase (B) of the third petiole of submerged R. palustris plants (27 d old) manipulated to achieve initial petiole angles of 30°, 40°, 50°, 60°, or 70° at the time of submergence, or non-manipulated plants. Plots are means of three replicate plants (“no manipulation”: nine replicate plants). Typical control plots (eight replicates) for non-manipulated plants are shown. Mean se never exceeded 3% for the angle data and 27% for the length data.
Table I.
Kinetics of hyponastic growth and petiole elongation of submerged R. palustris plants
| Parameter | Initial Petiole Angle 30° to 50° | Initial Petiole Angle 51° to 70° |
|---|---|---|
| Lag-phase hyponastic growth (h) | 1.81 (0.08)a | 2.44 (0.21)b |
| End hyponastic growth (h) | 5.86 (0.22)a | 6.25 (0.23)a |
| X0 angle (h) | 3.48 (0.11)a | 4.06 (0.22)b |
| p angle | 4.34 (0.14)a | 5.25 (0.48)a |
| Final angle (degrees) | 78.60 (0.58)a | 80.84 (0.48)b |
| Lag-phase petiole elongation (h) | 2.12 (0.10)a | 1.24 (0.09)b |
| X0 length (h) | 7.19 (0.24)a | 9.59 (0.53)b |
| p length | 2.59 (0.13)a | 1.85 (0.19)b |
| Maximum length increase (mm) | 3.05 (0.14)a | 3.01 (0.35)a |
Means (se between brackets) of parameters describing the kinetics of hyponastic growth and petiole elongation, obtained by fitting the individual replicates of the data presented in Figures 2 and 3 using a logistic function. X0 represents the point of inflection, and p is a factor determining the shape and steepness of the curve. Means with different letters are significantly different (P < 0.05). Number of replicate plants: 42 to 46 for initial petiole angle lower than 50° and 8 to 16 for initial petiole angle higher than 50°.
Figure 4.
Regression plots for the lag phase of (A) hyponastic growth (P < 0.001) and petiole elongation (B; P < 0.001), against the initial angle of the petiole. Lag phases were determined for all individual replicates of the data presented in Figure 2 and 3. r2 values were 0.229 for A and 0.439 for B.
The Kinetics of Submergence-Induced Petiole Elongation Depend on the Initial Petiole Angle at the Time of Submergence
Submergence-induced elongation of petioles with manipulated initial angles is shown in Figure 3B. The kinetics of stimulated petiole elongation also depended on the initial petiole angle. The parameters describing the elongation response are presented in Table I (means of individual plants from Fig. 2; elongation data not shown; and Fig. 3B). The lag phase of elongation for petioles with an initial angle lower than 50° was longer (P < 0.01) than for initial angles higher than 50° (Table I). Figure 4B shows this negative correlation (P < 0.001) between the lag phase of petiole elongation and the initial petiole angle. Low initial angles resulted in almost a 3-fold longer lag phase of petiole elongation than high initial angles (Fig. 4B). The fitted value for the maximum length increase was 3 mm, independent of the initial angle (Table I). Curves for lower initial angles had their point of inflection (X0) earlier (P < 0.01) and had a higher value for the factor determining the steepness of the slope (P < 0.01) compared with curves for higher initial angles (Table I).
A Petiole Angle of 40° to 50° Is Required for the Onset of Stimulated Petiole Elongation
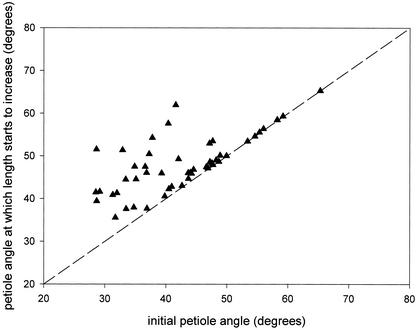
The petiole angle at which stimulated elongation of the same petiole starts was calculated using Equation 1 (“Materials and Methods”). For each individual plant from Figures 2 and 3, “time” in the fit obtained for the hyponastic growth was substituted with the length of the lag phase of petiole elongation. Figure 5 shows this calculated angle at which stimulated elongation starts, plotted against the initial angle. Points on the line of unity represent plants where elongation of the petiole took place without a change in petiole angle. Data points above the unity line indicate plants in which an upward movement of the petiole (hyponastic growth) was required for the onset of stimulated petiole elongation. Figure 5 shows that in plants with an initial petiole angle lower than 40° to 50°, hyponasty was necessary for petiole elongation to start. However, plants with an initial petiole angle higher than 40° to 50° did not need upward leaf movement for the onset of petiole elongation.
Figure 5.
Angle of the third petiole of submerged R. palustris plants at which elongation of this petiole starts, plotted against the initial petiole angle at the time of submergence. Each data point represents an individual replicate of the measured data shown in Figures 2 and 3, calculated using Equation 1 in “Materials and Methods.”
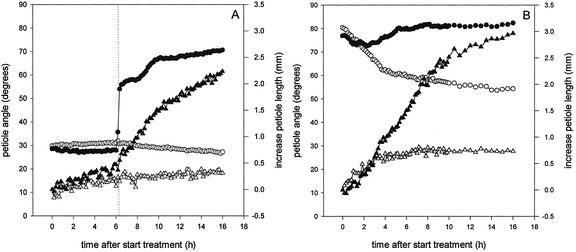
Figure 6A shows the effect of fixing the petiole in its initial position (30°) at the onset of submergence. During 6 h of fixation the elongation of fixed submerged petioles was slower compared with the stimulated petiole elongation observed in submerged plants of which the petiole is not fixed (Fig. 3B). After release of the fixation, stimulated petiole elongation started within 0.6 h (se, 0.3 h), which corresponded to the time needed for the petiole angle to increase from 30° to 60° (Fig. 6A). Manipulation of the petiole angle to 80° at the time of submergence (Fig. 6B) resulted in a stimulation of petiole elongation with a lag phase of 1.9 h (se, 0.2 h). The petiole angle of submerged plants stayed at 80° after the manipulation, whereas that of control plants gradually decreased (Fig. 6B). Additionally, downward movement of the leaf blade of control plants was observed (data not shown). In this experiment, petioles of control plants increased more in length during the first hours than control plants of which the petiole angle was not manipulated (Fig. 3B). This faster elongation of the control plants was probably caused by differential growth resulting in the downward movement of the leaf blade, with the adaxial surface (which is the surface along which the length measurement was taken) elongating faster than the abaxial surface.
Figure 6.
Kinetics of hyponastic growth (circles) and petiole length increase (triangles) of the third petiole of R. palustris plants (27 d old), which was fixed at the initial position (30°) for 6 h, after which the fixation was released (dashed line) (A) and manipulated to 80° at the start of the experiment (B). Black symbols represent submerged plants (eight replicate plants); white symbols represent control plants (seven replicate plants for A; six replicate plants for B). Lag phases for the start of petiole elongation were 6.6 h (se, 0.3 h) for A, and 1.9 h (se, 0.2 h) for B. Mean se never exceeded 10% for the angle data and 58% for the length data.
The stimulated elongation of submerged petioles with a manipulated start angle of 80° (Fig. 6B) could be decreased by reorienting the petiole back to an angle lower than 40° to 50°. Additionally, petiole elongation increased again when the petiole was restored to the original angle of 80° after this downward reorientation (data not shown).
DISCUSSION
The kinetics of hyponastic leaf movement and stimulated petiole elongation of individual submerged R. palustris plants could be monitored accurately using the computerized digital camera set-up presented in this paper. Due to the small time interval (10 min) at which photos were taken, it was possible to follow these two growth processes carefully in time. This provided detailed information about the kinetics of the two processes and their interaction.
Hyponastic Growth
R. palustris responds to complete submergence by changing the angle of its petioles to a more upright position (Figs. 2 and 3A). This hyponastic growth is relatively fast, with a lag phase of 1.5 to 3 h (depending on the initial petiole angle; Fig. 4A). This lag phase of several hours before the onset of hyponastic growth indicates that the angle change does not result from buoyancy. Immediately upon submergence the leaves did show an increase in angle of approximately 10° as a result of buoyancy. This effect is not shown. After 6 h of submergence, the petiole has reached its final angle of 70° to 80° (Table I). This angle change decreases the distance to the water surface and puts the petiole in a position in which stimulated petiole elongation can emerge the leaf tip and restore gas exchange (Voesenek and Blom, 1989; Banga et al., 1997).
Partial submergence induced an increase in leaf angle within 24 h in L. taraxacoides (Grimoldi et al., 1999), and this response was the main factor causing the leaves to reach the water surface. However, in contrast to R. palustris, L. taraxacoides did not survive complete submergence, nor did it show increased petiole elongation during either complete or partial submergence. Hyponastic growth in response to flooding has also been observed for P. dilatatum (Insausti et al., 2001). In this grass species a more upright orientation of tillers was associated with the development of longer leaves and stems, which restored contact with the atmosphere (Insausti et al., 2001). A number of other species show epinastic growth (downward leaf movement) in response to flooded conditions. This phenomenon has, among others, been described for waterlogged sunflower (Kawase, 1974), tobacco (Kramer and Jackson, 1954) and tomato (Jackson and Campbell, 1975). In these species, epinastic growth is assumed to ameliorate the dehydrating effect of a drop in hydraulic conductance of flooded roots (Jackson, 2002).
In this study, petiole angle varied during the year, with high petiole angles in northern hemisphere spring and summer and lower angles in autumn and winter (Fig. 2). The angle with respect to the gravity vector that an organ maintains as a consequence of gravitropism has been termed the gravitropic set-point angle (GSA). For each plant organ, this GSA is determined by its developmental stage and by environmental conditions (Digby and Firn, 1995). The variation in start petiole angle observed here did not result from changes in environmental conditions or developmental stage of the plant during the year because these were kept constant. Neither was the variation the result of the use of different seed batches. In a recent study, Edelmann et al. (2002) reported variation in coleoptile GSA of dark-grown rye seedlings that differed from sowing to sowing. This variation was caused by a difference in the height of the vermiculite layer covering the germinating seedlings in the different sowing events, with ethylene playing an important role (Edelmann et al., 2002). It seems unlikely that a similar effect can explain the difference in start petiole angles of R. palustris plants because seeds were germinated on beads floating on water and were transplanted to the soil after 10 d. Additionally, the difference in leaf angle between batches was observed after a much longer time span (27 d), compared with the differences in the study on the rye seedlings that were present after 3 d (Edelmann et al., 2002). Instead, the higher petiole angles observed for R. palustris in spring and summer and lower angles in autumn and winter (Fig. 2) suggest an annual rhythm in the GSA of R. palustris petioles, which is noticeable even though the plants are grown in controlled environmental conditions.
Interestingly, we observed that varying initial petiole angles at the time of submergence resulted in differences in the kinetics of hyponastic growth (Figs. 2 and 3A). Hyponastic growth of petioles with a higher initial angle was initiated later, had a later point of inflection (X0), and reached a higher final angle than control petioles. The time at which the maximum angle was reached and the factor determining the steepness of the curve were similar for high and low initial angles (Table I). That the initial angle of the petiole determines the kinetics of hyponastic growth is an important factor to take into account when comparing the kinetics of hyponastic growth between different treatments (for example hormone applications or hormone biosynthesis/transport inhibitors) that could influence the initial petiole angle. Myers et al. (1995) measured gravitropically induced growth rate changes of the upper and lower surfaces of sunflower hypocotyls gravistimulated at a number of angles from the vertical. In contrast to the present study, they observed no influence of the displacement angle on the kinetics of the gravitropic response. They did show that the period of maximal differential growth was shorter at small displacement angles and longer at greater displacement angles (Myers et al., 1995). However, comparison of the kinetics of the gravitropic response by Myers et al. (1995) was only performed on a visual basis. Closer examination of the data presented in their study using the fitting method described here could very well reveal differences in the kinetics of the angle response.
Stimulated Petiole Elongation
The advantage gained by changing the petiole position upon submergence is enhanced by an acceleration of petiole elongation (Fig. 3B). Together, these two responses enable the leaf to act as a snorkel to facilitate gas exchange when reaching the water surface, thereby enhancing the rate of photosynthesis (Voesenek and Blom, 1999). In this study, the maximum fitted petiole elongation was 3 mm, independent of the start angle. Although this length increase is relatively small, one has to take into consideration that for practical reasons, the plants used in this study were relatively young (27 d old). It has been shown previously that older R. palustris plants submerged for a longer time period than the 16 h described in this study can achieve a much greater increase in petiole length (Voesenek and Blom, 1989).
Although the maximum fitted petiole elongation was independent of the initial petiole angle, other parameters describing the kinetics of petiole elongation did depend on the initial angle. Lower initial angles resulted in a longer lag phase, a steeper slope and an earlier point of inflection compared with higher initial angles (Table I). Stimulated petiole elongation in response to complete submergence has been described for a number of species (for review, see Ridge, 1987; Voesenek and Blom, 1999). In all of these species, this process serves to reach the water surface and restore gas exchange, as it does in R. palustris.
A Petiole Angle of 40° to 50° Is Necessary for the Onset of Stimulated Petiole Elongation
The digital camera set-up allows study of both hyponastic growth and stimulated petiole elongation of the same petiole of a submerged R. palustris plant. This simultaneous study of two responses induced by submergence led to the discovery that the onset and kinetics of stimulated petiole elongation depend on the petiole angle of the plant. It seems that there is a “critical” petiole angle that has to be reached before stimulated petiole elongation can take place. From Figure 5, it can be deduced that this “critical” angle is between 40° to 50°. When the initial petiole angle of a plant is lower than this threshold value, stimulated petiole elongation only starts to take place when the threshold of 40° to 50° has been reached. The petiole can achieve this change in angle through the process of hyponastic petiole movement. When the initial angle of the petiole is higher than the threshold value of 40° to 50°, no angle change is required for the onset of stimulated petiole elongation, because the threshold value is already met.
Additional proof for the existence of such a threshold angle for the onset of stimulated petiole elongation is given in Figure 6A. The petiole was fixed at its initial position (30°), which is below the threshold angle. During this fixation, there was hardly any increase in elongation rate of the petiole. After release of the fixation, stimulated elongation started when the petiole had overcome the threshold value of 40° to 50° (0.6 h after the release of the angle fixation).
The reverse experiment (Fig. 6B; initial petiole angle at the time of submergence at 80°) shows that stimulated petiole elongation takes place when the angle at the time of submergence is 80°. When the petiole is manipulated back to its start position after an initial orientation at 80° for a number of hours, the stimulated elongation of the petiole caused by this upright position is slowed down. Stimulated petiole elongation is resumed when the petiole is placed back at an angle of 80° with the horizontal (data not shown). This shows that the dependency of petiole elongation on the threshold petiole angle (40°–50°) is a reversible process, with stimulated elongation being switched “on” and “off” depending on the angle of the petiole.
In the experiment described in Figure 6B (initial petiole angle at the time of submergence at 80°), no lag phase for elongation would be expected if the threshold value for petiole angle was the only parameter that had to be met for the onset of petiole elongation. However, the lag phase for petiole elongation was still 1.9 h (Fig. 6B), indicating that there is another signal required for the onset of stimulated petiole elongation. Another indication for this can be found in Figure 4B, which shows that plants that start with a petiole angle above the threshold value still show a lag phase of petiole elongation of 1 to 1.5 h. Previous studies on leaf elongation in submerged R. palustris plants found a lag phase similar to the “basal” lag phase observed in this study (Voesenek et al., 1993; Banga et al., 1997). In these earlier studies, elongation was measured over the whole leaf (petiole + leaf blade) using linear variable displacement transducers, a technique in which the leaf has to be placed in a vertical position to enable measurements. This vertical placement means that the threshold angle signal is reached in these leaves at the start of submergence. That these leaves show a similar basal lag phase for elongation of approximately 1 to 1.5 h resembles closely the situation in Figure 6B and supports the data presented in this study. The basal lag phase, observed in this and earlier studies, probably represents the time needed for the submergence signal to be perceived and translated into a signal transduction pathway leading to stimulation of petiole elongation. The signal that induces petiole elongation in submerged R. palustris plants is the gaseous plant hormone ethylene, which accumulates in the plant during submergence (Voesenek and Blom, 1999). In addition to ethylene, gibberellins are involved in this process (for review, see Peeters et al., 2002; Voesenek et al., 2003).
Using the digital camera set-up we have revealed a fine-tuned interaction between two responses that enable a plant to deal with complete submergence. To our knowledge, not many studies have described such interactions. The shade-avoidance process (for review, see Smith, 2000) constitutes enhanced petiole elongation and hyponasty. A detailed kinetic study could very well reveal an interaction between these two processes similar to that found in this study. Palmer (1964) described two growth processes in response to horizontal orientation of sunflower plants: petiole epinasty and an inhibition of extension growth of the internodes. Epinasty appeared to be directly linked to the horizontal stimulus, whereas growth inhibition reached its maximum 24 to 48 h after the application of the stimulus (Palmer, 1964). However, the interaction between these two growth processes was not studied.
A Model for Interaction between Submergence-Induced Hyponastic Growth and Petiole Elongation
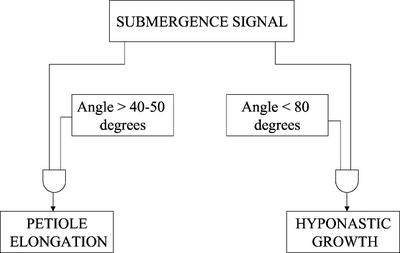
Given that the start of petiole elongation depends on two signals (threshold petiole angle and a basal lag phase for perception and transduction of the submergence signal), a model for the interaction between submergence-induced hyponastic growth and stimulated petiole elongation in R. palustris petioles can be designed (Fig. 7). This model is based on the use of Boolean language, which is a digital (numeric) formalism that allows an accurate, qualitative description of signal transduction processes (Genoud and Métraux, 1999; Genoud et al., 2001). The Boolean language translates signaling elements into binary state elements, which have an “on” (1) and “off” (0) state. Boolean operators can combine the input signals from a number of these signaling elements into a certain output signal. An advantage of using the Boolean system is that the physiological nature of the signals between signaling elements or the number of steps involved does not have to be known. This makes it a useful system to describe the interaction between hyponastic growth and petiole elongation presented in this paper. For this interaction, we know which elements have to be met to achieve petiole elongation, but we do not yet have extensive information on the nature of the interactions, e.g. stimulation or inhibition. Using the Boolean system, the model in Figure 7 represents the following interaction between hyponastic growth and petiole elongation: Stimulated petiole elongation in response to complete submergence starts when two input conditions have been met: a submergence signal and a threshold value of the petiole angle of 40° to 50°. Hyponastic growth is the process that increases the angle of the petiole during submergence (as long as the petiole angle is lower than 80°), so that eventually the threshold value for the petiole angle is met, and petiole elongation can start (Fig. 7).
Figure 7.
Boolean model describing the interaction between submergence-induced hyponastic growth and stimulated petiole elongation in R. palustris petioles. The AND operators in the model indicate that both input conditions have to be met to generate the output.
MATERIALS AND METHODS
Plant Material and Growth Conditions
Seeds of Rumex palustris (Sm.) were germinated on black polyethylene beads (Elf Atochem, Marseille, France) floating on tap water in a transparent container for 10 d (12 h of light, 25°C, 70 μmol m−2 s−1 photon flux density, and 12 h of dark, 10°C). Germinated seedlings were singly transplanted to plastic pots (70 mL) containing a mixture of potting soil and sand (2:1, v/v), enriched with 0.14 mg of MgOCaO per pot. Before seedling transfer, each pot was saturated with 20 mL of nutrient solution containing: 7.50 mm (NH4)2SO4, 15.00 mm KH2PO4, 15.00 mm KNO3, 86.35 μm Fe-EDTA, 4.27 μm MnSO4, 1.81 μm ZnSO4, 0.32 μm CuSO4, 42.67 μm H3BO3, and 0.53 μm Na2MoO4. All chemicals were pro analysi grade, obtained from Merck (Darmstadt, Germany). Plants were grown for 17 d in a growth chamber (20°C; 70% relative humidity, 16 h of light; 200 μmol m−2 s−1 photon flux density). Pots with seedlings were kept in a glass-covered tray for 2 d after transplantation, after which they were transferred to irrigation mats (Brinkman Agro BV, S-Gravenzande, The Netherlands) in the same growth chamber. The mats were automatically watered with tap water to saturation twice a day, and the excess water was drained.
In all experiments, the third petiole of plants that were 27 d old was studied. It has been shown that at this developmental stage, the third petiole exhibits clear elongation and hyponastic growth (Banga et al., 1997). Replicate plants were selected on homogeneity of developmental stage and length of the third petiole.
Computerized Digital Camera Set-Up
To measure length and angle of the third petiole of intact R. palustris plants during treatment, a computerized digital camera set-up (developed in house) was built into a growth cabinet. Growth conditions were the same as in the growth chamber where the plants were grown. The set-up consisted of a digital camera (Fujix DS-330, FujiPhoto Film, Tokyo) that could move along an axis in front of a row of cuvettes containing plants, a IF-D3 interface kit and a EU-D3/DsA extension unit (FujiPhoto Film). A personal computer equipped with software developed in the Labview v5.1 software package (National Instruments, Woerden, The Netherlands) controlled movement of the camera along the axis (400,000 steps over 1.4 m), the interval at which photos were taken at a certain position, and the camera settings. In all experiments described, individual plants were photographed every 10 min during 16 h of treatment (in continuous light to enable the camera to take photos).
Submergence Treatment
The day before the experiment plants were placed in the camera set-up to acclimatize. Plants were placed singly in open glass cuvettes (18.5 × 24.5 × 25.5 cm) in the camera set-up with the third petiole perpendicular to the axis of the camera. To facilitate measurement, the top layer of soil and part of the front of the pot were removed so that the petiole base was visible. The cotyledons were also removed if they were blocking the petiole base. Additionally, the third petiole was marked with drawing ink (four marks at even intervals from the petiole base to the petiole apex). A calibration object with known dimensions was placed in the soil in the same plane as the third petiole. These preparations did not influence the response of the third petiole to submergence (data not shown). All experiments started between 8 and 10 am when the plants were 27 d old. To achieve submergence, tap water (20°C) was gently pumped into the cuvette until a water depth of 20 cm (from the soil surface) was reached. Control plants rested on a moist irrigation mat in the cuvette.
Angle Manipulation Treatment
Experiments in which the angle of the third petiole was manipulated took place in open glass cuvettes (15.0 × 17.5 × 29.0 cm) fitted with a metal ring in which the pots could be placed. This ring could be turned to achieve any given angle of the petiole with the horizontal at the start of the experiment. During the treatment, the petiole was able to move freely.
To fix the third petiole in its initial position, a mesh cap (mesh width 0.6 × 0.6 cm) was placed over the petiole and leaf blade 1 d before the experiment started. The cap restricted upward movement of the third leaf in response to submergence without restricting petiole elongation. The petiole was fixed in its initial position during the first 6 h of the treatment. After that, the cap was carefully removed, and the petiole was allowed to move freely. Preparation and submergence of the plants took place as described above.
Image Analysis
Angle and length of the third petiole were measured on the photos (1,280 × 1,000 pixels) using a PC-based image analysis system with a macro developed in-house in the KS400 v3.0 software package (Carl Zeiss Vision, Jena, Germany). Petiole angle was determined as the angle between the horizontal and the adaxial surface of the petiole between the apical mark and the second basal mark. Total petiole length was measured as the distance between the highest point of the basal mark and the highest point of the apical mark following the adaxial surface. For all time points, the increase in petiole length compared with the start of the treatment (t = 0) was calculated. A series of photos from one plant was geometrically calibrated using the calibration object in five random photos.
Data Fitting
To describe the kinetics of hyponastic growth or petiole elongation (Y), the measured data of individual plants were fitted using a logistic function:
 |
1 |
where A1 is the begin value, A2 is the end value, X0 is the point of inflection, and p is the factor determining shape and steepness of the curve.
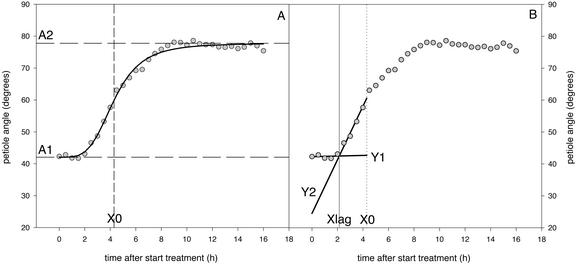
Fitting was performed by minimizing the sum of squares of the difference between the measured and the predicted data using the solver function (standard settings) in Microsoft Excel 2000 (Microsoft, Redmond, WA). Figure 8A shows an example of the fit on the measured petiole angles of one representative plant. The parameters A1, A2, and X0, which describe the logistic function, are shown. The factor p determines the shape and steepness of the curve. Changing p alone results in variation in the range of values of “time” (from Eq. 1) over which the major change in response is found (Weyers et al., 1987). The petiole elongation data were fitted in a similar fashion.
Figure 8.
A, Representative example of the logistic fit (solid line) used to describe the measured petiole angle data (round symbols), and the parameters describing the logistic function (A1, begin value; A2, end value; and X0, point of inflection); B, determination of the lag phase (Xlag) of hyponastic growth using two linear lines (Y1 and Y2) fitted through the subset of measured data below X0, in such a way that the point of discontinuity is equal to the interception of the two lines. Y1 = a + b*x (If x < Xlag), Y2 = (a + b*Xlag) + d*(x − Xlag) (If x > Xlag).
The X0 value obtained from this fit was used to divide the measured data into two subsets. First, the subset of data below X0 was used to determine the lag phase of the start of hyponastic growth or that of stimulated petiole elongation. Second, the subset of data above X0 was used to determine the time at which hyponastic growth was completed. Determination of the lag phase (Xlag) took place by fitting two linear lines (Y1 and Y2) through a subset of measured data in such a way that the point of discontinuity is equal to the interception of the two lines:
 |
2 |
 |
3 |
A value for Xlag was obtained by minimizing the sum of squares of the difference between the measured and the predicted data, using the solver function (standard settings) in Microsoft Excel 2000. Figure 8B shows a representative example of the determination of the hyponastic growth lag phase using the fitted point of interception for the two lines (Y1 and Y2). The lag phase for stimulated petiole elongation was determined in the same way. The end of the hyponastic growth was determined in a similar fashion on the measured angle data above X0.
Statistical Analysis
Table I presents the parameters describing the kinetics of hyponastic growth and petiole elongation for an initial petiole angle of 30° to 50° and for an initial petiole angle of 51° to 70°. The data were divided into these two groups based on the fact that the threshold petiole angle for the onset of petiole elongation was shown to be approximately 50° (Fig. 5). To compare the means of the parameters, an independent samples t test was performed using the program SPSS v10 (SPSS Inc., Chicago).
ACKNOWLEDGMENTS
We thank Dr. M. Terlou (Image Analysis Department, Faculty of Biology, Utrecht University) for developing the image analysis macro and R.G.C. van Trigt (Faculty of Pharmacy, Utrecht University) and W.H.C. Huibers (Plant Ecophysiology, Utrecht University) for designing the computerized digital camera set-up. R.A.M. Welschen and G. van der Heijden are thanked for technical assistance, and M.P. McDonald for critically reading the manuscript.
Footnotes
This work was supported by the Dutch Science Foundation (PIONIER grant no. 800.84.470).
Article, publication date, and citation information can be found at www.plantphysiol.org/cgi/doi/10.1104/pp.102.014548.
LITERATURE CITED
- Ballaré CL. Keeping up with the neighbors: phytochrome sensing and other signalling mechanisms. Trends Plant Sci. 1999;4:97–102. doi: 10.1016/s1360-1385(99)01383-7. [DOI] [PubMed] [Google Scholar]
- Banga M, Bögemann GM, Blom CWPM, Voesenek LACJ. Flooding resistance of Rumex species strongly depends on their response to ethylene: rapid shoot elongation or foliar senescence. Physiol Plant. 1997;99:415–422. [Google Scholar]
- Blom CWPM, Bögemann GM, Laan P, van der Sman AJM, van de Steeg HM, Voesenek LACJ. Adaptations to flooding in plants from river areas. Aquat Bot. 1990;38:29–47. [Google Scholar]
- Clúa A, Bottini R, Brocchi GN, Bogino J, Luna V, Montaldi ER. Growth habit of Lotus tenuis shoots and the influence of photosynthetic photon flux density, sucrose and endogenous levels of gibberellins A1 and A3. Physiol Plant. 1996;98:381–388. [Google Scholar]
- Cox MCH, Millenaar FF, Peeters AJM, Voesenek LACJ. Ethylene induces hyponastic growth in Rumex and Arabidopsis. In: Pech JC, Vendrell M, Klee H, Romojaro F, Grierson D, editors. Proceedings of the NATO Advanced Research Workshop on Biology and Biotechnology of the Plant Hormone Ethylene 2002, Spain: Murcia; 2003. . (in press) [Google Scholar]
- Digby J, Firn RD. The gravitropic set-point angle (GSA): the identification of an important developmentally controlled variable governing plant architecture. Plant Cell Environ. 1995;18:1434–1440. doi: 10.1111/j.1365-3040.1995.tb00205.x. [DOI] [PubMed] [Google Scholar]
- Edelmann HG, Gudi G, Kühnemann F. The gravitropic setpoint angle of dark-grown rye seedlings and the role of ethylene. J Exp Bot. 2002;53:1627–1634. doi: 10.1093/jxb/erf007. [DOI] [PubMed] [Google Scholar]
- Gautier H, Varlet-Grancher C, Baudry N. Effects of blue light on the vertical colonization of space by white clover and their consequences for dry matter distribution. Ann Bot. 1997;80:665–671. [Google Scholar]
- Genoud T, Métraux J-P. Crosstalk in plant cell signaling: structure and function of the genetic network. Trends Plant Sci. 1999;4:503–507. doi: 10.1016/s1360-1385(99)01498-3. [DOI] [PubMed] [Google Scholar]
- Genoud T, Trevino Santa Cruz MB, Métraux J-P. Numeric simulation of plant signaling networks. Plant Physiol. 2001;126:1430–1437. doi: 10.1104/pp.126.4.1430. [DOI] [PMC free article] [PubMed] [Google Scholar]
- Grimoldi AA, Insausti P, Roitman GG, Soriano A. Responses to flooding intensity in Leontodon taraxacoides. New Phytol. 1999;141:119–128. [Google Scholar]
- Insausti P, Grimoldi AA, Chaneton EJ, Vasellati V. Flooding induces a suite of adaptive plastic responses in the grass Paspalum dilatatum. New Phytol. 2001;152:291–299. [Google Scholar]
- Jackson MB. Long-distance signalling from roots to shoots assessed: the flooding story. J Exp Bot. 2002;53:175–181. doi: 10.1093/jexbot/53.367.175. [DOI] [PubMed] [Google Scholar]
- Jackson MB, Campbell DJ. Movement of ethylene from roots to shoots, a factor in the responses of tomato plants to waterlogged soil conditions. New Phytol. 1975;74:397–406. [Google Scholar]
- Kang BG. Epinasty. In: Haupt W, Feinleib ME, editors. Encyclopedia of Plant Physiology, New Series. 7. Physiology of Movements. Berlin: Springer-Verlag; 1979. pp. 647–667. [Google Scholar]
- Kawase M. Role of ethylene in induction of flooding in sunflower. Physiol Plant. 1974;31:29–38. [Google Scholar]
- Kramer PJ, Jackson WT. Causes of injury to flooded tobacco plants. Plant Physiol. 1954;29:241–245. doi: 10.1104/pp.29.3.241. [DOI] [PMC free article] [PubMed] [Google Scholar]
- Myers AB, Glyn GH, Digby J, Firn RD. The effect of displacement angle on the gravitropic and autotropic growth responses of sunflower hypocotyls. Ann Bot. 1995;75:277–280. [Google Scholar]
- Nabben RHM. Metabolic adaptations to flooding-induced oxygen deficiency and post-anoxia stress in Rumex species. PhD thesis. The Netherlands: Catholic University Nijmegen; 2001. [Google Scholar]
- Palmer JH. Comparative study on the effects of applied indoleacetic acid and horizontal orientation of the primary shoot, upon internode extension and petiole orientation in Helianthus annuus, and the modifying influence of gibberellic acid. Planta. 1964;61:283–297. [Google Scholar]
- Palmer JH. Epinasty, hyponasty, and related topics. In: Pharis RP, Reid DM, editors. Encyclopedia of Plant Physiology, New Series. 11. Hormonal Regulation of Development III. Role of Environmental Factors. Berlin: Springer-Verlag; 1985. pp. 139–168. [Google Scholar]
- Peeters AJM, Cox MCH, Benschop JJ, Vreeburg RAM, Bou J, Voesenek LACJ. Submergence research using Rumex palustris as a model: looking back and going forward. J Exp Bot. 2002;53:391–398. doi: 10.1093/jexbot/53.368.391. [DOI] [PubMed] [Google Scholar]
- Ridge I. Ethylene and growth control in amphibious species. In: Crawford RMM, editor. Plant Life in Aquatic and Amphibious Habitats. Oxford: Blackwell Scientific Publications; 1987. pp. 53–76. [Google Scholar]
- Rijnders JGHM, Yang YY, Kamiya Y, Takahashi N, Barendse GWM, Blom CWPM, Voesenek LACJ. Ethylene enhances gibberellin levels and petiole sensitivity in flooding-tolerant Rumex palustris but not in flooding-intolerant R. acetosa. Planta. 1997;203:20–25. [Google Scholar]
- Smith H. Phytochromes and light signal perception by plants-an emerging synthesis. Nature. 2000;407:585–591. doi: 10.1038/35036500. [DOI] [PubMed] [Google Scholar]
- Visser EJW, Blom CWPM, Voesenek LACJ. Flooding-induced adventitious rooting in Rumex: morphology and development in an ecological perspective. Acta Bot Neerl. 1996;45:17–28. [Google Scholar]
- Voesenek LACJ, Banga M, Their RH, Mudde CM, Harren FJM, Barendse GWM, Blom CWPM. Submergence-induced ethylene synthesis, entrapment, and growth in two plant species with contrasting flooding resistances. Plant Physiol. 1993;103:783–791. doi: 10.1104/pp.103.3.783. [DOI] [PMC free article] [PubMed] [Google Scholar]
- Voesenek LACJ, Benschop JJ, Bou J, Cox MCH, Groeneveld HW, Millenaar FF, Vreeburg RAM, Peeters AJM. Interaction between plant hormones regulates submergence-induced shoot elongation in the flooding-tolerant dicot Rumex palustris. Ann Bot. 2003;91:205–211. doi: 10.1093/aob/mcf116. [DOI] [PMC free article] [PubMed] [Google Scholar]
- Voesenek LACJ, Blom CWPM. Growth responses of Rumex species in relation to submergence and ethylene. Plant Cell Environ. 1989;12:433–439. [Google Scholar]
- Voesenek LACJ, Blom CWPM. Stimulated shoot elongation: a mechanism of semiaquatic plants to avoid submergence stress. In: Lerner HR, editor. Plant Responses to Environmental Stresses: From Phytohormones to Genome Reorganization. New York: Marcel Dekker; 1999. pp. 431–448. [Google Scholar]
- Voesenek LACJ, van der Sman AJM, Harren FJM, Blom CWPM. An amalgamation between hormone physiology and plant ecology: a review on flooding resistance and ethylene. J Plant Growth Regul. 1992;11:171–188. [Google Scholar]
- Weyers JDB, Paterson NW, A'Brook R. Towards a quantitative definition of plant hormone sensitivity. Plant Cell Environ. 1987;10:1–10. doi: 10.1111/j.1365-3040.1987.tb02073.x. [DOI] [PubMed] [Google Scholar]


