Abstract
RegTransBase is a manually curated database of regulatory interactions in prokaryotes that captures the knowledge in public scientific literature using a controlled vocabulary. Although several databases describing interactions between regulatory proteins and their binding sites are already being maintained, they either focus mostly on the model organisms Escherichia coli and Bacillus subtilis or are entirely computationally derived. RegTransBase describes a large number of regulatory interactions reported in many organisms and contains the following types of experimental data: the activation or repression of transcription by an identified direct regulator, determining the transcriptional regulatory function of a protein (or RNA) directly binding to DNA (RNA), mapping or prediction of a binding site for a regulatory protein and characterization of regulatory mutations. Currently, RegTransBase content is derived from about 3000 relevant articles describing over 7000 experiments in relation to 128 microbes. It contains data on the regulation of about 7500 genes and evidence for 6500 interactions with 650 regulators. RegTransBase also contains manually created position weight matrices (PWM) that can be used to identify candidate regulatory sites in over 60 species. RegTransBase is available at http://regtransbase.lbl.gov.
INTRODUCTION
With more than 300 microbial genomes sequenced and more than 900 in the sequencing pipelines (according to Genomes OnLine Database, (1)) comparative genomics is turning into a major tool for investigating regulatory interaction in bacteria. In the studies on bacterial regulation, the final decision of whether to include each putative site in a particular regulon is made after detailed inspection and consultation with relevant scientific literature by a human expert. Experimental data on regulation are abundant, but except for Escherichia coli (RegulonDB) (2) and Bacillus subtilis (DBTBS) (3), they mainly remain not systematized and out of context with the latest whole-genome microbial assemblies. Absence of a unified framework for investigation of regulation in a wide range of bacteria based on experimental data restricts opportunities for computational prediction of regulons, which mostly remains a field of semi-manual examination.
In addition to RegulonDB and DBTBS, several recently developed databases summarize subsets of data related to different aspects of bacterial regulation and introduce prediction tools based on these data. Two databases collect regulatory sites: DPInteract (4), which is not longer supported, includes E.coli data, and PRODORIC (5,6) that contains data on a number of bacteria. BacTregulators (7) and ExtraTrain (8) collect computationally derived information about distribution of transcription factors in bacterial genomes. Finally, PredictRegulon (9) and TRACTOR (10) are servers for the identification of candidate sites similar to user-supplied ones (PredictRegulon) or sites from RegulonDB (TRACTOR). Neither of these databases covers the entire taxonomic diversity of prokaryotic genomes.
RegTransBase is a database that aims to fill the existing gaps by
collecting data from all prokaryotes (currently excluding E.coli and B.subtilis, exhaustively covered by others);
careful recording of experimental evidence;
mapping the data to complete genomes;
creation of positional weight matrices (PWMs) based on published experimental and in-house in silico analyses;
providing tools for identification of new candidate binding sites in genomic sequence or DNA fragments.
DATABASE CONSTRUCTION AND STRUCTURE
Data collection
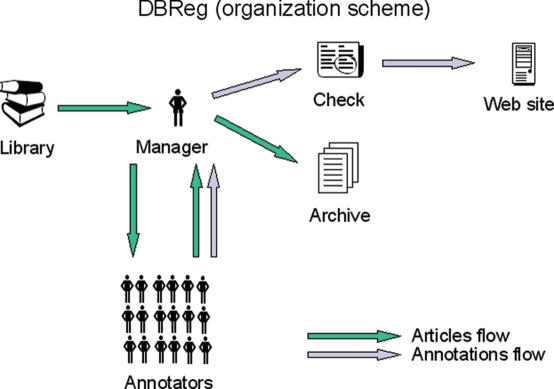
The general data flow is shown in Figure 1. The main steps of data acquisition are the search for relevant articles, entry of data using the annotator interface, quality control, mapping sites and genes to genomes, additional manual corrections (if necessary) and presentation of the data in the final form.
Figure 1.
The information flow of articles and annotations is shown. A manager obtains articles from a library and works with annotators in creating annotations from those articles. The annotations undergo a quality check and are then placed on the website.
Bibliography search for relevant articles was done separately for each genus of bacteria. The initial set of articles was formed by querying the NCBI PubMed database (11) with the keyword combination ‘gene & regulation & [genus]’. The results were imported into an auxiliary database and the abstracts were manually analyzed by the database manager in order to identify articles likely to be relevant. For each selected article, the search using the PubMed ‘related articles’ link was performed, and its results were added to the auxiliary database and analyzed manually. This procedure was iterated twice.
After that the selected articles were given to the database annotators, where the relevant data were input into the database using a specially written annotator interface application. The entry quality was controlled by the manager using a number of consistency and completeness checks. Each site and gene in the database was represented by a sequence fragment of sufficient length (unique ‘signatures’). These signatures were used to map genes and sites to available whole-genome assemblies (see below).
Data organization
Each database entry describes a single experiment which is an experimentally determined relationship between several database elements. A single entry may describe an experiment and control, identical results obtained by different methods or the results of the application of one technique to several similar objects. Only original results are accepted, normally from the ‘Results’ or ‘Discussion’ sections of an article.
The types of experimental techniques form a controlled vocabulary. An annotator can add new types of experimental techniques, subject to approval by the database manager. The following categories of experiments are accepted:
demonstration of the regulation of gene expression by a known regulator;
demonstration that a gene encodes a regulatory protein (excluding proteins that do not directly bind DNA, e.g. protein kinases);
experimental mapping of DNA binding sites for known regulators;
identification of mutations in regulatory genes influencing expression of regulated genes;
in silico analysis: construction of consensi; prediction of binding sites.
There are several categories of experiments that currently are not accepted: regulation by an effector (concentration of some compound, physical effects) when the regulatory protein is not known; post-translational regulation; regulatory mutations not linked to a specific gene; mutations in known regulator genes; experiments where the regulatory effects are measured indirectly (e.g. by enzymatic activity of metabolite concentration); identification of translation starts; computational prediction of promoters and terminators without experimental verification.
Another controlled vocabulary is the list of genomes, including strain identifiers and plasmid names.
The classes of elements are regulators (molecules directly binding to DNA, with a well-defined binding site); effectors (molecules not binding DNA or physical effects such as stress, etc.); positional elements. The latter are regions in DNA sequences. Positional elements form a hierarchy: locus > operon > transcript > gene and site; such elements may be subelements of elements of the same or higher levels. Thus, a site can be a subelement of any element, whereas a locus may be a subelement only of another locus. ‘Transcript’ elements are created when promoters or terminators have been mapped; ‘operon’ is defined as a union of overlapping transcripts; ‘locus’ is created when it is necessary to link several lower-level elements (sites, genes, transcripts).
All elements are linked to corresponding experiments and together they are linked to their article. As mentioned above, positional elements are mapped to genomes. Thus if two independent articles describe regulation of the same gene, the data contained in these articles will be interlinked via this gene, but sites and other experimental data will be reported as independent entries. When regulators are known only by the name, and thus cannot be merged by genome mapping, they are retained as independent elements. This redundancy will be overcome in subsequent releases.
Thus, manual processing of the literature resulted in the so-called annotators' database. As mentioned above, genomic location of specific features in this database was recorded by the annotator as a signature that included sequence information describing the area of the interaction or genomic location in relation to another object. These signature sequences were used to map these features to NCBI RefSeq (12) genomes.
GenBank RefSeq bacterial genome sequences and annotations were imported into a BioSQL [http://bioperl.org/wiki/BioSQL] (13) database. Additional genes were not added to the RefSeq genomes unless manually verified and only with supporting published experimental evidence. An additional database schema was developed to hold the relations between the BioSQL database and the annotators database, as well as describe additional information such as search results, profile alignments and various descriptors (COG, GO, etc).
Mapping of a gene or a site signature on whole-genome assemblies presented a non-trivial procedure in many cases. Multi-step BLAST searching against a database of bacterial RefSeq genomes was followed by manual examination to resolve ambiguities.
Other elements were assigned locations based on their child elements. Following the hierarchy of sites and genes, transcripts, operons and loci, each element was mapped on a genome based on the upper and lower positional bounds of its child elements. If multiple copies of a child existed, only locations which included the greater number of different child elements were annotated. More information on this procedure, along with other technical information on the mapping procedures can be found at http://regtransbase.lbl.gov/cgi-bin/regtransbase?page=technical_information.
COGs were downloaded from COGs+ (14) which is an extension of the NCBI COG groupings to include newer genomes. The data were parsed and added as an annotation to the CDS features in the database.
In addition to the information obtained from published articles, RegTransBase contains many hand annotated alignments of regulatory regions and position-specific weight matrices created from these alignments. Each alignment includes links to specific transcription factors when available, as well as the source genomes of the sequences in the alignment and particular genomic locations when available.
Database contents
Currently, the database contains information on 128 organisms spanning the bacterial genome space. This resource allows for access to the experimental information from about 3000 articles from as far back as 1977 until the present day. In addition, RegTransBase includes the results from a wide range of different experiments. Tables 1–3 in Supplementary Materials contain information on the organisms represented in RegTransBase, the type and the number of experiments and the type and the number of elements.
Database access and interface
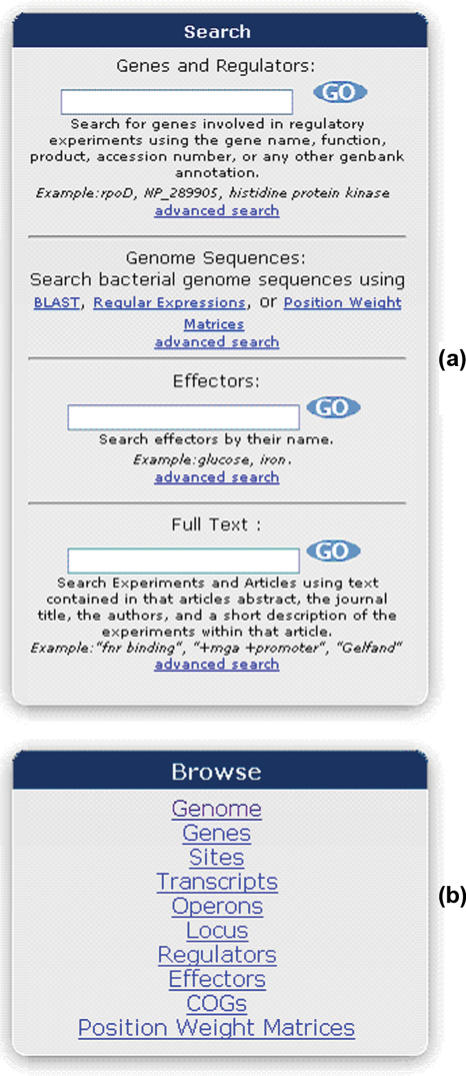
RegTransBase gives a user the ability to search our dataset using a variety of identifiers, including gene name, function, experiment description, article name (or part of) and effector name (Figure 2a). A user may also submit a sequence to search our database using BLAST. The databases that are available are all bacterial genomes, all predicted gene sequences (nucleotide and amino acid), predicted gene sequences with experimental evidence and site sequences with experimental evidence. For results, the user is given a traditional BLAST output along with a graphical overview of the genomic region around the hit (Figure 1, Supplementary Materials). This overview will show the presence of any experimental evidence on a gene by coloring it orange, as well as, show any site features with experimental evidence. The user may then click on the image to go to that location in the genome.
Figure 2.
(a) Various search types available from RegTransBase. The user may search by text, such as a gene name or annotation, an element name or from the description of an experiment or abstract. Alternatively, you may search using BLAST against various datasets for finding sequence similarity, or you may use sequence alignments and position weight matrices for finding similar motifs within whole genomes. (b) You may also browse different lists of the data available within RegTransBase.
RegTransBase also provides a list of categories that a user may browse within our database, which allows the user to see the type of information our database contains. The supporting types of browsing are by genome, gene, site, transcript, operons, locus, regulator, effector, COG and PWM (Figure 2b).
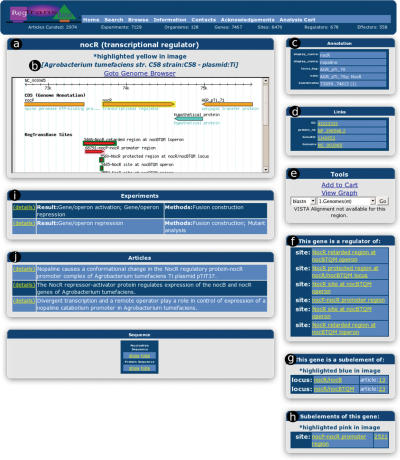
In addition to viewing the information that was obtained from the experiments in the article, we provide the user with tools to further analyze an element. When a user is viewing a particular element, such as a gene, from the gene information page, they are presented with additional information: a listing of the articles, which mention that gene in our database; the various experiments that gene was involved in with a short description of the results and methods; the NCBI annotation of that gene; a visual overview of the genomic region with various interacting features highlighted on the genome; and the subelements and parent elements that were annotated (Figure 3).
Figure 3.
A screen shot of the gene detail page. Shown on this page are (a) the name of the gene, (b) the genome and an overview of the genomic region. The current feature is highlighted yellow, subelements are highlighted pink, parent elements are highlighted blue. (c) annotation of this feature (imported from NCBI), (d) external links for this feature, (e) various analysis tools. (f) information pertaining to sites that the product of this gene regulates (g) parent elements of this feature, (h) subelements of this feature, (i) a listing of the experiments in which this feature is involved in. You may mouse over the details link to see a description of the experiment, while clicking on the link will take you to a more detailed explanation of the experiment. (j) A listing of the articles in which this feature is mentioned in. You may click on the details link for a more detailed explanation of this article.
In addition to the information presented on the gene information page, additional data are provided for further analysis. The user has access to the results of whole-scaffold alignments of a number of bacterial genomes. These alignments, when available for a particular species, can be accessed through the link to VISTA Genome Browser (15) (Figure 2, Supplementary Materials). This browser displays a visually intuitive comparative view of the genomic region, comparing this region to multiple organisms at the nucleotide level. This feature is useful for the investigation of the level of conservation of a particular regulatory element. A user may also analyze an overview graph (Figure 3, Supplementary Materials) of the various elements involved in experiments. Drawn using graphviz [http://www.graphviz.org/], this graph depicts each of the different types of elements in our database as a symbol with arrows showing the relations between the elements.
Gbrowse (16), a feature-rich graphical genome browser, is used for visualizing all elements of RegTransBase on the scale of whole genomes. On the ‘Gene Details’ page, it visualizes a genome sequence fragment around a gene. A ‘Go to Genome Browser’ link is provided to allow for a more detailed inspection of the various features available on this genome (Figure 4, Supplementary Materials). Gene features within Gbrowse are color coded orange to allow a user to know which genes have additional experimental information within RegTransBase. Sites and other elements are also displayed as features on the genome while browsing. Gene elements are depicted only once for all experiments, though sites and other elements will contain an entry for each experiment to show the specific genomic locations under study from a particular experiment.
Figure 4.
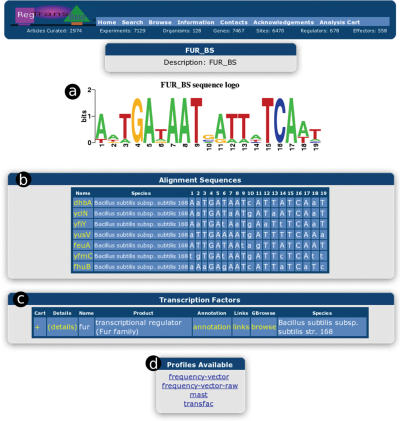
A screen shot of the profile alignment information. Shown here is (a) a graphical sequence logo created with weblogo. (b) A list of the sequences used in creating this alignment. If the specific genomic location is known, the name is a link that you may click to goto that location, or hovering over it will produce an image of that genomic area. (c) A listing of any known transcription factors that bind these sequences. (d) A listing of different file formats for this alignment.
Manually annotated profile alignments and PWMs are also included in the RegTransBase database. The user may browse the available PWMs and view the associated information (Figure 4), including an alignment, genomic mapping information for each sequence in the alignment, a sequence logo (http://weblogo.berkeley.edu/) (17), information about the transcription factor thought to bind these sequences, and PWMs in various formats.
In the present version, the database contains tools for searching genomes with an existing library of manually curated PWMs as a query. In the present version, the following search scenarios are supported:
Search for candidate sites for a given regulator in a given genome or a group of genomes. Candidate sites may be filtered so that only conserved sites upstream of orthologous genes are reported.
Search for candidate sites for all regulators in a given genome region.
Search for sites using user-defined matrices or aligned sites.
Future work
RegTransBase aims to add additional modules for the prediction and comparison of regulons within prokaryotes. We plan on allowing a user to search genomes using PWMs or user-supplied alignments. This will allow a user to analyze all hits for a given PWM on a genome; compare hits on a specific PWM from multiple genomes; explore the regulon of a particular transcription factor across genomes, and determine possible regulation factors of a given gene.
We will continue updating RegTransBase with new genomes from the RefSeq database twice per year and all existing annotations will be re-mapped to those new genomes. New tools will be added as they are tested and developed. In order to increase the functionality and usefulness of our site, we will be integrating it with large microbial genome analysis systems, both the MicrobesOnLine (18) and IMG (19) databases.
New articles will be added to the database when available. Our main focus will be on articles and experiments which use already sequenced organisms as this provides the best data possible for mapping elements to locations.
SUPPLEMENTARY DATA
Supplementary Data are available at NAR Online.
Acknowledgments
Creation of RegTransBase was partially supported by the Howard Hughes Medical Institute (grant 55005610), INTAS (grant 05-1000008-8028), Russian Academy of Sciences (Program ‘Molecular and Cellular Biology’), Integrated Genomics, Inc. This work was part of the Virtual Institute for Microbial Stress and Survival (http://VIMSS.lbl.gov) supported by the US Department of Energy, Office of Science, Office of Biological and Environmental Research, Genomics Program:GTL through contract DE-AC02-05CH11231 between Lawrence Berkeley National Laboratory and the US Department of Energy. Funding to pay the Open Access publication charges for this article was provided by Virtual Institute for Microbial Stress and Survival.
Conflict of interest statement. None declared.
REFERENCES
- 1.Liolios K., Tavernarakis N., Hugenholtz P., Kyrpides N.C. The Genomes On Line Database (GOLD) v.2: a monitor of genome projects worldwide. Nucleic Acids Res. 2006;34:D332–D334. doi: 10.1093/nar/gkj145. [DOI] [PMC free article] [PubMed] [Google Scholar]
- 2.Salgado H., Gama-Castro S., Peralta-Gil M., Diaz-Peredo E., Sanchez-Solano F., Santos-Zavaleta A., Martinez-Flores I., Jimenez-Jacinto V., Bonavides-Martinez C., Segura-Salazar J., et al. RegulonDB (version 5.0): Escherichia coli K-12 transcriptional regulatory network, operon organization, and growth conditions. Nucleic Acids Res. 2006;34:D394–D397. doi: 10.1093/nar/gkj156. [DOI] [PMC free article] [PubMed] [Google Scholar]
- 3.Makita Y., Nakao M., Ogasawara N., Nakai K. DBTBS: database of transcriptional regulation in Bacillus subtilis and its contribution to comparative genomics. Nucleic Acids Res. 2004;32:D75–D77. doi: 10.1093/nar/gkh074. [DOI] [PMC free article] [PubMed] [Google Scholar]
- 4.Robison K., McGuire A.M., Church G.M. A comprehensive library of DNA-binding site matrices for 55 proteins applied to the complete Escherichia coli K-12 genome. J. Mol. Biol. 1998;284:241–254. doi: 10.1006/jmbi.1998.2160. [DOI] [PubMed] [Google Scholar]
- 5.Munch R., Hiller K., Barg H., Heldt D., Linz S., Wingender E., Jahn D. PRODORIC: prokaryotic database of gene regulation. Nucleic Acids Res. 2003;31:266–269. doi: 10.1093/nar/gkg037. [DOI] [PMC free article] [PubMed] [Google Scholar]
- 6.Munch R., Hiller K., Grote A., Scheer M., Klein J., Schobert M., Jahn D. Virtual Footprint and PRODORIC: an integrative framework for regulon prediction in prokaryotes. Bioinformatics. 2005;21:4187–4189. doi: 10.1093/bioinformatics/bti635. [DOI] [PubMed] [Google Scholar]
- 7.Martinez-Bueno M., Molina-Henares A.J., Pareja E., Ramos J.L., Tobes R. BacTregulators: a database of transcriptional regulators in bacteria and archaea. Bioinformatics. 2004;20:2787–2791. doi: 10.1093/bioinformatics/bth330. [DOI] [PubMed] [Google Scholar]
- 8.Pareja E., Pareja-Tobes P., Manrique M., Pareja-Tobes E., Bonal J., Tobes R. ExtraTrain: a database of Extragenic regions and Transcriptional information in prokaryotic organisms. BMC Microbiol. 2006;15(6):29. doi: 10.1186/1471-2180-6-29. [DOI] [PMC free article] [PubMed] [Google Scholar]
- 9.Yellaboina S., Seshadri J., Kumar M.S., Ranjan A. PredictRegulon: a web server for the prediction of the regulatory protein binding sites and operons in prokaryote genomes. Nucleic Acids Res. 2004;32:W318–W320. doi: 10.1093/nar/gkh364. [DOI] [PMC free article] [PubMed] [Google Scholar]
- 10.Gonzalez A.D., Espinosa V., Vasconcelos A.T., Perez-Rueda E., Collado-Vides J. TRACTOR_DB: a database of regulatory networks in gamma-proteobacterial genomes. Nucleic Acids Res. 2005;33:D98–D102. doi: 10.1093/nar/gki054. [DOI] [PMC free article] [PubMed] [Google Scholar]
- 11.Wheeler D.L., Barrett T., Benson D.A., Bryant S.H., Canese K., Chetvernin V., Church D.M., DiCuccio M., Edgar R., Federhen S., et al. Database resources of the National Center for Biotechnology Information. Nucleic Acids Res. 2006;34:D173–D180. doi: 10.1093/nar/gkj158. [DOI] [PMC free article] [PubMed] [Google Scholar]
- 12.Pruitt K.D., Tatusova T., Maglott D.R. NCBI Reference Sequence (RefSeq): a curated non-redundant sequence database of genomes, transcripts and proteins. Nucleic Acids Res. 2005;33:D501–D504. doi: 10.1093/nar/gki025. [DOI] [PMC free article] [PubMed] [Google Scholar]
- 13.Stajich J.E., Block D., Boulez K., Brenner S.E., Chervitz S.A., Dagdigian C., Fuellen G., Gilbert J.G., Korf I., Lapp H., et al. The Bioperl toolkit: Perl modules for the life sciences. Genome Res. 2002;12:1611–1618. doi: 10.1101/gr.361602. [DOI] [PMC free article] [PubMed] [Google Scholar]
- 14.Tatusov R.L., Fedorova N.D., Jackson J.D., Jacobs A.R., Kiryutin B., Koonin E.V., Krylov D.M., Mazumder R., Mekhedov S.L., Nikolskaya A.N., et al. The COG database: an updated version includes eukaryotes. BMC Bioinformatics. 2003;11(4):41. doi: 10.1186/1471-2105-4-41. [DOI] [PMC free article] [PubMed] [Google Scholar]
- 15.Frazer K.A., Pachter L., Poliakov A., Rubin E.M., Dubchak I. VISTA: computational tools for comparative genomics. Nucleic Acids Res. 2004;32:W273–W279. doi: 10.1093/nar/gkh458. [DOI] [PMC free article] [PubMed] [Google Scholar]
- 16.Stein L.D., Mungall C., Shu S., Caudy M., Mangone M., Day A., Nickerson E., Stajich J.E., Harris T.W., Arva A., et al. The generic genome browser: a building block for a model organism system database. Genome Res. 2002;12:1599–1610. doi: 10.1101/gr.403602. [DOI] [PMC free article] [PubMed] [Google Scholar]
- 17.Crooks G.E., Hon G., Chandonia J.M., Brenner S.E. WebLogo: a sequence logo generator. Genome Res. 2004;14:1188–1190. doi: 10.1101/gr.849004. [DOI] [PMC free article] [PubMed] [Google Scholar]
- 18.Alm E.J., Huang K.H., Price M.N., Koche R.P., Keller K., Dubchak I.L., Arkin A.P. The MicrobesOnline Web site for comparative genomics. Genome Res. 2005;15:1015–1022. doi: 10.1101/gr.3844805. [DOI] [PMC free article] [PubMed] [Google Scholar]
- 19.Markowitz V.M., Korzeniewski F., Palaniappan K., Szeto E., Werner G., Padki A., Zhao X., Dubchak I., Hugenholtz P., Anderson I., et al. The integrated microbial genomes (IMG) system. Nucleic Acids Res. 2006;34:D344–D348. doi: 10.1093/nar/gkj024. [DOI] [PMC free article] [PubMed] [Google Scholar]


