Abstract
A rapid, noninvasive technique involving imaging of chlorophyll fluorescence parameters for detecting perturbations of leaf metabolism and growth in seedlings is described. Arabidopsis seedlings were grown in 96-well microtitre plates for 4 d and then treated with eight herbicides with differing modes of action to induce perturbations in a range of different metabolic processes. Imaging of chlorophyll fluorescence emissions from 96 seedlings growing on a microtitre plate enabled images of a number of fluorescence parameters to be rapidly and simultaneously produced for the plants in each well. Herbicideinduced perturbations in metabolism, even in metabolic reactions not directly associated with photosynthetic metabolism, were detected from the changes in the images of fluorescence parameters considerably before any visual effects on seedling growth were observed. Evaluations of seedling growth were made from measurements of the area of chlorophyll fluorescence emission in images of plants growing in the 96-well plates. Decreased seedling growth related directly to herbicideinduced changes in the imaged chlorophyll fluorescence parameters. The applicability of this rapid-screening technique for metabolic perturbations in monocotyledonous species was demonstrated by treating Agrostis tenuis seedlings with Imazapyr, an inhibitor of branched-chain amino acid synthesis.
In many areas of plant biology and agrochemical research, there is an increasing requirement for more rapid-screening techniques to identify plants with impaired metabolism and growth. The rapid expansion of Arabidopsis genomics research programs has highlighted the need for new technologies to facilitate the identification of potentially interesting mutants with genetic modifications that impair specific metabolic reactions and growth (e.g. Borevitz et al., 2000; Nakazawa et al., 2001). Also, within the agrochemical industry, more efficient screening processes for crop protection chemical discovery are needed to deal effectively with the increases in the numbers of molecules entering the initial cascade of screening. For many years, conventional screening methods involved screening 5,000 to 20,000 new chemical entities per year in greenhouse screens, which for herbicides involved pot-grown plants in greenhouses (Evans, 1999). Combinatorial chemistry can provide at least a 10-fold increase in the numbers of molecules for screening, however, quantities of each molecule are normally less than 1 to 2 mg, which is insufficient for conventional greenhouse screens. In parallel to the introduction of combinatorial chemistry has been the introduction of new microscreening or high-throughput screening, which, for herbicide screening, involves growing plants in 96-well microtitre plates (Berg et al., 1999; Evans, 1999). In the past, conventional greenhouse screening has involved detailed visual assessment of herbicidal activity over a 2- to 3-week period following treatment. This is not possible using microscreening or high-throughput screening, and less time-consuming and automated assessment procedures are required (Ridley et al., 1998).
It has long been known that chlorophyll fluorescence emission kinetics from plants provide an indicator of plant photosynthetic performance (McAllister and Myers, 1940; Kautsky and Zedlitz, 1941; Kautsky et al., 1960). More recently, fluorescence parameters have been shown to relate directly to the photosynthetic CO2 assimilation rate of leaves (Genty et al., 1989, 1990; Cornic and Ghashghaie, 1991; Harbinson et al., 1990; Krall and Edwards, 1990, 1991; Krall et al., 1991; Edwards and Baker, 1993; Siebke et al., 1997) and have been widely used to study leaf photosynthetic performance (see Maxwell and Johnson, 2000). Consequently, it is no surprise to find that perturbations of photosynthetic metabolism significantly modify fluorescence emission kinetic characteristics of plants. However, there is also evidence that many inhibitors of metabolic processes that are not directly involved in photosynthetic metabolism can produce modifications to fluorescence kinetics (Blowers, 1989; Percival and Baker, 1991; Crudace, 2000). For example, Glyphosate, which is an inhibitor of 5-enolpyruvylshikimate-3-phosphate that interrupts the biosynthesis of aromatic amino acids by the shikimate pathway, induces large changes in fluorescence induction characteristics (Ireland et al., 1986) associated with modifications in photosynthetic carbon metabolism (Geiger et al., 1986; Shieh et al., 1991; Madsen et al., 1995). Although the mechanistic bases for the effects of such non-photosynthetic inhibitors on fluorescence emission have not been unequivocally identified, it is likely that inhibition of metabolic reactions not involved in photosynthesis will modify the pool sizes of a range of metabolic intermediates, which could feedback and influence the rate of synthesis of key intermediates in photosynthetic metabolism and consequently interfere with the rate of photosynthesis and fluorescence emission characteristics. This sensitivity of chlorophyll fluorescence to perturbations in metabolism coupled with the ease and rapidity that measurements of chlorophyll fluorescence can be made makes fluorescence potentially useful for noninvasive screening to identify metabolic perturbations in leaves. A drawback in the past to using chlorophyll fluorescence has been the small sampling area of commercially available fluorimeters that use fiber optics to collect fluorescence emissions, because measurements could only be made on individual leaves, and consequently, screening large numbers of plants was extremely time consuming. Recently, the development of chlorophyll fluorescence imaging systems that can image fluorescence parameters from areas in excess of 100 cm2 has allowed the application of the technique for the screening of many plants simultaneously.
In this study, we demonstrate how chlorophyll fluorescence imaging can be effectively and rapidly used to identify perturbations of leaf metabolism considerably before the onset of any visual effects on leaf morphology or plant growth. A range of herbicides with differing modes of action was used to perturb leaf metabolism. These have clearly defined molecular targets and were chosen to reflect interference with a range of essential metabolic processes. An analysis is presented of the most appropriate fluorescence induction parameters to use for the rapid detection of such metabolic perturbations and the associated small changes in growth.
RESULTS AND DISCUSSION
Chlorophyll Fluorescence Parameters
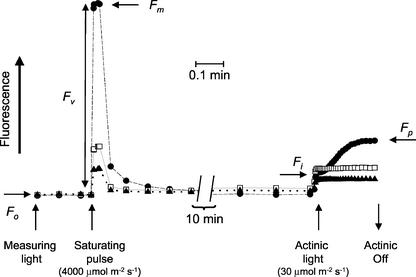
The protocol for taking images of chlorophyll fluorescence and determining fluorescence parameters is shown in Figure 1. When untreated Arabidopsis plants that have been kept in the dark for 15 min are exposed to the weak measuring beam of the fluorescence imaging instrument, chlorophyll fluorescence emission from the plants rises to the minimal level of fluorescence (Fo), which is the fluorescence level obtained when the photosystem II (PSII) centers are in the “open” state (capable of photochemistry). Exposing plants to a saturating light pulse with a photosynthetic photon flux density (PPFD) of approximately 4,000 μmol m–2 s–1 for 0.8 s drives a very high proportion of the PSII centers into the “closed” state (making the capacity for photochemistry close to zero) and results in the maximal level of fluorescence (Fm). After termination of the saturating flash, the fluorescence rapidly falls to a steady state and the plants are then exposed to an actinic PPFD of 30 μmol m–2 s–1, which generates rapidly the transient fluorescence level, Fi, before a peak value of fluorescence, Fp, is reached (Fig. 1). The rapid rise to Fi reflects an increase in the yield of charge stabilization at PSII that is independent of subsequent changes in the redox state of the plastoquinone pool. Changes in the fluorescence level between Fi and Fp are almost entirely due to increased reduction of the plastoquinone pool, which is largely determined by the relative rates of charge stabilization at PSII and plastoquinol oxidation at the cytochrome b6f complex.
Figure 1.
Chlorophyll fluorescence trace illustrating the terminology and sequence of events leading to the acquisition of the raw fluorescence images from the Arabidopsis plants that are required for the construction of images of the fluorescence parameters Fv/Fm, 1–(Fo/Fp), 1–(Fo/Fi), and 1–(Fi/Fp). Plants were dark-adapted for 15 min before being exposed to weak measuring pulses for the measurement of Fo. After 20 s, a saturating pulse of approximately 4,000 μmol m–2 s–1 was applied for 0.8 s to allow imaging of Fm. The plants were then left in the weak measuring beam for approximately 10 min before being exposed to an actinic PPFD of 30 μmol m–2 s–1, and images of Fi and Fp were taken. Traces are shown for control, untreated leaves (•) and for leaves treated with 4 (□) and 8 (▴) mm Imazapyr for 24 h.
It has previously been shown that perturbation of leaf metabolism by a wide range of herbicides with different modes of action will modify the fluorescence induction characteristics of leaves (Blowers, 1989; Crudace, 2000). This can be clearly observed when Arabidopsis leaves are treated with 4 and 8 mm Imazapyr (Fig. 1), a herbicide that inhibits acetolactase synthase and consequently inhibits the synthesis of branched chain amino acids (Shaner et al., 1985; Singh et al., 1989). This would not be expected to have any direct effect on photosynthetic electron transport. Imazapyr causes large depressions in Fm and Fp (Fig. 1). It is possible to usefully quantitate the changes in fluorescence induction characteristics resulting from such metabolic perturbations by using ratios of fluorescence levels (Habash et al., 1985). Absolute fluorescence values (e.g. Fo, Fm, Fi, and Fp) are dependent upon both the photochemical activities and the optical properties of the leaf, which could be markedly modified by differences in chlorophyll content. Consequently, it is essential to remove the variable of leaf optical properties when attempting to compare changes in fluorescence characteristics between different leaf samples. This can be achieved by comparing ratios of fluorescence values. In this study, the suitability of fluorescence parameters Fv/Fm, 1–(Fo/Fp), 1–(Fo/Fi), and 1–(Fi/Fp) for screening of perturbations in leaf metabolism is assessed. Fv/Fm estimates the maximum quantum efficiency of PSII photochemistry (Butler, 1978). The parameters 1–(Fo/Fp), 1–(Fo/Fi), and 1–(Fi/Fp) describe characteristics of the rapid fluorescence induction from Fo to Fp when the dark-adapted leaf is exposed to actinic light, which can be influenced by changes in PSII photochemistry and electron transport processes downstream of PSII.
Fluorescence Changes in Absence of Visual Effects on Growth
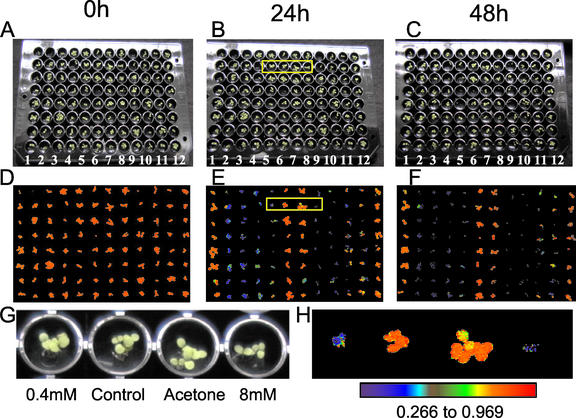
The effects of the application of a range of concentrations (0.4–8 mm) of Imazapyr to 4-d-old Arabidopsis seedlings after 24 and 48 h are shown in Figure 2. After 24 h of treatment, there are no marked visual effects on plant growth and development (Fig. 2, A and B), however marked changes in fluorescence characteristics were observed (Fig. 2, D and E). Images of the fluorescence parameter Fv/Fm, which has been widely used to detect stress in plants (Maxwell and Johnson, 2000), for the plants in the 96-well plate showed that all of the Imazapyr treatments had produced a marked decrease in this parameter after 24 h, with the decreases being greater with increasing concentration (Fig. 2, D, E, G, and H). These large decreases in Fv/Fm in Imazapyr-treated plants in the absence of any visual effects of growth and development demonstrates clearly the potential for the use of chlorophyll fluorescence imaging to rapidly screen for metabolic perturbations. After 48 h, the Imazapyr treatments were observed to inhibit plant growth and development, but the effects on growth were considerably less than the decreases observed in Fv/Fm (Fig. 2, A, C, D, and F).
Figure 2.
Detection of the effects of the herbicide Imazapyr on plant metabolism using chlorophyll fluorescence imaging before the appearance of visual effects on plant growth. A, Four-day-old Arabidopsis plants growing in a 96-well plate immediately before treatment with 0.4 (rows 5 and 11), 0.8 (rows 4 and 10), 4 (rows 3 and 9), and 8 (rows 2 and 8) mm Imazapyr in 50% (v/v) acetone containing 0.1% (v/v) Tween; plants in rows 6 and 12 were untreated controls, and plants in rows 1 and 7 were treated with 50% (v/v) acetone containing 0.1% (v/v) Tween. Plants treated as described for A are shown after 24 and 48 h in B and C, respectively. Images of the chlorophyll fluorescence parameter, Fv/Fm, for the plants shown in A, B, and C are shown in D, E, and F, respectively. G and H, Enlargements of the plants and images of Fv/Fm outlined by the yellow boxes in B and E, respectively. The data in the images of Fv/Fm shown in D, E, F, and H respectively have been mapped to the color palette shown below H.
Assessment of Fluorescence Ratio Parameters for Screening for Metabolic Perturbation
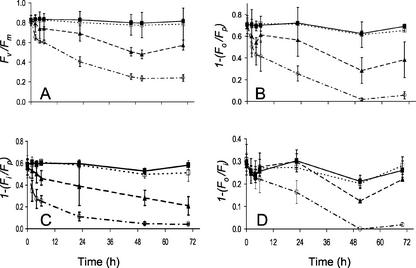
It has been previously shown that herbicideinduced modifications to fluorescence induction kinetics can result in modifications not only to Fv/Fm, but also to the parameters Fo/Fp, Fo/Fi, and Fi/Fp (Habash et al., 1985; see Fig. 1). The changes in Fv/Fm, 1–(Fo/Fp), 1–(Fo/Fi), and 1–(Fi/Fp) with time after spraying the Arabidopsis seedlings with 0.8 or 8 mm Imazapyr are shown in Figure 3. Although all of the parameters decreased with time after treatment, variability in data for 1–(Fo/Fp) and 1–(Fo/Fi) was considerably greater than for Fv/Fm and 1–(Fi/Fp). Significant differences in both Fv/Fm and 1–(Fi/Fp) were observed after only 2 h of treatment with 8 mm Imazapyr, and both parameters could be used for rapid screening. Because Fv/Fm is a widely used parameter that estimates the maximum quantum efficiency of PSII photochemistry and can be determined in less than a second, we suggest this should be the preferred parameter for screening where possible.
Figure 3.
The effects of Imazapyr on chlorophyll fluorescence induction parameters. Changes in the fluorescence parameters Fv/Fm (A), 1–(Fo/Fp) (B), 1–(Fi/Fp) (C), and 1–(Fo/Fi) (D) in Arabidopsis plants with time are shown after treatment with 0.8 mm Imazapyr (▴), 8 mm Imazapyr (○), and 50% (v/v) acetone containing 0.1% (v/v) Tween (□). Untreated controls are indicated by (▪). Data are the means of eight replicates; ses are shown when larger than the symbol.
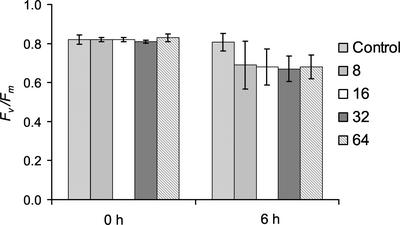
The sensitivity of the fluorescence screen can be improved by increasing the numbers of replicates being imaged. Using eight replicates for the treatment of plants with 0.8 mm Imazapyr (see Fig. 2) the decrease in Fv/Fm only becomes significant after 24 h (Fig. 3A). When the number of replicates imaged was increased to 16, a significant decrease in Fv/Fm at P < 0.05 was observed after only 6 h of treatment (Fig. 4). Increasing the number of replicates to 32 and 64 did not result in an improvement of the P values for significant difference (Fig. 4).
Figure 4.
Effect of increasing the number of replicate data samples on the variability of the decrease in Fv/Fm for Arabidopsis plants after 6 h of treatment with 0.8 mm Imazapyr. Data from eight replicates of untreated plants (control) are shown, together with data from eight, 16, 32, and 64 replicates of treated plants. ses of the means are given. After 6 h, data from eight replicate plants were not significantly different to the controls; data from 16, 32, and 64 replicate plants were similar with significant differences at P < 0.01.
An important potential use of these fluorescence screens will be for the detection of metabolic perturbations in mutagenized plant populations. The very high sensitivity of the screening technique may often result in the identification of very many small metabolic perturbations, which may not be of major interest and on which, due to the large numbers, it would be practically difficult to conduct detailed metabolic analyses. In such cases, it is important to set appropriate selection thresholds for percentage change in the fluorescence parameter to ensure sensible numbers of plants are selected for further time-consuming, detailed analyses that can determine the mechanistic bases of the perturbations.
Applicability of Screen to a Range of Metabolic Perturbations
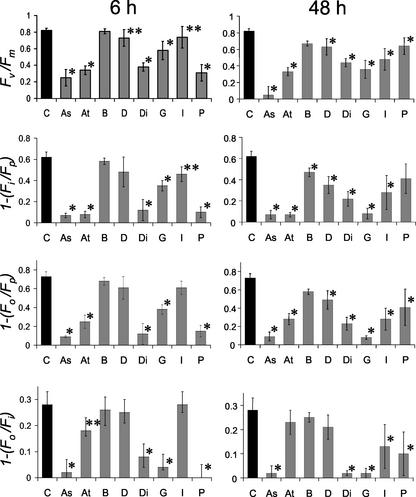
To examine the suitability of the fluorescence screen for identifying a range of metabolic perturbations, Arabidopsis seedlings were treated with seven other herbicides (Asulam, Atrazine, Bifenox, 2,4-dichlorophenoxyacetic acid [2,4-D], Diclofop-methyl, Glyphosate, and Paraquat) with differing modes of action (see Table I), and the fluorescence parameters were imaged. The changes in Fv/Fm, 1–(Fo/Fp), 1–(Fo/Fi), and 1–(Fi/Fp) 6 and 48 h after spraying the seedlings with these herbicides at their recommended field application rates are shown in Figure 5. After 6 h, significant decreases in all of the fluorescence parameters could be detected for plants treated with Asulam, Atrazine, Diclofop-methyl, Glyphosate, and Paraquat, whereas the changes induced by Bifenox and 2,4-D were not significant. After 48 h, significant decreases in Fv/Fm, 1–(Fo/Fp), and 1–(Fi/Fp) were observed with all of the herbicides, although no significant decreases were observed in 1–(Fo/Fi) of plants treated with Atrazine, 2,4-D, and Bifenox. Clearly, the fluorescence parameters Fv/Fm, 1–(Fo/Fp), and 1–(Fi/Fp) can be used successfully to detect a number of very different metabolic perturbations in leaves.
Table I.
Range of herbicides used to perturb leaf metabolism
The target sites of the herbicides and their primary metabolic effects are given (Cobb and Kirkwood, 2000). The concentrations at which the herbicides were applied to plants as a spray are given and represent the molar concentrations equivalent to the average application rates used in the field (Tomlin, 2000).
| Common Name | Chemical Name | Target Site (Primary Metabolic Effect) | Concentration Applied |
|---|---|---|---|
| mM | |||
| Asulam | Methyl sulfanilylcarbamate | Dihydropteroate synthase (interference with 1-carbon metabolism) | 4.63 |
| Atrazine | 6-Chloro-N2-ethyl-N4-isopropyl-1,6,5-triazine-2,4-diamine | PSII electron transport (inhibition of photosynthetic electron transport) | 1.48 |
| Bifenox | Methyl-5-[2,4-dichlorophenoxy]-2-nitrobenzoate | Protoporphyrinogen oxidase (porphyrin synthesis) | 0.6 |
| 2,4-D | [2,4-Dichlorophenoxy]acetic acid | Auxin mimic (hormonal imbalance) | 1.24 |
| Diclofop-methyl | [RS]-2-[4-(2,4-Dichloropphenoxy)phenoxy]propanoic acid | Acetyl CoA carboxylase (inhibition of fatty acid biosynthesis) | 0.65 |
| Glyphosate | n-[Phosphonomethyl]glycine | Enol-pyruvyl shikimate phosphate synthetase (inhibition of aromatic amino acid synthesis) | 3.9 |
| Imazapyr | 2-[4-Isopropyl-4-methyl-5-oxo-2-imidazolin-2-yl]nicotinic acid | Acetolactase synthase (inhibition of branched chain amino acid synthesis) | 0.8 |
| Paraquat | 1,1′-Dimethyl-4,4′-bipyridinium dichloride | PSI (diversion of photosynthetic electron transport from NADP) | 1.13 |
Figure 5.
Effects of a range of herbicides with differing modes of action on Fv/Fm, 1–(Fi/Fp), 1–(Fo/Fp), and 1–(Fo/Fi) of Arabidopsis plants. Plants were treated with Asulam (As), Atrazine (At), Bifenox (B), 2,4-D (D), Diclofop-methyl (Di), Glyphosate (G), Imazapyr (I), and Paraquat (P) at the recommended concentrations for average field applications (see Table I) and measurements made after 6 and 48 h. Data for control, untreated plants (C) are given. * and ** indicate that the herbicide treatment produced a significant difference from the control at P < 0.01 and P < 0.05, respectively.
Suitability of Screen for Other Species
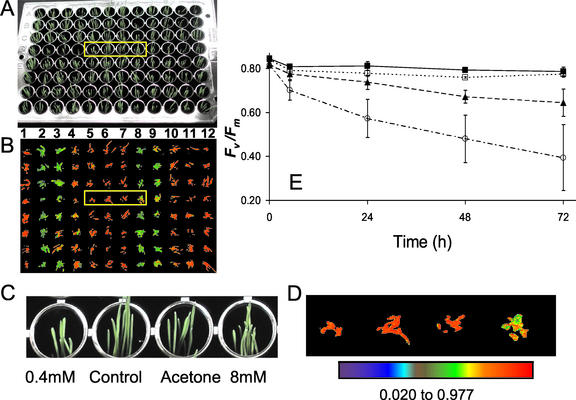
Although there is a considerable need to develop improved screening techniques for metabolic deficiencies in Arabidopsis, this is not a good model for studying metabolic perturbations in monocotyledonous species. A number of herbicides specifically target monocotyledonous species by exploiting metabolic differences between monocotyledonous and dicotyledonous plants (Devine and Preston, 2000). To evaluate the effectiveness of the fluorescence imaging technique for monocotyledonous species, screening experiments were also performed on Agrostis tenuis. The effects of a range of concentrations (0.4–8 mm) of Imazapyr on growth and Fv/Fm are shown in Figure 6. Although Imazapyr inhibits growth of A. tenuis and decreases Fv/Fm after 48 h of treatment, the effects are not as large as observed for Arabidopsis (Fig. 2). Presumably, this is due to a lower interception and retention of the herbicide spray by the upright monocotyledonous leaves compared with the planar leaves of Arabidopsis. However, significant decreases in Fv/Fm for plants treated with both 4 and 8 mm Imazapyr were detected after only 6 h of treatment (Fig. 6E). As was the case with Arabidopsis, similar decreases in the fluorescence parameters 1–(Fo/Fp) and 1–(Fi/Fp) were also observed for A. tenuis (data not shown). A range of herbicides similar to that applied to Arabidopsis, as shown in Figure 5, was found to induce decreases in Fv/Fm, 1–(Fo/Fp), 1–(Fo/Fi), and 1–(Fi/Fp) and confirmed the applicability of the fluorescence imaging screen for A. tenuis.
Figure 6.
Detection of the effects of the herbicide Imazapyr on plant metabolism in A. tenuis using chlorophyll fluorescence imaging. A, Four-day-old plants growing in a 96-well plate after treatment for 48 h with 0.4 (rows 5 and 11), 0.8 (rows 4 and 10), 4 (rows 3 and 9), and 8 (rows 2 and 8) mm Imazapyr in 50% (v/v) acetone containing 0.1% (v/v) Tween; plants in rows 6 and 12 were untreated controls, and plants in rows 1 and 7 had been treated with 50% (v/v) acetone containing 0.1% (v/v) Tween. Images of the chlorophyll fluorescence parameter, Fv/Fm, for the plants shown in A are shown in B. C and D, Enlargements of the plants and images of Fv/Fm outlined by the yellow boxes in A and B, respectively. The data in the images of Fv/Fm shown in B and D, respectively, have been mapped to the color palette shown below D. E, Changes in Fv/Fm with time after treatment of plants with 0.8 mm Imazapyr (▴), 8 mm Imazapyr (○), and 50% (v/v) acetone containing 0.1% (v/v) Tween (□). Untreated controls are indicated by (▪). Data are the means of eight replicates; ses are shown when larger than the symbol.
Previously, experiments with a range of other species (Alopecurus myosuroides, Avena fatua, bean [Phaseolus vulgaris], white mustard [Sinapis alba], wheat [Triticum aestivum], and maize [Zea mays]) have also demonstrated the wide applicability of these fluorescence parameters for the detection herbicideinduced perturbations of metabolism (Habash et al., 1985; Blowers, 1989; Crudace, 2000). Consequently, fluorescence imaging would be expected to provide a rapid and sensitive screen for these species.
Relationship between Leaf Growth and Fv/Fm
The software of the chlorophyll fluorescence imaging system allows determination of the area within each well of the microtitre plate that generates a fluorescence signal. The calculation of this area is independent of chlorophyll concentration and fluorescence yield. Consequently, provided chlorophyll is distributed across the whole of the leaf, i.e. there are no achlorophyllous regions as found in variegated leaves, leaf area can be estimated accurately from the area of chlorophyll fluorescence emission at the Fm level taken from images. Measurements of the fluorescent leaf area can be used to give a rapid and accurate indication of plant growth at early stages of plant development when it can be difficult to detect differences in growth by eye.
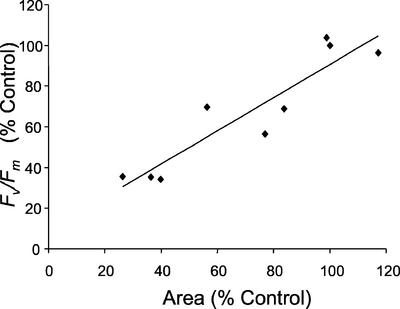
In Arabidopsis, the decreases in the fluorescence parameters induced by treatment with Imazapyr (Figs. 2 and 3) would be expected to result in decreases in photosynthetic productivity and growth. The relationship between the decreases in Fv/Fm and the fluorescent area for plants treated with 0.4, 0.8, and 4 mm Imazapyr for 6 and 48 h is shown in Figure 7. A strong correlation exists between Fv/Fm and the area of leaves exhibiting chlorophyll fluorescence, thus demonstrating that Fv/Fm is a good indicator of plant growth in these experiments. A similar close correlation between 1–(Fi/Fp) and leaf area was also observed (data not shown), confirming that this fluorescence parameter could also be used as an effective screen for metabolic perturbation of plant growth.
Figure 7.
The relationship between Fv/Fm and leaf area for Arabidopsis plants treated with 0.4, 0.8, and 4 mm Imazapyr for 6 and 48 h. Each point represents the mean values of eight replicates of Fv/Fm and fluorescent leaf area calculated from images of Fv/Fm (as shown in Fig. 3) and Fm. The relationship between Fv/Fm and fluorescent leaf area is given by y = 0.816x + 0.09 with R2 = 0.851.
The area emitting fluorescence from the leaves of Arabidopsis seedlings growing in 96-well microtitre plates is a good indicator of plant growth because the leaves are planophile with little overlap at early growth stages. However, when there is considerable overlap of leaves or for non-planophile leaf growth, as shown by monocotyledonous plants such as A. tenuis, this may not be always the case. No clear relationship was found in A. tenuis leaves treated with Imazapyr between Fv/Fm and the area of leaves exhibiting chlorophyll fluorescence (data not shown), presumably due to the considerable overlapping of the leaves preventing accurate determinations of area. Careful examination of the relationship between fluorescent leaf area and growth should be made for any experimental system before routinely using fluorescent area to screen for growth differences.
CONCLUSIONS
This study has demonstrated the effectiveness of chlorophyll fluorescence imaging for rapidly detecting perturbations in leaf metabolism before any effects on growth and development are visually detected. An important advantage of fluorescence imaging over integrated measurements of fluorescence using conventional fluorimeters for screening of metabolic perturbations is the ability to monitor simultaneously 96 seedlings growing in a 96-well microtitre plate. Larger plants can be also be screened in larger well-plate formats, but increasing plant size will obviously decrease the number of plants that can be screened simultaneously. It should be stressed that not all metabolic perturbations will be detected by fluorescence imaging, but a surprisingly large proportion will be. This screen will not detect alterations in metabolism that do not impact directly or indirectly on photosynthetic metabolism. However, many perturbations of metabolic reactions that would not be predicted to be linked in any way with photosynthetic metabolism have been found to modify chlorophyll fluorescence.
Chlorophyll fluorescence imaging can also be used for rapidly estimating differences in growth of seedlings with planophile, nonoverlapping leaves. The total area from which fluorescence at Fm is emitted from each plant is directly related to leaf area that contains chlorophyll. For seedlings with nonplanophile growth habit or which have large areas of leaf overlap, the correlation between the fluorescent leaf area and plant growth can be poor and should be examined carefully before using the fluorescencent area to screen for growth differences.
MATERIALS AND METHODS
Plant Material
Seeds of Arabidopsis were soaked in sterilized water containing 0.1% (v/v) Tween 20 for 30 min and then sterilized by adding an equal volume of commercial bleach containing approximately 7% (w/v) sodium hypochlorite and shaking for 90 s. The seeds were then washed six times in sterilized water, kept in the dark at 4°C for 4 d and sown into sterilized 0.8% (w/v) agar containing Murashige and Skoog basal medium (Murashige and Skoog, 1962) at pH 7 in black plastic, 96-well microtitre plates (NUNC, New York). Two seeds of Arabidopsis were sown in each well containing 200 μL of the growth medium, and the plates were placed inside plant propagators on a layer of capillary matting soaked in water. The plant propagators were then placed in a controlled environment cabinet (SGC066, Fitotron, Sanyo Gallenkamp, Leicester, UK) and grown at 25°C and under a PPFD of 400 μmol m–2 s–1 during a 12-h photoperiod.
Agrostis tenuis plants were similarly grown from seed except that the growth medium was sterilized 0.8% (w/v) agar and eight seeds were sown in each well. Plants were treated with herbicides 4 d after sowing.
Herbicide Application
A range of herbicides with differing modes of action were applied to leaves as a spray at molar concentrations determined from their average field use rates (grams or kilograms per hectare) given by Tomlin (2000; see Table I), unless otherwise stated. All of the herbicides, except Glyphosate, were dissolved in 50% (v/v) acetone containing 0.1% (v/v) Tween 20, which was added to enhance foliar uptake. Glyphosate was dissolved in water. All herbicides were applied to the plants using a fine hypodermic needle to deliver 10-μL volumes to each well. Treatment of plants with 50% (v/v) acetone containing 0.1% (v/v) Tween 20 had no effect on the growth of plants or their chlorophyll fluorescence emission characteristics (see Figs. 3 and 4A).
Chlorophyll Fluorescence Imaging
Images of chlorophyll fluorescence parameters were obtained using a FluorImager chlorophyll fluorescence imaging system (Technologica Ltd., Colchester, UK). All lighting (actinic, saturating pulses for measurement of Fm and Fm′ and the measuring pulses applied while imaging) is provided from 16 banks of 100 blue light-emitting diodes (peak output 470 nm). The required incident PPFD at any point is generated through pulse-width modulation at constant voltage, which maintains a constant spectral output. Images are taken using an asynchronous progressive scan CCD camera, which is synchronized to the measuring pulses from the light emitting diodes. Fo was measured during the weak measuring pulses. Fm was measured during an 800-ms exposure to a PPFD of approximately 4,000 μmol m–2 s–1. During the last 650 ms, the camera took a train of images at 20 Hz (2-ms exposures at low camera gain). The program then searches these images for the one with the highest mean value. This image is saved and is used in construction of the Fv/Fm image.
For a usable fluorescence image to be generated, the CCD must absorb a minimum number of photons. Increasing the exposure time and/or incident, PPFD will increase the number of photons accumulated. However, when imaging chlorophyll a fluorescence, increasing either of these will often impact on the de-excitation processes at PSII, a problem that is most acute when imaging Fo. Also, exposure time is often limited by the accumulation of long wavelength photons (dark noise). With the FluorImager system, an Fo image is generated within a 16.7-ms exposure, during which 2-μs pulses (PPFD of 4,000 μmol m–2 s–1) are applied every 300 μs. Although the same number of photons could be delivered during a single pulse of approximately 110 μs at the same PPFD, the long exposure time at low average PPFD has the advantage of allowing for the opening of PSII centers, thereby increasing the accuracy of Fo measurement.
Fi is the inflection in fluorescence level that occurs during the rapid rise in fluorescence when a dark-adapted leaf is exposed to actinic light (Fig. 1; Habash et al., 1985). In these experiments, plants were exposed to an actinic PPFD of 30 μmol m–2 s–1, and Fi was measured after 50 ms. Fp is the highest point of the fluorescence rise after exposure of the dark-adapted leaf to 30 μmol m–2 s–1 of actinic light (Fig. 1).
Although up to 16 fluorescence traces can be generated from different areas of the image simultaneously, only one complete trace (which represented a mean of the entire well plate) was routinely generated during these experiments. The FluorImager system allows for images to be divided into 96 zones (one for each well of the micotitre plate in which Arabidopsis plants are grown) through the application of horizontal and vertical lines. The program automatically calculates mean values from each zone and also determines the active (fluorescent) area within each zone. Fluorescence induction curves are also generated for each zone, and images of 1–(Fo/Fp), 1–(Fo/Fi), and 1–(Fi/Fp) were constructed. All nonimage data (induction curves from each zone and fluorescence parameter values) were copied and pasted into Excel (Microsoft Corporation, Redmond, WA) for analysis.
The FluorImager software allows determination of the area that has generating a fluorescence signal in any given image. Calculation of this area is independent of chlorophyll concentration and fluorescence yield. For Arabidopsis plants, the area of leaf in each well was estimated from the area of the fluorescence emission at the Fm level and was used to monitor plant growth.
Article, publication date, and citation information can be found at www.plantphysiol.org/cgi/doi/10.1104/pp.102.018093.
This work was supported by the European Commission under the Marie Curie Industrial Host Fellowship Program (grant no. HPMI–CT–1999–00085 to Bayer CropScience GmbH).
References
- Berg D, Tiejten K, Wollweber D, Hain R (1999) From genes to targets: impact of genomics on herbicide discovery. Proc Br Crop Protection Council Conf Weeds 2: 491–500 [Google Scholar]
- Blowers MH (1989) Applications of chlorophyll fluorescence to study the penetration of herbicides into leaves. PhD thesis. University of Essex, Colchester, UK
- Borevitz JO, Xia YJ, Blount J, Dixon RA, Lamb C (2000) Activation tagging identifies a conserved MYB regulator of phenylpropanoid biosynthesis. Plant Cell 12: 2383–2393 [DOI] [PMC free article] [PubMed] [Google Scholar]
- Butler WL (1978) Energy distribution in the photochemical apparatus of photosynthesis. Annu Rev Plant Physiol 29: 345–378 [Google Scholar]
- Cornic G, Ghashghaie J (1991) Effect of temperature on net CO2 assimilation and photosystem II quantum yield on electron transfer of French bean leaves (Phaseolus vulgaris L.) during drought stress. Planta 183: 178–184 [DOI] [PubMed] [Google Scholar]
- Crudace AJ (2000) The investigation of the in vivo behaviour of a maize herbicide: Isoxaflutole. PhD thesis. University of Essex, Colchester, UK
- Cobb AH, Kirkwood RC (2000) Herbicides and their Mechanisms of Action. Sheffield Academic Press, Sheffield, UK
- Devine MD, Preston C (2000) The molecular basis of herbicide resistance. In AH Cobb, RC Kirkwood, eds, Herbicides and their Mechanisms of Action. Sheffield Academic Press, Sheffield, UK, pp 72–104
- Edwards GE, Baker NR (1993) Can CO2 assimilation in maize leaves be predicted accurately from chlorophyll fluorescence analysis? Photosynth Res 37: 89–102 [DOI] [PubMed] [Google Scholar]
- Evans DA (1999) How can technology feed the world safely and sustainably. In GT Brooks, TR Roberts, eds, Pesticide Chemistry and Bioscience: The Food-Environment Challenge. Royal Society of Chemistry, London, pp 3–24
- Geiger DR, Kapitan SW, Tucci MA (1986) Glyphosate inhibits photosynthesis and allocation of carbon to starch in sugar-beet leaves. Plant Physiol 82: 468–472 [DOI] [PMC free article] [PubMed] [Google Scholar]
- Genty B, Briantais J-M, Baker NR (1989) The relationship between the quantum yield of photosynthetic electron transport and quenching of chlorophyll fluorescence. Biochim Biophys Acta 990: 87–92 [Google Scholar]
- Genty B, Harbinson J, Baker NR (1990) Relative quantum efficiencies of the two photosystems of leaves in photorespiratory and nonphotorespiratory conditions. Plant Physiol Biochem 28: 1–10 [Google Scholar]
- Habash D, Percival MP, Baker NR (1985) Rapid chlorophyll fluorescence technique for the study of penetration of photosynthetically active herbicides into leaf tissue. Weed Res 25: 389–395 [Google Scholar]
- Harbinson J, Genty B, Baker NR (1990) The relationship between CO2 assimilation and electron transport in leaves. Photosynth Res 25: 213–224 [DOI] [PubMed] [Google Scholar]
- Ireland CR, Percival MP, Baker NR (1986) Modification of the induction of photosynthesis in wheat by glyphosate, an inhibitor of amino acid metabolism. J Exp Bot 37: 299–308 [Google Scholar]
- Kautsky H, Apel W, Amann H (1960) Chlorophyllfluorescenz und Kohlensaureassimilation. Biochem Z 322: 277–292 [Google Scholar]
- Kautsky H, Zedlitz W (1941) Fluoreszenzkurven von Chloroplasten-Grana. Naturwissenschaften 29: 101–102 [Google Scholar]
- Krall JP, Edwards GE (1990) Quantum yields of photosystem II electron transport and CO2 fixation in C4 plants. Aust J Plant Physiol 17: 579–588 [Google Scholar]
- Krall JP, Edwards GE (1991) Environmental effects on the relationship between quantum yield of carbon assimilation and in vivo PS II electron transport in maize. Aust J Plant Physiol 18: 267–278 [Google Scholar]
- Krall JP, Edwards GE, Ku MSB (1991) Quantum yield of photosystem II and efficiency of CO2 fixation in Flaveria (Asteraceae) species under varying light and CO2. Aust J Plant Physiol 18: 369–383 [Google Scholar]
- Madsen KH, Heitholt JJ, Duke SO, Smeda RJ, Streibig JC (1995) Photosynthetic parameters in glyphosate-treated sugar-beet (Beta vulgaris L.). Weed Res 32: 81–88 [Google Scholar]
- Maxwell K, Johnson GN (2000) Chlorophyll fluorescence: a practical guide. J Exp Bot 51: 659–668 [DOI] [PubMed] [Google Scholar]
- McAllister ED, Myers J (1940) The time course of photosynthesis and fluorescence observed simultaneously. Smithson Misc Collect 99: 1–37 [Google Scholar]
- Murashige T, Skoog F (1962) A revised medium for rapid growth and bioassays with tobacco tissue cultures. Physiol Plant 15: 473–497 [Google Scholar]
- Nakazawa M, Yabe N, Ichikawa T, Yamamoto YY, Yoshizumi T, Hasunuma K, Matsui M (2001) DFL1, an auxin-responsive GH3 gene homologue, negatively regulates shoot cell elongation and lateral root formation, and positively regulates the light response of hypocotyls length. Plant J 25: 213–221 [DOI] [PubMed] [Google Scholar]
- Percival MP, Baker NR (1991) Herbicides and photosynthesis. In NR Baker, MP Percival, eds, Herbicides. Elsevier Science Publishers B.V., Amsterdam
- Ridley SM, Elliott AC, Yeung M, Youle D (1998) High-throughput screening as a tool for agrochemical discovery: automated synthesis, compound input, assay design and process management. Pestic Sci 54: 327–337 [Google Scholar]
- Shaner D, Stidham M, Muhitch M, Reider M, Robson P (1985) Mode of action of the imidazolinones. Proc Br Crop Protection Council Conf Weeds 1: 147–154 [Google Scholar]
- Shieh WJ, Geiger DR, Servaites JC (1991) Effect of N-phosphonomethyl glycine on carbon assimilation and metabolism during a simulated natural day. Plant Physiol 97: 1109–1114 [DOI] [PMC free article] [PubMed] [Google Scholar]
- Siebke K, von Caemmerer S, Badger M, Furbank RT (1997) Expressing an RbcS antisense gene in transgenic Flaveria bidentis leads to an increased quantum requirement for CO2 fixed in photosystems I and II. Plant Physiol 105: 1163–1174 [DOI] [PMC free article] [PubMed] [Google Scholar]
- Singh BK, Newhouse KE, Stidham MA, Shaner DL (1989) Acetohydroxy-acid synthase-imidazolinone interaction. In LC Copping, J Dalziel, AD Dodge, eds, Prospects for Amino Acid Biosynthesis Inhibitors in Crop Protection and Pharmaceutical Chemistry. British Crop Protection Council Monograph No. 42. British Crop Protection Council, Farnham, UK, pp 87–95
- Tomlin CDS, ed (2000). The Pesticide Manual, Ed 12. British Crop Protection Council, Farnham, UK


