Abstract
Nep1 is an extracellular fungal protein that causes necrosis when applied to many dicotyledonous plants, including invasive weed species. Using transmission electron microscopy, it was determined that application of Nep1 (1.0 μg mL–1, 0.1% [v/v] Silwet-L77) to Arabidopsis and two invasive weed species, spotted knapweed (Centaurea maculosa) and dandelion (Taraxacum officinale), caused a reduction in the thickness of the cuticle and a breakdown of chloroplasts 1 to 4 h after treatment. Membrane breakdown was most severe in cells closest to the surface of application. Differential display was used to isolate cDNA clones from the three species showing differential expression in response to Nep1 treatment. Differential gene expression was observed for a putative serpin (CmSER-1) and a calmodulin-like (CmCAL-1) protein from spotted knapweed, and a putative protein phosphatase 2C (ToPP2C-1) and cytochrome P-450 (ToCYP-1) protein from dandelion. In addition, differential expression was observed for genes coding for a putative protein kinase (AtPK-1), a homolog (AtWI-12) of wound-induced WI12, a homolog (AtLEA-1) of late embryogenesis abundant LEA-5, a WRKY-18 DNA-binding protein (AtWRKY-18), and a phospholipase D (AtPLD-1) from Arabidopsis. Genes showing elevated mRNA levels in Nep1-treated (5 μg mL–1, 0.1% [v/v] Silwet-L77) leaves 15 min after Nep1 treatment included CmSER-1 and CmCAL-1 for spotted knapweed, ToCYP-1 and CmCAL-1 for dandelion, and AtPK-1, AtWRKY-18, AtWI-12, and AtLEA-1 for Arabidopsis. Levels of mRNA for AtPLD-1 (Arabidopsis) and ToPP2C-1 (dandelion) decreased rapidly in Silwet-l77-treated plants between 15 min and 4 h of treatment, but were maintained or decreased more slowly over time in Nep1-treated (5 μg mL–1, 0.1% [v/v] Silwet-L77) leaves. In general, increases in mRNA band intensities were in the range of two to five times, with only ToCYP-1 in dandelion exceeding an increase of 10 times. The identified genes have been shown to be involved or are related to gene families that are involved in plant stress responses, including wounding, drought, senescence, and disease resistance.
The necrosis-inducing protein Nep1 is an extracellular protein produced by Fusarium oxysporum in liquid cultures (Bailey, 1995; Bailey et al., 1997). The gene for Nep1 has been cloned (GenBank accession no. AF036580) and partially characterized (Nelson et al., 1998; Bailey et al., 2002). Antigenically related proteins of similar size and activity are produced by Fusarium accuminatum and Fusarium avenaceum (Bailey et al., 1997). Subsequent to the original isolation and characterization of NEP1, related gene and gene products have been identified (GenBank) as being produced by species of Pythium, Streptomyces, Phytophthora, and other genera, which demonstrates that Nep1-related proteins are widely produced by taxonomically divergent microorganisms. Nep1 production was disrupted in F. oxysporum f. sp. erythroxyli using gene replacement, thus providing evidence that Nep1 production is not critical to development of Fusarium wilt of Erythroxylum coca (Bailey et al., 2002).
Nep1 kills cells of many different dicotyledonous plants but does not damage monocots (Bailey, 1995; Jennings et al., 2000). Nep1 defoliates some dicotyledonous weed species in a manner similar to a contact herbicide when applied as a foliar spray (Bailey et al., 2000b; Jennings et al., 2000). Nep1 can be combined with the herbicides 2,4-dichlorophenoxyacetic acid or glyphosphate (Bailey et al., 2000b). The application of the Nep1-herbicide combinations to spotted knapweed (Centaurea maculosa) resulted in rapid foliar necrosis caused by Nep1 followed by eventual death of the weed caused by the herbicides (Bailey et al., 2000b). It has also been demonstrated that Nep1 can be applied in combination with the plant pathogen Pleospora papaveracea, which results in enhanced disease development and death of opium poppy (Papaver somniferum; Bailey et al., 2000a).
In addition to necrosis, tobacco (Nicotiana tabacum) cellular responses to Nep1 treatment include ethylene production, active oxygen production, altered cell respiration, K+ and H+ channel fluxes, and altered gene expression (Jennings et al., 2001). Nep1 induces many of the same processes characteristic of elicitors of plant defense responses in plants (Jennings et al., 2000). The protein has not been demonstrated to induce resistance to plant disease and therefore cannot definitively be distinguished from membrane-altering toxins (Jennings et al., 2000). At present, it is unclear what processes allow Nep1 to act as a contact herbicide that promotes plant disease instead of plant defense. The objectives of this research are to begin characterizing the responses of the Arabidopsis and the invasive weeds spotted knapweed and dandelion (Taraxacum officinale) to Nep1 at the cellular level using transmission electron microscopy and at the molecular level using differential display. The knowledge gained should help our understanding of how Nep1 acts on plant cells and should provide clues as to how Nep1 can be exploited as a biologically produced herbicide.
RESULTS
The Necrotic Response to Nep1
Spotted knapweed and dandelion were much more sensitive to Nep1 than Arabidopsis was in these studies. Spotted knapweed and dandelion had 25% and 75% leaf necrosis 24 h after treatment with 1 and 5 μg mL–1 Nep1 (plus 0.1% [v/v] Silwet-L77), respectively. Necrotic spots on spotted knapweed and dandelion were uniformly spread and coalesced, sometimes covering whole leaves by 48 h after treatment. Arabidopsis had only 3% necrosis after treatment with 5 μg mL–1 Nep1 (plus 0.1% [v/v] Silwet-l77), and necrosis caused by the 1 μg mL–1 Nep1 (plus 0.1% [v/v] Silwet-L77) was not measurable macroscopically on Arabidopsis. Necrosis on Arabidopsis was observed as a tip burn that did not develop further after 24 h. The Silwet-l77 treatment (0.1%, v/v) did not cause measurable necrosis on any of the three plant species.
Transmission Electron Microscopy
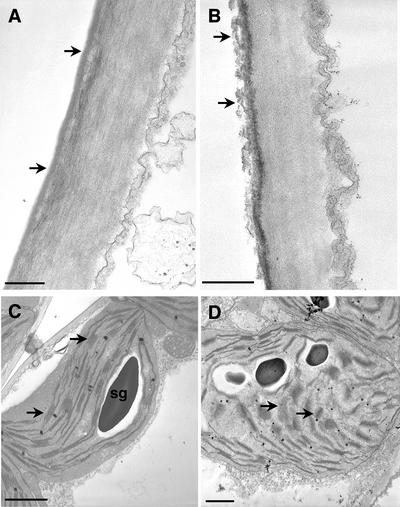
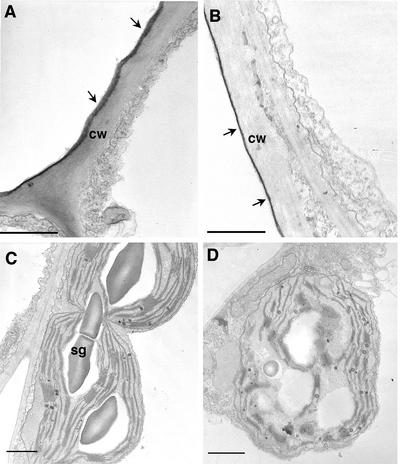
Application of Nep1 (1 μg mL–1, 0.1% [v/v] Silwet-L77) caused a noticeable decrease in the thickness of the leaf cuticle between 1 and 4 h after treatment (Figs. 1 and 2). Changes in dandelion (data not shown) and Arabidopsis (Fig. 2) were apparent at the 1- and 4-h time points, and changes in spotted knapweed were observed at the 4-h time point (Fig. 1). The cuticle appears in micrographs as a darker layer on the upper (abaxial) surface of epidermal cell walls. The dark staining is due to the presence of waxes and esters in the cuticle that react with the osmium tetroxide used as a postfixative on these samples. The decrease in cuticle thickness took on two forms. In the treated spotted knapweed leaves, the cuticle appeared to be degrading and “sloughing off” (as indicated by arrows), compared with the cuticle in the Silwet-L77-treated (0.1%, v/v) leaf, which remained a solid dark gray layer (Fig. 1B, arrows). In dandelion (data not shown) and Arabidopsis (Fig. 2B), the cuticle (as indicated by arrows) of Nep1-treated (1 μg mL–1, 0.1% [v/v] Silwet-l77) leaf tissues appeared to be compressed to a thinner, more darkly stained layer. This is in comparison with the cuticles in Silwet-l77-treated (0.1%, v/v) tissues, where the cuticle was thicker and more lightly stained (Fig. 2A).
Figure 1.
Nep1-induced changes in cuticle and chloroplasts of spotted knapweed as detected by transmission electron microscopy. A through D, Transmission electron micrographs of adaxial epidermal and mesophyll cells before and after application of Nep1. A, Cuticle in control leaf, arrow points to cuticle layer. B, Cuticle layer (arrow) in leaf 4 h after application of Nep1. Note degradation of cuticle (lighter gray areas). C, Chloroplast in untreated (control) leaf. Arrows point to normal granal stacks and thylakoid membranes. D, Chloroplast in leaf 4 h after treatment with Nep1. Note lack of organized granal stacks and thylakoid membranes (arrows). Starch grains seem to be breaking down; also of interest are the many lipophilic bodies present. Bars = 0.4 μm in A and B, and 1 μm in C and D. sg, starch grain.
Figure 2.
Nep1-induced changes in cuticle and chloroplasts of Arabidopsis as detected by transmission electron microscopy. A through D, Transmission electron micrographs of adaxial epidermal and mesophyll cells. A, Cuticle of untreated leaf (as indicated by arrows). B, Cuticle of leaf 1 h after treatment with Nep1. Note decrease in thickness and dark appearance. C, Chloroplasts in mesophyll cell of untreated leaf. Note normal membrane structure and presence of starch grains. D, Chloroplast in mesophyll cell of treated leaf. Note lack of organized membrane structure, altered starch grains, and misshapen nature of chloroplast. Bars = 1 μm. cw, Cell wall; sg, starch grain.
Chloroplasts withstood the fixation process better than most other organelles, allowing their detailed description. Data concerning the responses of other organelles and membranes were inconclusive. Nep1 (1 μg mL–1, 0.1% [v/v] Silwet-L77) had a marked effect on the appearance of chloroplasts and chloroplast membranes in all three species studied (Figs. 1 and 2). In general, application of Nep1 caused breakdown of the thylakoid and granal membrane structures that was noticeable in dandelion (data not shown) and Arabidopsis (Fig. 2D) at the 1- and 4-h time points; changes in spotted knapweed (Fig. 1D) were observed at the 4-h time point. Also noticeable was the disappearance of starch granules from chloroplasts of treated leaves (Fig. 2D). This is of note because all of the leaves were harvested at the same time of day and under the same light conditions. The chloroplasts themselves also appeared to swell and become misshapen after treatment with Nep1 (1 μg mL–1, 0.1% [v/v] Silwet-L77), and the outer chloroplast membrane appeared to deteriorate, which was especially evident in Arabidopsis (Fig. 2D). Last, chloroplasts from Nep1-treated (plus 0.1% [v/v] Silwet-L77) leaves often appeared to have more lipophilic bodies compared with chloroplasts from Silwet-L77-treated (0.1%, v/v) leaves (Figs. 1D and 2D). Note that all of the observations above pertain to chloroplasts nearer the point of Nep1 application. Chloroplasts on the opposite side of the leaf from the application site showed no change in appearance (data not shown).
Isolation and Identification of Putatively Differentially Expressed cDNA Clones
Taking into account the three plant species being studied, a total of 29 cDNA fragments were cloned and sequenced based on their consistent differential expression on two replicate differential display gels. Of the 29 clones, 15 showed no significant homology to known sequences using blastx and tblastx. Nine of the 15 unidentified clones were isolated from spotted knapweed and five were isolated from dandelion. Two clones, one from spotted knapweed and one from dandelion, showed homology to unknown Arabidopsis proteins. The remaining 11 clones (Table I), which showed significant homology to known genes or gene families, were selected for further study.
Table I.
Putative Nep1c responsive cDNA clones isolated from spotted knapweed, dandelion, or Arabidopsis using differential display and their tentative identification based on sequence comparisons (BLASTX)
| Clone dbEST-ID | Size (bp) | Locus/Gene | Protein/Source | Identity/Expected Ratios |
|---|---|---|---|---|
| Spotted knapweed | ||||
| CmTIF-1 (#15631450) | 452 | AF347634/infA | Translation initiation factor IF1/Fouquieria splendens | 96%/4e-27 |
| BAA84419/rp136 | Ribosomal protein L36/Arabidopsis | 67%/9e-07 | ||
| CmBGlu-b (#15631452) | 608 | AAC69619 | β-glucosidase/Pinus contorta | 50%/1e-36 |
| T02127 | β-glucosidase homolog/Arabidopsis | 40%/4e-34 | ||
| CmCAL-1 (#15631451) | 300 | At3g10190 | Calmodulin-like protein/Arabidopsis | 60%/2e-27 |
| CAC34625/pprg1 | Calmodulin-like protein/Alfalfa (Medicago sativa) | 45%/4e-16 | ||
| CmSER-1 (#15631449) | 693 | AC007519 | Serpin-like/Arabidopsis | 64%/7e-64 |
| CAA78822 | Serpin zx/Barley (Hordeum vulgare) | 59%/7e-59 | ||
| Dandelion | ||||
| ToCYP-1 (#15631453) | 710 | AF122821/PepCYP | Cytochrome P450/Pepper | 49%/3e-69 |
| CAC24711/CYP71D4 | Cytochrome P450/Potato | 50%/3e-69 | ||
| ToPP2C-1 (#15631454) | 544 | AAD25933/PP2C5 | Protein phosphatase 2C/Arabidopsis | 61%/1e-34 |
| T09640/PP2C | Protein phosphatase 2C/Alfalfa | 66%/3e-34 | ||
| Arabidopsis | ||||
| AtPK-1 (#15631456) | 372 | At2g39660 | Protein kinase/Arabidopsis | 97%/4e-63 |
| NAK_ARATH/NAK | S/T protein kinase/Arabidopsis | 80%/1e-49 | ||
| AtWRKY-18 (#15631458) | 592 | WR18_ARATH/WRKY18 | Probable WRKY transcription factor 18/Arabidopsis | 100%/7e-82 |
| BAA87058/WIZZ | Wound induced WRKY transcription factor/Tobacco (Nicotiana tabacum) | 49%/5e-39 | ||
| AtPLD-1 (#15631455) | 456 | At2g42010/PLDbeta | Phospholipase D/Arabidopsis | 97%/3e-46 |
| AAG45488/PLDb2 | Phospholipase D/Tomato (Lycopersicon esculentum) | 73%/2e-35 | ||
| AtWI-12 (#15631459) | 380 | AAM67338 | Wound-induced protein WI12/Arabidopsis | 98%/8e-30 |
| BAB1371/Nt-SubD10 | Elicitor inducible protein/Tobacco | 59%/5e-13 | ||
| Af117224/WI12 | Wound induced WI12/Mesembryanthemum crystallinum | 51%/3e-12 | ||
| AtLEA-1 (#15631457) | 342 | T51749 | Late embryogenesis abundant homolog/Arabidopsis | 97%/1e-19 |
| AAC06242 | Lea5/Tobacco | 65%/3e-9 |
Eleven cDNA clones (Table I) were used as probes on northern blots of total RNA from Silwet-L77 (1%, v/v) and Nep1-treated (1 μg mL–1, 0.1% [v/v] Silwet-L77) leaves for the three plant species being studied without consideration of the origin of the clone. Only CmTIF-1 and CmCAL-1 hybridized to total RNA from plant species other than the species from which the clone was obtained (data not shown). CmTIF-1 hybridized to total RNA from all three species but did not show differential expression, and CmCAL-1 hybridized with total RNA from spotted knapweed and dandelion showing differential expression in both species. Only the cDNA clone/plant species combinations that showed significant hybridization to northern blots in the studies of the 1 μg mL–1 Nep1 (plus 0.1% [v/v] Silwet-L77) treatments were used when probing northern blots of total RNA from leaves treated with 5 μg mL–1 Nep1 (plus 0.1% [v/v] Silwet-L77). Unless otherwise indicated, the results for studies using the 1 μg mL–1 Nep1 rate (plus 0.1% [v/v] Silwet-L77) were similar to those presented for the 5 μg mL–1 Nep1 rate (plus 0.1% [v/v] Silwet-L77), and the data are not shown. CmB-Glu-1 showed low level induction in Silwet-L77-treated (0.1%, v/v) spotted knapweed 4 h after treatment (data not shown) and was not studied further.
Gene Expression
Spotted Knapweed
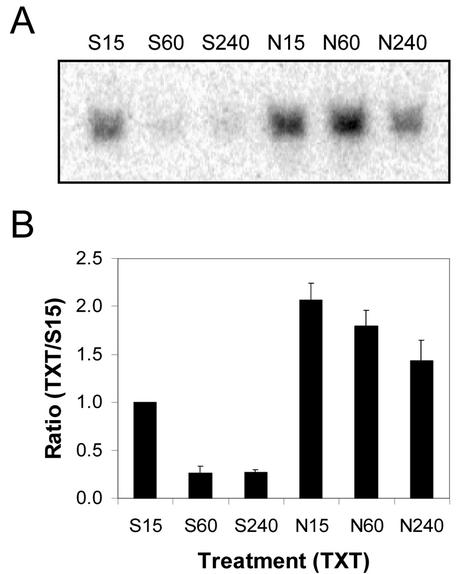
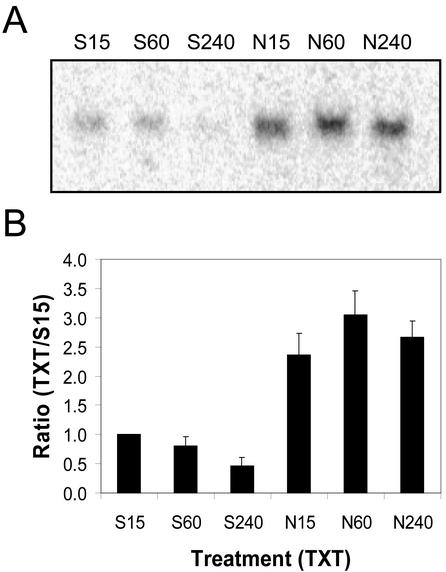
The quantity of CmCAL-1 mRNA present on northern blots of total RNA (20 μg lane–1) extracted from Silwet-L77-treated (1%, v/v) spotted knapweed leaves decreased to almost undetectable levels between 15 min and 1 h after treatment (Fig. 3). Total RNA (20 μg lane–1) isolated from spotted knapweed leaves 15 min after treatment with Nep1 (5 μg mL–1, 1% [v/v] Silwet-L77) had two times more CmCAL-1 mRNA than Silwet-L77 samples at the same time point. CmCAL-1 mRNA quantities were maintained for 4 h in Nep1-treated spotted knapweed leaves. Four hours after treatment, 5.2 times more CmCAL-1 mRNA was detected on northern blots of total RNA from Nep1-treated spotted knapweed leaves compared with northern blots of total RNA from Silwet-L77-treated spotted knapweed leaves.
Figure 3.
Expression of CmCAL-1 (calmodulin-like) in spotted knapweed after treatment with Silwet-L77 (S) or Nep1 plus Silwet-L77 (N). Spotted knapweed was treated with Silwet-L77 (0.1%, v/v) or 5 μg mL–1 Nep1 (plus 0.1% [v/v] Silwet-L77). Leaves were harvested 15, 60, or 240 min after treatment. A, Representative northern blot (20 μg total RNA per lane). B, Corrected band volumes for each treatment by time combination (TXT) were converted to ratios relative to the 15-min Silwet-L77 sample (S15) on each blot. The ratios (TXT/S15) were averaged for each treatment at each time point using data for three replicate blots.
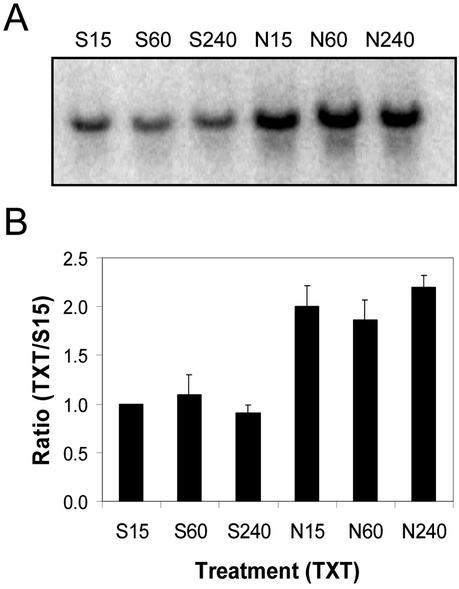
Total RNA (20 μg lane–1) extracted from spotted knapweed leaves after treatment with Nep1 (5 μg mL–1 Nep1, 1% [v/v] Silwet-L77) had approximately two times more CmSER-1 mRNA than samples extracted from Silwet-l77-treated (1%, v/v) leaves at all time points sampled (Fig. 4). The quantity of CmSER-1 mRNA in Silwet-l77-treated spotted knapweed leaves remained steady at 15 min, 1 h, and 4 h.
Figure 4.
Expression of CmSER-1 (serpin-like) in spotted knapweed after treatment with Silwet-L77 (S) or Nep1 plus Silwet-L77 (N). Spotted knapweed was treated with Silwet-L77 (0.1%, v/v) or 5 μg mL–1 Nep1 (plus 0.1% [v/v] Silwet-L77). Leaves were harvested 15, 60, or 240 min after treatment. A, Representative northern blot (20 μg total RNA per lane). B, Corrected band volumes for each treatment by time combination (TXT) were converted to ratios relative to the 15-min Silwet-L77 sample (S15) on each blot. The ratios (TXT/S15) were averaged for each treatment at each time point using data for three replicate blots.
Dandelion
The quantity of mRNA CmCAL-1 on northern blots of total RNA (20 μg lane–1) extracted from Silwet-l77-treated (1%, v/v) dandelion leaves decreased to almost undetectable levels between 1 and 4 h after treatment (Fig. 5). Total RNA (20 μg lane–1) isolated from dandelion leaves 15 min after treatment with Nep1 (5 μg mL–1, 1% [v/v] Silwet-L77) had 2.4 times more CmCAL-1 mRNA than Silwet-L77 samples at the same time point. CmCAL-1 mRNA quantities were maintained for 4 h in Nep1-treated dandelion leaves. As a result, 5.8 times more CmCAL-1 mRNA was detected on northern blots of total RNA from Nep1-treated dandelion leaves compared with northern blots of total RNA from Silwet-L77-treated dandelion leaves 4 h after treatment.
Figure 5.
Expression of CmCAL-1 (calmodulin-like) in dandelion after treatment with Silwet-L77 (S) or Nep1 plus Silwet-L77 (N). Dandelion was treated with Silwet-L77 (0.1%, v/v) or 5 μg mL–1 Nep1 (plus 0.1% [v/v] Silwet-L77). Leaves were harvested 15, 60, or 240 min after treatment. A, Representative northern blot (20 μg total RNA per lane). B, Corrected band volumes for each treatment by time combination (TXT) were converted to ratios relative to the 15-min Silwet-L77 sample (S15) on each blot. The ratios (TXT/S15) were averaged for each treatment at each time point using data for three replicate blots.
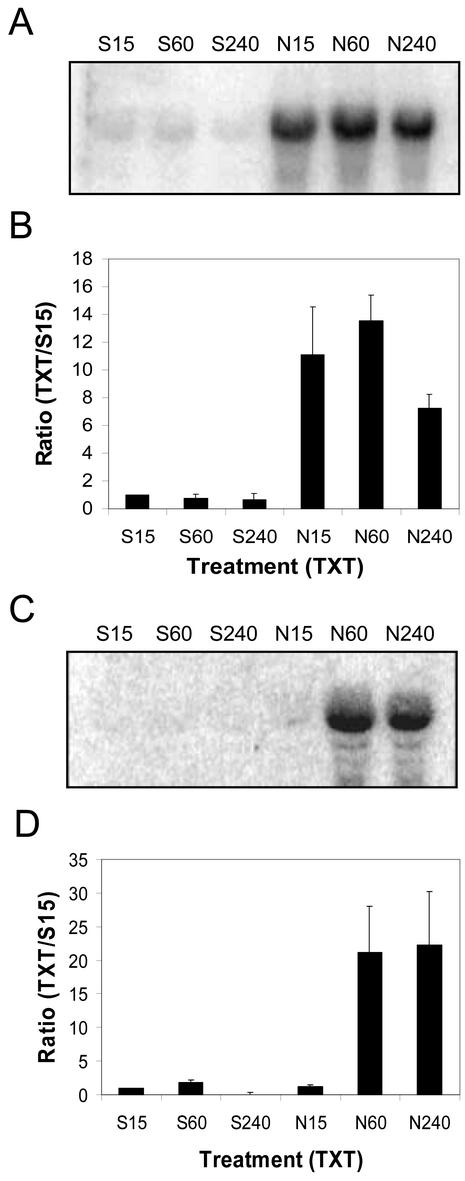
ToCYP-1 mRNA accumulated in response to Nep1 treatment. The Nep1 rate strongly influenced the time course of ToCYP-1 mRNA accumulation (Fig. 6). Fifteen minutes after treatment, total RNA from the 5 μg mL–1 Nep1-treated (plus 0.1% [v/v] Silwet-L77) dandelion leaves had 11 times more ToCYP-1 mRNA than Silwet-l77-treated (1%, v/v) dandelion leaves. The high level of ToCYP-1 mRNA was maintained for 4 h. Treatment of dandelion with 1 μg mL–1 Nep1 (plus 0.1% [v/v] Silwet-L77) resulted in ToCYP-1 mRNA accumulation at 1 and 4 h but not at 15 min.
Figure 6.
Expression of ToCYP-1 (cytochrome P450) in dandelion after treatment with Silwet-L77 (S) or Nep1 plus Silwet-L77 (N). Dandelion was treated with Silwet-L77 (0.1%, v/v) or (A and B) 5 μg mL–1 Nep1 (plus 0.1% [v/v] Silwet-L77) or (C and D) 1 μg mL–1 Nep1 (plus 0.1% [v/v] Silwet-L77). Leaves were harvested 15, 60, or 240 min after treatment. A and C, Representative northern blot (20 μg total RNA per lane). B and D, Corrected band volumes for each treatment by time combination (TXT) were converted to ratios relative to the 15-min Silwet-L77 sample (S15) on each blot. The ratios (TXT/S15) were averaged for each treatment at each time point using data for three replicate blots.
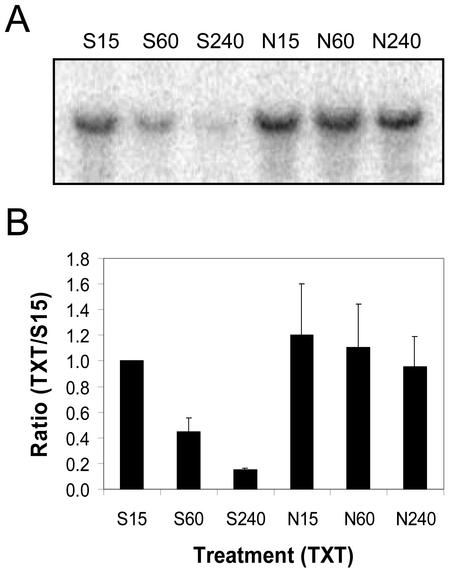
The quantity of ToPP2C-1 mRNA detected on northern blots of total RNA isolated from Nep1-treated (5 μg mL–1, 1% [v/v] Silwet-L77) dandelion leaves remained steady between 15 min and 4 h after treatment (Fig. 7). The quantity of ToPP2C-1 mRNA detected decreased on northern blots of total RNA isolated from Silwet-L77-treated (1%, v/v) dandelion leaves between 15 min and 4 h. As a result, six times more ToPP2C-1 mRNA was detected on northern blots of total RNA from Nep1-treated dandelion leaves compared with northern blots of total RNA from Silwet-L77-treated dandelion leaves 4 h after treatment.
Figure 7.
Expression of ToPP2C-1 (protein phosphatase) in dandelion after treatment with Silwet-L77 (S) or Nep1 plus Silwet-L77 (N). Dandelion was treated with Silwet-L77 (0.1%, v/v) or 5 μg mL–1 Nep1 (plus 0.1% [v/v] Silwet-L77). Leaves were harvested 15, 60, or 240 min after treatment. A, Representative northern blot (20 μg total RNA per lane). B, Corrected band volumes for each treatment by time combination (TXT) were converted to ratios relative to the 15-min Silwet-L77 sample (S15) on each blot. The ratios (TXT/S15) were averaged for each treatment at each time point using data for three replicate blots.
Arabidopsis
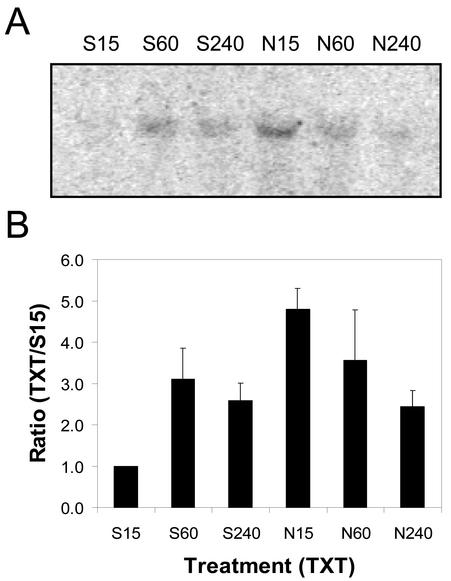
Fifteen minutes after treatment, 4.8 times more protein AtPK-1 mRNA was detected on northern blots of total RNA (20 μg lane–1) extracted from Nep1-treated (5 μg mL–1, 1% [v/v] Silwet-L77) Arabidopsis leaves compared with northern blots of total RNA from Silwet-L77-treated (1%, v/v) Arabidopsis leaves (Fig. 8). AtPK-1 mRNA levels decreased between 15 min and 4 h after Nep1 treatment. AtPK-1 mRNA levels increased between 15 min and 1 h after treatment with Silwet-L77 to the point that there was little difference between the Nep1 and Silwet-l77 treatments 1 and 4 h after treatment.
Figure 8.
Expression of AtPK-1 (protein kinase) in Arabidopsis after treatment with Silwet-L77 (S) or Nep1 plus Silwet-L77 (N). Arabidopsis was treated with Silwet-L77 (0.1%, v/v) or 5 μg mL–1 Nep1 (plus 0.1% [v/v] Silwet-L77). Leaves were harvested 15, 60, or 240 min after treatment. A, Representative northern blot (20 μg total RNA per lane). B, Corrected band volumes for each treatment by time combination (TXT) were converted to ratios relative to the 15-min Silwet-L77 sample (S15) on each blot. The ratios (TXT/S15) were averaged for each treatment at each time point using data for three replicate blots.
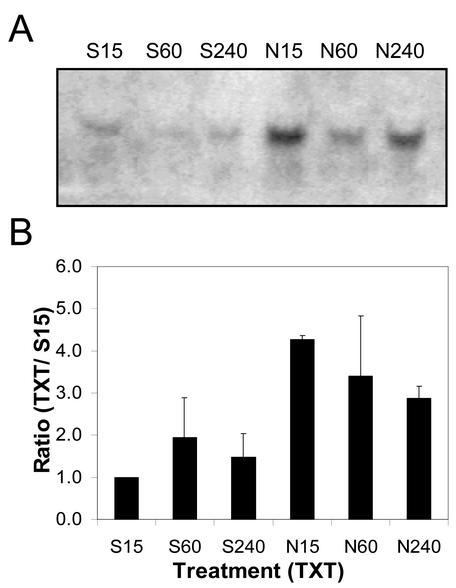
Fifteen minutes after treatment, 4.3 times more AtWRKY-18 mRNA was detected on northern blots of total RNA (20 μg lane–1) extracted from Nep1-treated (5 μg mL–1, 1% [v/v] Silwet-L77) Arabidopsis leaves compared with northern blots of total RNA from Silwet-L77-treated (0.1%, v/v) Arabidopsis leaves (Fig. 9). AtWRKY-18 mRNA levels decreased between 15 min and 4 h after Nep1 treatment. AtWRKY-18 mRNA levels were most variable 1 h after treatment for Nep1- and Silwet-L77-treated Arabidopsis leaves.
Figure 9.
Expression of AtWRKY-18 (WRKY-18) in Arabidopsis after treatment with Silwet-L77 (S) or Nep1 plus Silwet-L77 (N). Arabidopsis was treated with Silwet-L77 (0.1%, v/v) or 5 μg mL–1 Nep1 (plus 0.1% [v/v] Silwet-L77). Leaves were harvested 15, 60, or 240 min after treatment. A, Representative northern blot (20 μg total RNA per lane). B, Corrected band volumes for each treatment by time combination (TXT) were converted to ratios relative to the 15-min Silwet-L77 sample (S15) on each blot. The ratios (TXT/S15) were averaged for each treatment at each time point using data for three replicate blots.
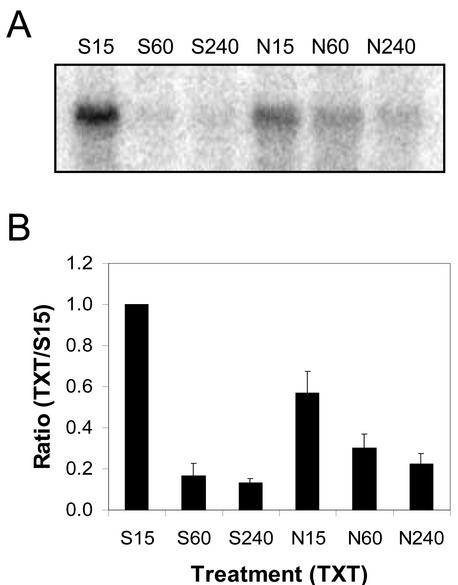
Fifteen minutes after treatment, 1.8 times more AtPLD-1 mRNA was detected on northern blots of total RNA (20 μg lane–1) extracted from Silwet-L77-treated (1%, v/v) Arabidopsis leaves compared with northern blots of total RNA from Nep1-treated (5 μg mL–1, 1% [v/v] Silwet-L77) Arabidopsis leaves (Fig. 10). AtPLD-1 transcript decreased in Silwet-l77-treated Arabidopsis leaves to almost undetectable levels 1 h after treatment. AtPLD-1 mRNA decreased more slowly in Nep1-treated Arabidopsis leaves between 15 min and 4 h. As a result, AtPLD-1 mRNA levels for samples from Nep1-treated Arabidopsis leaves were at least 1.7 times that detected for samples from Silwet-L77-treated leaves 1 and 4 h after treatment.
Figure 10.
Expression of AtPLD-1 in Arabidopsis after treatment with Silwet-L77 (S) or Nep1 plus Silwet-L77 (N). Arabidopsis was treated with Silwet-L77 (0.1%, v/v) or 5 μg mL–1 Nep1 (plus 0.1% [v/v] Silwet-L77). Leaves were harvested 15, 60, or 240 min after treatment. A, Representative northern blot (20 μg total RNA per lane). B, Corrected band volumes for each treatment by time combination (TXT) were converted to ratios relative to the 15-min Silwet-L77 sample (S15) on each blot. The ratios (TXT/S15) were averaged for each treatment at each time point using data for three replicate blots.
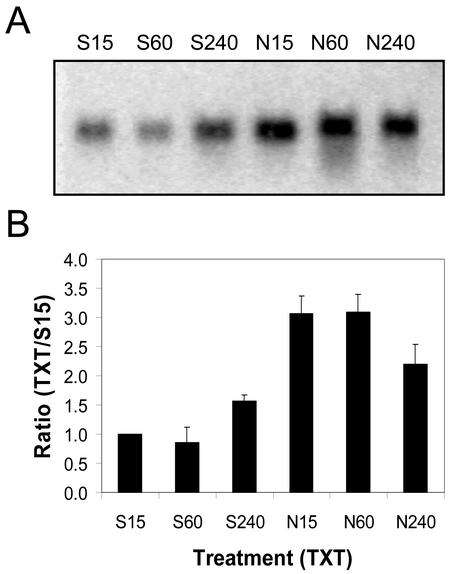
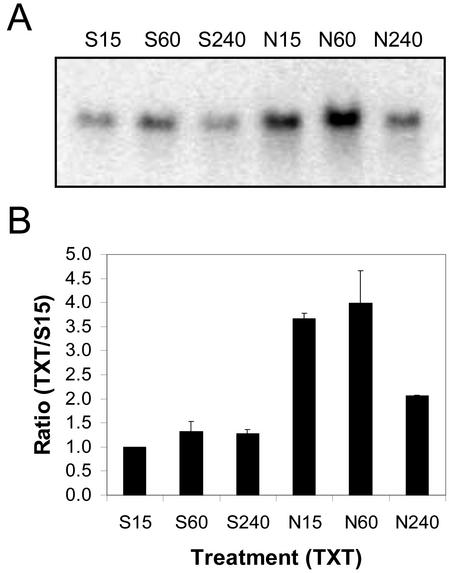
When AtWI-12 and AtLEA-1 were used as probes on northern blots, they produced similar expression profiles (Figs. 11 and 12). Fifteen minutes and 1 h after treatment, AtWI-12 and AtLEA-1 mRNA levels for samples from Nep1-treated (5 μg mL–1, 1% [v/v] Silwet-L77) Arabidopsis leaves were at least three times that observed for samples from Silwet-l77-treated (0.1%, v/v) Arabidopsis leaves. The mRNA levels for AtWI-12 and AtLEA-1 decreased between 1 and 4 h after Nep1 treatment.
Figure 11.
Expression of AtWI-12 (wound-induced protein) in Arabidopsis after treatment with Silwet-L77 (S) or Nep1 plus Silwet-L77 (N). Arabidopsis was treated with Silwet-L77 (0.1%, v/v) or 5 μg mL–1 Nep1 (plus 0.1% [v/v] Silwet-L77). Leaves were harvested 15, 60, or 240 min after treatment. A, Representative northern blot (20 μg total RNA per lane). B, Corrected band volumes for each treatment by time combination (TXT) were converted to ratios relative to the 15-min Silwet-L77 sample (S15) on each blot. The ratios (TXT/S15) were averaged for each treatment at each time point using data for three replicate blots.
Figure 12.
Expression of AtLEA-1 (late embryogenesis abundant) in Arabidopsis after treatment with Silwet-L77 (S) or Nep1 plus Silwet-L77 (N). Arabidopsis was treated with Silwet-L77 (0.1%, v/v) or 5 μg mL–1 Nep1 (plus 0.1% [v/v] Silwet-L77). Leaves were harvested 15, 60, or 240 min after treatment. A, Representative northern blot (20 μg total RNA per lane). B, Corrected band volumes for each treatment by time combination (TXT) were converted to ratios relative to the 15-min Silwet-L77 sample (S15) on each blot. The ratios (TXT/S15) were averaged for each treatment at each time point using data for three replicate blots.
DISCUSSION
Structural Changes Caused by Nep1
Plant cells respond to Nep1 by rapid structural changes, including the thinning of the cuticle and disruption of chloroplasts. Similar changes could be seen by transmission electron microscopy within 1 h of Nep1 treatment in all three species studied, long before macroscopic necrosis was observed. Arabidopsis was less sensitive to Nep1 at the macroscopic level, but the types of structural changes caused by Nep1 to Arabidopsis closely resembled changes observed in Nep1-treated dandelion.
The chloroplast changes we observed included, most strikingly, a complete breakdown of the internal chloroplast membranes, breakdown of the outer chloroplast membrane, loss of starch grains, and a “swelling” of the chloroplasts. In studies of the hypersensitive response in plant cells, similar changes to chloroplasts and other cell membrane structures have been observed (Goodman, 1972; Meyer and Heath, 1988a). What is unique about our observations is the fact that they are also at the subcellular level, and followed application of a purified fungal elicitor protein to intact leaves, whereas in other studies of this kind, leaf necrosis has only been described using naked eye and light microscopy (Ricci et al., 1989; Heath, 1997; Roussel et al., 1999; Ivanova et al., 2001). It is also interesting to note that the breakdown of chloroplast membranes that we observed was concurrent with the appearance of many plastoglobuli, a phenomenon associated with membrane breakdown in chloroplasts of senescing leaves (Goodman et al., 1986).
The rapid (1–4 h) changes in cuticle thickness in response to Nep1 treatment were unexpected and raise the possibility that Nep1 directly acts on the cuticle. The change in cuticle thickness in response to Nep1 was consistent across the three species and at multiple time points. Many compounds within the cuticle, such as the epicuticular waxes (Eglinton and Hamilton, 1967; Jetter and Schaffer, 2001), are lipophylic in nature. Nep1 also rapidly alters cell membranes (Jennings et al., 2001) and lipid bilayers, supporting the possibility that Nep1 interacts directly with lipophylic compounds as has been demonstrated for toxins and elicitors (Lee et al., 2001). Alternatively, it is possible that Nep1 indirectly affects cuticle thickness as a result of other rapidly induced changes in plant cells. Tobacco cell suspensions, which lack a cuticle, respond to Nep1 within 15 min by electrolyte leakage and production of active oxygen, and subsequently die (Jennings et al., 2001), indicating that action on the cuticle is not a prerequisite for Nep1-induced cell death. It has been demonstrated that treating opium poppy plants with Nep1 makes the plants more susceptible to infection by P. papaveracea (Bailey et al., 2000a). Regardless of the mode of action, a thinner cuticle layer might be easier for fungal pathogens to penetrate, causing Nep1-treated plants to be more susceptible to disease.
Genes Potentially Involved Early in Signal Transduction
AtPK-1 in Arabidopsis and ToPP2C-1 in dandelion putatively code for a protein kinase and a protein phosphatase 2C, respectively (Table I). Reversible protein phosphorylation is mediated by protein kinases and protein phosphatases and serves as a primary regulator of many signal transduction pathways (Ganguly and Singh, 1999). AtPK-1 is closely related (91% identical) to the Ser/Thr-specific protein kinase NAK in Arabidopsis (Moran and Walker, 1993). NAK is similar to the oncogenes met (Park et al., 1987) and abl (Daniel et al., 2001), and based on the homology they share with other protein kinases, may play a role in the regulation of plant growth and development (Moran and Walker, 1993). ToPP2C-1 is closely related to a protein phosphatase 2C of Arabidopsis, PP2C5 (Table I), and a protein phosphatase 2C of alfalfa, PP2C (Table I). PP2C5 is regulated by abscisic acid (Wang et al., 1999). PP2C is induced by cold, drought, touch, and wounding, and it functions as a negative regulator of the stress-activated mitogen-activated protein kinase pathway in plants (Meskiene et al., 1998). Hyperphosphorylation is believed to be involved in events leading to enhanced ethylene production and senescence in flower of Phalaenopsis spp. (Wang et al., 2001) and elicitor-induced reactive oxygen species generation, H+ influx, and cytoplasmic acidification in suspension-cultured rice (Oryza sativa) cells (He et al., 1998).
AtWRKY-18 is the gene for a salicylic acid/pathogen-induced WRKY DNA-binding protein in Arabidopsis (Table I). The WRKY DNA-binding proteins make up a superfamily of transcription factors that are involved in the regulation of gene expression, including genes involved in plant defense and senescence (Du and Chen, 2000; Eulgem et al., 2000; Hara et al., 2000). AtWRKY-18 was highly induced in Arabidopsis 1 to 8 h after salicylic acid treatment (Yu et al., 2001), whereas induction of AtWRKY-18 was at a maximum 15 min after Nep1 treatment (Fig. 9). NPR1, a positive regulator of inducible plant disease resistance in Arabidopsis, has W-box sequences in its promoter region that are recognized by the AtWRKY-18 protein (Yu et al., 2001).
CmCAL-1 was induced by Nep1 treatment in spotted knapweed and dandelion. CmCAL-1 is closely related to genes for calmodulin-like proteins in Arabidopsis and many other plant species, but did not hybridize to northern blots of total RNA from Nep1-treated Arabidopsis under the conditions used. Calmodulin and calmodulin-related genes in Arabidopsis and other plant species are regulated by physical inducers, including rain, wind, touch, and wounding, resulting in rapid transcript accumulation and altered development (Braam and Davis, 1990; Takezawa et al., 1995). Leshem (1984) proposed the involvement of calcium/calmodulin in senescence as mediated by the action of ethylene, free radicals, lipooxygenase, and phospholipase A2. Calcium/calmodulin complexes can activate protein kinases that are important in signal transduction pathways (Vogeli et al., 1992) and that are involved in induction of phytoalexin biosynthesis by cell wall elicitors (Vogeli et al., 1992).
Signaling cascades can be triggered by the activation of phospholipid-cleaving enzymes such as phospholipases C, D (PLD), and A(2) (Qin et al., 1997). AtPLD-1 (Arabidopsis) putatively codes for a phospholipase D (PLD) β (Table I). AtPLD-1 mRNA decrease rapidly with time after Silwet-l77 treatments compared with a slower mRNA decrease after Nep1 (plus Silwet-L77) treatment, which suggests regulation by multiple factors. AtPLD-1 is closely related to AtPLDβ (97% identity), a PLDβ. AtPLDβ enzyme activity is dependent on phosphatidylinositol 4,5 bisphosphate and nanomolar concentrations of calcium (Pappan et al., 1997). PLDβ1 mRNA was found to rapidly and specifically accumulate in tomato (Lycopersicon esculentum) cell suspensions and tomato leaves treated with a fungal elicitor xylanase (Laxalt et al., 2001). In the resurrection plant, Craterostigma plantagineum, CpPLD-2 coding for a PLD was induced by dehydration and abscisic acid (Frank et al., 2000).
Other Genes Potentially Involved in Plant Responses to Stress
Nep1 (5 μg mL–1, 0.1% [v/v] Silwet-L77) induces accumulation of ToCYP-1 transcript in dandelion within 15 min of treatment and is the most highly up-regulated of the genes studied. ToCYP-1 putatively codes for a cytochrome P450 protein (Table I). Cytochrome P450 enzymes form a large superfamily of genes (Nelson et al., 1993) that can be induced in plants by many different stimuli, including chemicals, elicitors, wounding, pathogen attack, and other stress factors (Schopfer and Ebel, 1998; Oh et al., 1999; Takemoto et al., 1999). ToCYP-1 is most closely related to PepCYP (49% identical) from peppers (Capsicum annuum), based on partial sequence comparisons (Table I). PepCYP is a cytochrome P450 protein that is highly expressed in an incompatible interaction of pepper to Colletotrichum gloeosporioides and is up-regulated by wounding or jasmonic acid treatment (Oh et al., 1999). Cytochrome P450 enzymes can catalyze oxidative reactions that function to detoxify compounds. In addition, cytochrome P450 enzymes can function in the biosynthesis of compounds including phytoalexins.
AtWI-12 is related to an elicitor inducible protein in tobacco (59% identity) and the wound-induced protein WI12 in common ice plant (Mesembryanthemum crystallinum; 51% identity). Wounding, methyl jasmonate, and pathogen infection induced local WI12 expression in common ice plant (Yen et al., 2001). AtLEA-1 shows similarity (58%) to the gene coding for the late embryogenesis abundant protein Lea5 in tobacco (Weaver et al., 1998). Members of the LEA genes family have been associated with plant responses to many different stresses including drought, salt, cold, heat, wounding, and several plant hormones in addition to natural senescence (Weaver et al., 1998), but the function of LEA family members in plants remains obscure.
CmSER-1 is most closely related to serpin genes found in barley (Table I), wheat (Triticum aestivum), Avena fatua, and Cucurbita maxima in addition to putative serpins found in Arabidopsis (Table I). Serpins, Ser proteinase inhibitors, are well described in higher animals where they function in divergent biological processes (Silverman et al., 2001). In plants, serpins are best described in barley and wheat where they are found as abundant endosperm proteins. Although protease inhibitors in many cases have been shown to function in the defense response of plants to chewing insects (Lawrence and Koundal, 2002), the function of serpins in plant biology is unclear (Silverman et al., 2001). Evidence for induction of serpin genes in response to stress is lacking in plants. CmPS-1, a serpin found in C. maxima phloem and is correlated with increased resistance to the aphid Myzus pericae in vivo, is developmentally regulated, and has activity as an elastase inhibitor (Yoo et al., 2000).
Summary
It remains unclear if the identified responses to Nep1 treatment should be characterized as a general stress response to a toxin or some form of induced resistance (Jennings et al., 2001). Many plant genes are induced by pathogens and/or microbial elicitors, and their importance as components of the resistance response has been postulated (Rushton and Somssich, 1999). No effort was made to look specifically for systemic responses (van Wees et al., 2000), such as induced systemic resistance/wound responses, a jasmonic acid-dependent response, or systemic acquired resistance, a salicylic acid-dependent response. Although some of the cDNA clones isolated have been associated with many plant stress responses, including plant defense (specifically WRKY-18; Yu et al., 2001), as components of a signal transduction pathway, they may function as components of other plant processes. Fellbrich et al. (2002) demonstrated that induction of PR1 in Arabidopsis by NPP1, a homolog of NEP1 produced by Phytophthora species, is salicylic acid-dependent. Salicylic acid plays a role in the regulation of plant processes other than plant defense, including leaf senescence (Morris et al., 2000). Similarly, Nep1 (Jennings et al., 2001) and NPP1 (Fellbrich et al., 2002) induce active oxygen production, and active oxygen can contribute to susceptibility to disease (Tiedemannm, 1997; Baker and Orlandi, 1999) or resistance to disease (Baker and Orlandi, 1999). In many cases, it is the timing and/or level of gene expression that is characteristic of a response leading to compatibility or incompatibility (Graham and Graham, 1991; De Leon et al., 2002).
Using differential display, we were able to identify cDNA clones from multiple plant species potentially associated with signal transduction pathways that are responsive to Nep1, including calcium/calmodulin, DNA-binding/gene activation, lipid metabolism, reversible phosphorylation, and phytoalexins biosynthesis. Based on sequence homologies, the cDNA clones identified are in most cases closely related to genes involved in plant defense and/or stress responses, including wounding, salicylic acid, drought, disease resistance, and senescence. Nep1 induced ethylene biosynthesis in many different plant species and Nep1 has been shown to induce 1-aminocyclopropane-1-carboxylic acid synthase and 1-aminocyclopropane-1-carboxylic acid oxidase transcript accumulation in tobacco (Jennings et al., 2001). It is apparent from the transmission electron micrographs that chloroplasts and cuticles of all three species are rapidly altered in response to Nep1 treatment. Nep1 does not cause the same amount of necrosis in all the plant species it affects (Bailey, 1995). Arabidopsis was much less sensitive to the Nep1 rates and application methods used in this study than were spotted knapweed and dandelion, although the types of damage caused by Nep1 were similar across the three plant species studied. The primary processes involved in the necrotic responses of dicotyledonous plants to Nep1 appear to be similar across species and to involve many different genes associated with plant responses to stress.
MATERIALS AND METHODS
Nep1 Purification
Nep1 was purified from culture filtrates of Fusarium oxysporum f. sp. erythroxyli grown for 6 d in Czapek-Dox broth plus 1% (w/v) casamino acids (Bailey, 1995). Protein concentration was determined by Bradford assay, and purity was verified by SDS-PAGE (Bailey, 1995). Purified protein was stored in buffer (20 mm MES and 300 mm KCl, pH 5.0) at –20°C.
Plant Production
Seeds of spotted knapweed (Centaurea maculosa) were collected from local populations in Polo, IL, and seeds of dandelion (Taraxacum officionale) were collected from local populations in Beltsville, MD. Seeds of Arabidopsis (wild type) and the two weed species were planted in 10.2-cm pots filled with Scott's Redi-earth, and plants were grown in ambient light and temperature conditions in a greenhouse. Plants were used in experiments 28 to 32 d after planting.
Spray Application and Sampling
Nep1 was combined with 1,1,1,3,5,5,5-heptamethyltrisiloxanyl propylmethoxy-poly[ethylene oxide] (Silwet-l77; Witco Corporation, Friendly, WV) for foliar spray applications to plants. Plants were treated with Nep1 (1 or 5 μg mL–1) in 0.1% (v/v) Silwet-L77. Plants treated with Silwet-L77 (0.1%, v/v) were included as a control. Foliar sprays were applied with a sprayer (model 15; Binks, Glendale Heights, IL) at 15 psi and at a rate of 86 mL m–2 (860.9 L ha–1). All sprays were applied between 10 am and 2 pm when stomata were fully open. Plants were maintained in greenhouse conditions until sampled. Leaves from Silwet-l77(0.1%, v/v) and Nep1-treated (plus 0.1% [v/v] Silwet-L77) plants were collected 15 min, 1 h, and 4 h after spray application, frozen in liquid nitrogen, and stored at –80°C.
Transmission Electron Microscopy
Leaf tissues for each plant species were collected 1 and 4 h after treatment and were prepared for transmission electron microscopy. One leaf was sampled from three plants of each species for each treatment at each time point. Tissue squares (1 mm × 1 mm) treated with Silwet-L77 (0.1%, v/v) or 1 μg mL–1 Nep1 (plus 0.1% [v/v] Silwet-L77) were dissected under 2.5% (w/v) glutaraldehyde/2% (w/v) paraformaldehyde in 50 mm PIPES buffer (pH 7.6) and were fixed for 24 h at 4°C (Karnovsky, 1965). Tissues were postfixed in 2% (w/v) osmium tetroxide in 50 mm phosphate buffer. Samples were dehydrated in an acetone series (30%–100% by 10% steps; 10 min each step) and were infiltrated with Spurr's (Spurr, 1969) epoxy resin (1:3, 1:2, and 1:1 resin:acetone, each step overnight; three final changes of pure resin). Infiltrated tissues were placed in molds, and the resin was cured at 80°C overnight.
Thin sections of embedded material were cut using a ultramicrotome (MT-5000; Sorvall, Kendro Laboratory Products, Newtown, CT) and were picked up onto 200 mesh, formvar-coated nickel grids. Sections were stained with 2% (w/v) uranyl acetate for 10 min, rinsed, then stained with calcined lead stain for 10 min. Sections were viewed and negatives were taken using a transmission electron microscope (EM-10CA; Zeiss, Jena, Germany). Negatives were then scanned and saved as tiff files using a scanner (UMAX Powerlook 1100, UMAX Technologies, Inc., Dallas) connected to a computer (PowerMac G4; Apple Computers, Cupertino, CA).
Extraction of Total RNA
Total RNA was extracted from leaf tissues using a modified phenol extraction procedure (Goldsbrough et al., 1986; Kirby and Cook, 1967). RNA was stored at a concentration of at least 2 μg μL–1 at –80°C.
Differential Display PCR
DNA was removed from total RNA by DNaseI treatment (MessageClean kit; Genhunter, Nashville, TN). Total RNA was isolated from each of the three plant species 15, 60, or 240 min after treatment with 1 μg mL–1 Nep1 (plus 0.1% [v/v] Silwet-L77). Total RNA isolated from plant tissues 240 min after treatment with Silwet-l77 (0.1%, v/v) was included as the control. RNA was reverse transcribed, and the resulting cDNA was amplified by PCR using arbitrary 13 mers and anchored primers labeled with 5′-rhodamine (RNA Spectra Red kit 1; GenHunter). Eight arbitrary primers (H-AP1 through H-AP8) were paired with three anchored primers for a total of 24 primer combinations. Fluorescently labeled PCR product was separated on a 30 × 40 cm, 6% (w/v) denaturing polyacrylamide gel in Tris borate-EDTA buffer (60 W constant power for 3.5 h), and was imaged at 200 μm resolution using a Cy3 setting (532 nm excitation laser, 555 nm emission filter with a 20-nm band pass filter) on a Typhoon 8600 Variable Mode Imager (Molecular Dynamics/Amersham Biosciences, Piscataway, NJ). Differential display was carried out on replicate total RNA samples for each plant species primer combination. Apparent differences in band intensities in control versus Nep1-treated tissues on the imaged gel were used to locate bands of interest. The opened gel was placed on top of a full-scale printout of the fluorescent image of the gel, and the region containing the band of interest was excised and frozen at –20°C. The number of bands isolated was 186 for spotted knapweed, 266 for dandelion, and 133 for Arabidopsis. Because replicate gels were run, ideally each band should have been isolated twice. Twenty-nine bands of interest were identified by careful comparisons of display patterns and intensities between replicate gels (approximately 10% if all the bands were duplicated) for use in this study. Of the 29 bands, 15 were isolated from spotted knapweed, eight from dandelion, and six from Arabidopsis.
Reamplification and Subcloning of cDNA Probes
Only DNA bands showing consistent differential expression on two replicate differential display gels were further processed. cDNA was eluted from excised gel slices and was reamplified by PCR using the primer set previously used for differential display PCR, but without fluorescently labeled anchored primer (RNA SpectraKit; GenHunter). cDNA probes were subcloned using the PCR-Trap Cloning System (GenHunter). A subset of the probes were reamplified, filter purified (Geneclean Turbo for PCR; Bio 101, Carlsbad, CA), and sequenced before subcloning as a means of tentatively identifying genes of potential interest based on sequence homology. All subcloned cDNA probes were sequenced to verify identifications made before subcloning (BigDye v. 3.0 dye terminator kit on an ABI 3100 Prism; Applied Biosystems, Piscataway, NJ).
Confirmation of Differential Gene Expression Patterns by Northern Blot
Twenty micrograms of total RNA was denatured in glyoxal/dimethyl sulfoxide load dye at 50°C for 40 min (NorthernMax-Gly load dye; Ambion, Austin, TX) and was electrophoresed at 50 V for 4 h on a 1.2% (w/v) agarose gel containing 300 mm Bis-Tris, 100 mm PIPES, and 10 mm EDTA, at pH 8.0 (1× BisTns-PIPES-EDTA buffer). RNA was attached to GeneScreen Plus membrane (Perkin-Elmer Biosystems, Boston) by upward transfer in 10× SSC buffer. After crosslinking RNA to the membrane using the autocrosslink setting (UV Stratalinker 8600; Stratagene, La Jolla, CA), membranes were air-dried and stored between sheets of Whatman 3MM (Whatman International, Ltd., Maidstone, Kent, UK) paper at –20°C. cDNA probes were gel purified on a 1.5% (w/v) agarose gel (Geneclean II; Bio 101). For each probe, 35 ng of cDNA was labeled with [α-32P] dCTP using a Random Primed DNA Labeling kit (Applied Biosystems, Foster City, CA) and gel filtered (Edge Gel Filtration Cartridges; Edge BioSystems, Gaithersburg, MD). Blots were prehybridized in ExpressHyb solution (BD Biosciences/CLONTECH, Palo Alto, CA) at 68°C for 1 h.
Regardless of plant species, probes were initially hybridized to three replicate blots, each containing total RNA from Nep1- (Nep1 1 μg mL–1, 0.1% [v/v] Silwet-L77) and Silwet-L77-treated (0.1%, v/v) tissues for the three species, spotted knapweed, dandelion, and Arabidopsis. Only probe/species combinations that showed significant hybridization in the studies using the 1 μg mL–1 Nep1 (plus 0.1% [v/v] Silwet-L77) rate were included in studies using the 5 μg mL–1 Nep1 (plus 0.1% [v/v] Silwet-L77) rate. Radioactively labeled cDNA probes were denatured at 95°C to 100°C for 5 min. The probe was added to 5 mL of fresh ExpressHyb solution, and blots were incubated with continuous shaking at 68°C for 2 h. Blots were washed according to the ExpressHyb protocol, covered in plastic wrap, exposed to x-ray film at –70°C with two intensifying screens, and/or exposed to a storage phosphor screen (Molecular Dynamics/Amersham Biosciences), and imaged at 200 μm resolution on a Typhoon 8600 Variable Mode Imager (Molecular Dynamics/Amersham Biosciences). After imaging, the replicate blots were washed, scanned to verify that no probe remained, and probed a second time with radioactively labeled 28S ribosomal cDNA probe.
Calculation of Band Volume Ratios
Blots probed with 28S ribosomal cDNA were imaged and band volumes were calculated using ImageQuant Version 5.2c software (Molecular Dynamics/Amersham Biosciences). To correct for variations in loading volume on each replicate blot, the ratio of 28S ribosomal cDNA band volume for each treatment combination (plant species/time/Nep1 rate) was determined relative to the 15 min Silwet-L77 (thus arbitrarily set to one) control sample. The band volumes for blots probed with cDNAs of interest were corrected by multiplication by the appropriate 28S ribosomal cDNA ratio. For ease of presentation, the corrected band volumes were converted to ratios relative to the 15-min Silwet-l77 (thus arbitrarily set to one) control sample for each treatment combination on each replicate blot. The band volume ratios for each treatment combination were averaged using data from three replicate blots. The figures include the average band volume ratios (plus or minus 1 se) for each treatment combination in addition to representative autoradiograms. The three replicates for each treatment combination consisted of two samples from an initial experiment and a third sample from a subsequent experiment carried out approximately 6 months after the initial experiment.
Article, publication date, and citation information can be found at www.plantphysiol.org/cgi/doi/10.1104/pp.102.019836.
References
- Bailey BA (1995) Purification of a protein from culture filtrates of Fusarium oxysporum that induces ethylene and necrosis in leaves of Erythroxylum coca. Phytopathology 85: 1250–1255 [Google Scholar]
- Bailey BA, Apel-Birkhold PC, Akingbe OO, Ryan JL, O'Neill NR, Anderson JD (2000a) Nep1 Protein from Fusarium oxysporum enhances biological control of opium poppy by Pleospora papaveracea. Phytopathology 90: 812–818 [DOI] [PubMed] [Google Scholar]
- Bailey BA, Apel-Birkhold PC, Luster DG (2002) Expression of NEP1 by Fusarium oxysporum f. sp. erythroxyli after gene replacement and overexpression using polyethylene glycol-mediated transformation. Phytopathology 92: 833–841 [DOI] [PubMed] [Google Scholar]
- Bailey BA, Collins R, Anderson JD (2000b) Factors influencing the herbicidal activity of Nep1, a fungal protein that induces the hypersensitive response in Centaurea maculosa. Weed Sci 48: 776–785 [Google Scholar]
- Bailey BA, Jennings JC, Anderson JD (1997) The 24-kDa protein from Fusarium oxysporum f. sp. erythroxyli: occurrence in related fungi and the effect of growth medium on its production. Can J Microbiol 43: 45–55 [DOI] [PubMed] [Google Scholar]
- Baker CJ, Orlandi EW (1999) Active oxygen and pathogenesis in plants. In G Stacey, NT Keen, eds. Plant-Microbe Interactions. The American Phytopathology Society, St. Paul, MN, pp 81–119
- Braam J, Davis RW (1990) Rain-, wind-, and touch-induced expression of calmodulin and calmodulin-related genes in Arabidopsis. Cell 60: 357–364 [DOI] [PubMed] [Google Scholar]
- Daniel R, Chung SW, Eisenstein TK, Sultzer BM, Wong PM (2001) Specific association of Type I c-Abl with Ran GTPase in lipopolysaccharidemediated differentiation. Oncogene 20: 2618–2625 [DOI] [PubMed] [Google Scholar]
- De Leon IP, Sanz A, Hamberg M, Castresana C (2002) Involvement of the Arabidopsis α-DOX1 fatty acid dioxygenase in protection against oxidative stress and cell death. Plant J 29: 61–62 [DOI] [PubMed] [Google Scholar]
- Du L, Chen Z (2000) Identification of genes encoding receptor-like protein kinases as possible targets of pathogen- and salicylic acid-induced WRKY DNA-binding proteins in Arabidopsis. Plant J 24: 837–847 [DOI] [PubMed] [Google Scholar]
- Eglinton G, Hamilton RJ (1967) Leaf epicuticular waxes. Science 156: 1322–1335 [DOI] [PubMed] [Google Scholar]
- Eulgem T, Rushton PJ, Robatzek S, Somssich IE (2000) The WRKY superfamily of plant transcription factors. Trends Plant Sci 5: 199–206 [DOI] [PubMed] [Google Scholar]
- Fellbrich G, Romanski A, Varet A, Blume B, Brunner F, Engelhardt S, Felix G, Kemmerling B, Krzymowska M, Nurnberger T (2002) NPP1, a Phytophthora-associated trigger of plant defense in parsley and Arabidopsis. Plant J 32: 375–390 [DOI] [PubMed] [Google Scholar]
- Frank W, Munnik T, Kerkmann K, Salamini F, Bartels D (2000) Water deficit triggers phospholipase D activity in the resurrection plant Craterostigma plantagineum. Plant Cell 12: 111–124 [DOI] [PMC free article] [PubMed] [Google Scholar]
- Ganguly S, Singh M (1999) Purification and characterization of a protein phosphatase from winged bean. Phytochemistry 52: 239–246 [DOI] [PubMed] [Google Scholar]
- Goldsbrough PB, Gelvin SB, Larkins BA (1986) Expression of maize zein genes in transformed sunflower cells. Mol Gen Genet 202: 374–381 [Google Scholar]
- Goodman RN (1972) Electrolyte leakage and membrane damage in relation to bacterial population, pH, and ammonia production in tobacco leaf tissue inoculated with Pseudomonas pisi. Phytopathology 62: 1327–1331 [Google Scholar]
- Goodman RN, Kiraly Z, Wood KR (1986) The Biochemistry and Physiology of Plant Disease. University of Missouri Press, Columbia, Missouri
- Graham TL, Graham MY (1991) Cellular coordination of molecular responses in plant defense. Mol Plant-Microbe Interact 4: 415–422 [Google Scholar]
- Hara K, Yagi M, Kusano T, Sano H (2000) Rapid systemic accumulation of transcripts encoding a tobacco WRKY transcription factor upon wounding. Mol Gen Genet 263: 30–37 [DOI] [PubMed] [Google Scholar]
- He D-Y, Yazaki Y, Nishizawa Y, Takai R, Yamada K, Sakano K, Shibuya N, Minami E (1998) Gene activation by cytoplasmic acidification in suspension-cultured rice cells in response to the potent elicitor, N-acetylchitoheptose. Mol Plant-Microbe Interact 11: 1167–1174 [Google Scholar]
- Heath MC (1997) Involvement of reactive oxygen species in the response of resistant (hypersensitive) or susceptible cowpea to the cowpea rust fungus. New Phytol 138: 251–263 [DOI] [PubMed] [Google Scholar]
- Ivanova DG, Sarkar HK, Singh BR (2001) Cloning, expression, and biological activity of recombinant α-cinnamomin: toxicity to cranberry and other plant species. J Natural Toxins 11: 95–102 [PubMed] [Google Scholar]
- Jennings JC, Birkhold PC, Bailey BA, Anderson JD (2000) Induction of ethylene biosynthesis and necrosis in weed leaves by a Fusarium oxysporum protein. Weed Sci 48: 7–14 [Google Scholar]
- Jennings JC, Birkhold PC, Mock NM, Baker CJ, Anderson JD, Bailey BA (2001) Induction of defense responses in tobacco by the protein Nep1 from Fusarium oxysporum. Plant Sci 161: 891–899 [Google Scholar]
- Jetter R, Schaffer S (2001) Chemical composition of the Prunus laurocerasus leaf surface: dynamic changes of the epicuticular wax film during leaf development. Plant Physiol 126: 1725–1737 [DOI] [PMC free article] [PubMed] [Google Scholar]
- Karnovsky MJ (1965) A formaldehyde-glutaraldehyde fixative of high osmolality for use in electron microscopy. J Cell Biol 27: 137 [Google Scholar]
- Kirby KS, Cook EA (1967) Isolation of deoxyribonucleic acid from mammalian tissues. Biochem J 104: 254–257 [DOI] [PMC free article] [PubMed] [Google Scholar]
- Lawrence PK, Koundal KR (2002) Plant protease inhibitors in control of phytophagous insects. Electronic J Biotechnol 5: 93–109 [Google Scholar]
- Laxalt AM, ter Riet B, Verdonk JC, Parigi L, Tameling WI, Vossen J, Haring M, Musgrave A, Munnik T (2001) Characterization of five tomato phospholipase D cDNAs: rapid and specific expression of LePLDβ1 on elicitation with xylanase. Plant J 26: 237–247 [DOI] [PubMed] [Google Scholar]
- Lee J, Klusener B, Tsiamis G, Stevens C, Neyt C, Tampakaki AP, Panopoulos NJ, Noller J, Weiler EW, Cornelis GR et al. (2001) HrpZ(Psph) from the plant pathogen Pseudomonas syringae pv. phaseolicola binds to lipid bilayers and forms an ion-conducting pore in vitro. Proc Natl Acad Sci USA 98: 289–294 [DOI] [PMC free article] [PubMed] [Google Scholar]
- Leshem YY (1984) Ca2:calmodulin-induced and ethylene-mediated membranal phospholipid catabolism as a mode of plant senescence. In P-A Siegenthaler, W Eichenberger, eds. Structure, Function and Metabolism of Plant Lipids. Elsevier Science Publishers, Amsterdam, The Netherlands, pp 181–188
- Meskiene I, Bogre L, Glaser W, Balog J, Brandstotter M, Zwerger K, Ammerer G, Hirt H (1998) MP2C, a plant protein phosphatase 2C, functions as a negative regulator of mitogen-activated protein kinase pathways in yeast and plants. Proc Natl Acad Sci USA 95: 1938–1943 [DOI] [PMC free article] [PubMed] [Google Scholar]
- Meyer SLF, Heath MC (1988a) A comparison of the death induced by fungal invasion or toxic chemicals in cowpea epidermal cells: cell death induced by heavy metal salts. Can J Bot 66: 613–623 [Google Scholar]
- Moran TV, Walker JC (1993) Molecular cloning of two novel protein kinase genes from Arabidopsis thaliana. Biochim Biophys Acta 1216: 9–14 [DOI] [PubMed] [Google Scholar]
- Morris K, MacKerness SA, Page T, John CF, Murphy AM, Carr JP, Buchanan-Wollaston V (2000) Salicylic acid has a role in regulating gene expression during leaf senescence. Plant 23: 677–685 [DOI] [PubMed] [Google Scholar]
- Nelson AJ, Apel-Birkhold PC, Bailey BA (1998) Sequence announcements: GenBank accession number: AF036580. Plant Mol Biol 38: 911–912 [Google Scholar]
- Nelson DR, Kamataki T, Waxman DJ, Guengerich FP, Estabrook RW, Feyereisen R, Gonzalez FJ, Coon MJ, Gunsalus IC, Gotoh O et al. (1993) The P450 superfamily: update on new sequences, gene mapping, accession numbers, early trivial names of enzymes, and nomenclature. DNA Cell Biol 12: 1–51 [DOI] [PubMed] [Google Scholar]
- Oh BJ, Ko MK, Kim YS, Kim KS, Kostenyuk I, Kee HK (1999) A cytochrome P450 gene is differentially expressed in compatible and incompatible interactions between pepper (Capsicum annuum) and the anthracnose fungus, Colletotrichum gloeosporioides. Mol Plant-Microbe Interact 12: 1044–1052 [DOI] [PubMed] [Google Scholar]
- Pappan K, Qin W, Dyer JH, Zheng L, Wang X (1997) Molecular cloning and functional analysis of polyphosphoinositide-dependent phospholipase D, PLDβ, from Arabidopsis. J Biol Chem 272: 7055–7061 [DOI] [PubMed] [Google Scholar]
- Park M, Dean M, Kaul K, Braun MJ, Gonda MA, Vande Woude G (1987) Sequence of MET protooncogene cDNA has features characteristic of the tyrosine kinase family of growth-factor receptors. Proc Natl Acad Sci USA 84: 6379–6383 [DOI] [PMC free article] [PubMed] [Google Scholar]
- Qin W, Pappan K, Wang X (1997) Molecular heterogeneity of phospholipase D (PLD): cloning of PLDγ and regulation of plant PLDγ, -β, and -α by polyphosphoinositides and calcium. J Biol Chem 272: 28267–28273 [DOI] [PubMed] [Google Scholar]
- Ricci P, Bonnet P, Huet JC, Sallantin M, Beauvais-Cante F, Bruneteau M, Billard V, Michel G, Pernollet JC (1989) Structure and activity of proteins for pathogenic fungi Phytophthora eliciting necrosis and acquired resistance in tobacco. Eur J Biochem 183: 555–563 [DOI] [PubMed] [Google Scholar]
- Roussel S, Nicole M, Lopez F, Ricci P, Geiger J-P, Renard M, Brun H (1999) Leptosphaeria maculans and cyrptogein induce similar vascular responses in tissues undergoing the hypersensitive reaction in Brassica napus. Plant Sci 144: 17–28 [Google Scholar]
- Rushton PJ, Somssich E (1999) Transcriptional regulation of plant genes responsive to pathogens and elicitors. In G Stacey, NT Keen, eds. Plant-Microbe Interactions. The American Phytopathological Society, St. Paul, MN, pp 251–274
- Schopfer CR, Ebel J (1998) Identification of elicitor-induced cytochrome P450s of soybean (Glycine max L.) using differential display of mRNA. Mol Gen Genet 258: 315–322 [DOI] [PubMed] [Google Scholar]
- Silverman GA, Bird PI, Carrell RW, Church FC, Coughlin PB, Gettins PG, Irving JA, Lomas DA, Luke CJ, Moyer RW et al. (2001) The serpins are an expanding superfamily of structurally similar but functionally diverse proteins: evolution, mechanism of inhibition, novel functions, and a revised nomenclature. J Biol Chem 276: 33293–33296 [DOI] [PubMed] [Google Scholar]
- Spurr AR (1969) A low-viscosity epoxy resin embedding medium for electron microscopy. J Ultrastruct Res 26: 31. [DOI] [PubMed] [Google Scholar]
- Takemoto D, Hayashi M, Doke N, Nishimura M, Kawakita K (1999) Molecular cloning of a defense-response-related cytochrome P450 gene from tobacco. Plant Cell Physiol 40: 1232–1242 [DOI] [PubMed] [Google Scholar]
- Takezawa D, Liu ZH, An G, Poovaiah BW (1995) Calmodulin gene family in potato: developmental and touch-induced expression of the mRNA encoding a novel isoform. Plant Mol Biol 27: 693–703 [DOI] [PubMed] [Google Scholar]
- van Wees SCM, de Swart EAM, van Pelt JA, van Loon LC, Pieterse MJ (2000) Enhancement of induced disease resistance by simultaneous activation of salicylate- and jasmonate-dependent defense pathways in Arabidopsis thaliana. Proc Natl Acad Sci USA 15: 8711–8716 [DOI] [PMC free article] [PubMed] [Google Scholar]
- Vogeli U, Vogeli-Lange R, Chappell J (1992) Inhibition of phytoalexins biosynthesis in elicitor-treated tobacco cell-suspension cultures by calcium/calmodulin antagonists. Plant Physiol 100: 1369–1376 [DOI] [PMC free article] [PubMed] [Google Scholar]
- Wang ML, Belmonte S, Kim U, Dolan M, Morris JW, Goodman HM (1999) A cluster of ABA-regulated genes on Arabidopsis thaliana BAC T07M07. Genome Res 9: 325–333 [PubMed] [Google Scholar]
- Wang NN, Yang SF, and Charng, Y-Y (2001) Differential expression of 1-aminocyclopropane-1-carboxylate synthase genes during orchid flower senescence induced by the protein phosphatase inhibitor okadaic acid. Plant Physiol 126: 253–260 [DOI] [PMC free article] [PubMed] [Google Scholar]
- Weaver LM, Gan S, Quirino B, Amasino RM (1998) A comparison of the expression patterns of several senescence-associated genes in response to stress and hormone treatment. Plant Mol Biol 37: 455–469 [DOI] [PubMed] [Google Scholar]
- Yen SK, Chung MC, Chen PC, Yen HE (2001) Environmental and developmental regulation of the wound-induced cell wall protein WI12 in the halophyte ice plant. Plant Physiol 127: 517–528 [PMC free article] [PubMed] [Google Scholar]
- Yoo BC, Aoki K, Xiang Y, Campbell LR, Hull RJ, Xoconostle-Cazares B, Monzer J, Lee JY, Ullman DE, Lucas WJ (2000) Characterization of Cucurbita maxima phloem serpin-1 (CmPS-1): a developmentally regulated elastase inhibitor. J Biol Chem 275: 35122–35128 [DOI] [PubMed] [Google Scholar]
- Yu D, Chen C, Chen Z (2001) Evidence for an important role of WRKY DNA-binding proteins in the regulation of NPR1 gene expression. Plant Cell 13: 1527–1540 [DOI] [PMC free article] [PubMed] [Google Scholar]


