Abstract
Actinomycin D (ACTD) has been shown to bind weakly to the sequence -GGCC-, despite the presence of a GpC site. It was subsequently found, however, that d(CATGGCCATG) binds relatively well to ACTD but exhibits unusually slow association kinetics, contrary to the strong-binding -XGCY- sites. In an effort to elucidate the nature of such binding and to delineate the origin of its interesting kinetic behavior, studies have now been extended to include oligomers with the general sequence motifs of d(CXYGGCCY′X′G)2. It was found that analogous binding characteristics are observed for these self-duplex decamers and comparative studies with progressively base-truncated oligomers from the 5′-end led to the finding that d(GGCCY′X′G) oligomers bind ACTD considerably stronger than their parent decamers and exhibit 1:1 drug/strand binding stoichiometry. Melting profiles monitored at the drug spectral region indicated additional drug binding prior to the onset of eventual complex disruptions with near identical melting temperatures for all the oligomers studied. These results are consistent with the notion that the related oligomers share a common strong binding mode of a hairpin-type, with the 3′-terminus G folding back to base-pair with the C base of GGC. A binding scheme is proposed in which the oligomers d(CXYGGCCY′X′G) exist predominantly in the duplex form and bind ACTD initially at the central GGCC weak site but subsequently disrupt to accommodate the stronger hairpin binding and thus the slow association kinetics. Such a mechanism is supported by the observation of distinct biphasic fluorescence kinetic traces in the binding of 7-amino-ACTD to these duplexes.
INTRODUCTION
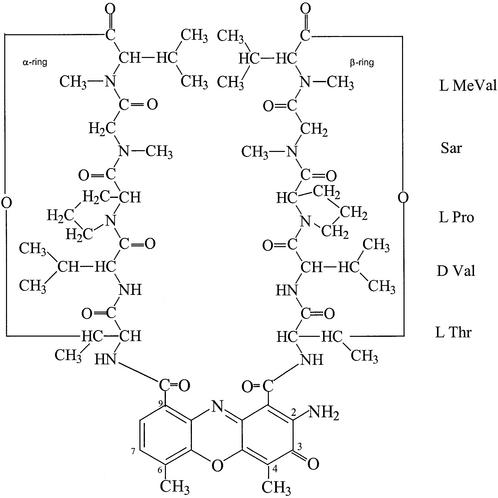
Actinomycin D (ACTD) is one of the most exhaustively studied DNA-binding ligands and its widespread interest stems from its function as a model sequence-specific antitumor antibiotic. It consists of a planar 2-aminophenoxazin-3-one chromophore with two bulky cyclic pentapeptide lactones (Fig. 1). The drug exerts its biological function via inhibition of transcription in a wide variety of systems. It binds to duplex DNA via intercalation with high affinity and dissociates slowly from DNA, which had led to a suggested mechanism whereby the drug blocks the progression of RNA polymerase along the template DNA to terminate transcription (1). The DNA binding of ACTD is quite sequence-specific and has been shown to greatly prefer the duplex GpC site. This base-sequence specificity derives mainly from the formation of strong hydrogen bonds in the minor groove, between the N-2 amino group and N-3 ring nitrogen of the two guanine-residues with the carbonyl oxygen atoms and amide groups of threonine residues of the cyclic peptapeptides, respectively (2,3). These essential drug–DNA hydrogen bonds are protected by the cyclic pentapeptides, which effectively shield them from solvent exposure.
Figure 1.
The chemical structure of actinomycin D.
The four-base-paired binding site size suggests that the binding characteristic of ACTD to a GpC site may likely be affected by the adjacent flanking base pairs. Indeed, our studies with self-complementary (4) as well as non-self-complementary (5) oligomers containing -XGCY- sites revealed that the binding affinity for and dissociation kinetics from DNA of this drug are, indeed, greatly affected by the nature of the adjacent X and Y bases. For example, ACTD binds strongly to and dissociates very slowly from the -TGCA- site, whereas it binds weakly and dissociates very rapidly from the -GGCC- sequence (4). It was subsequently uncovered that, in contrast to oligomers such as d(TATGGCCATA)2, the sequence d(CATGGCCATG)2 binds relatively well to ACTD but with an unusually slow association rate (6) not exhibited by the corresponding oligomers containing strong ACTD-binding tetranucleotide sequences such as -TGCA-, -AGCT- and -CGCG-. To account for the observed slow association kinetics, the following model was originally speculated (6): the conformation of the -GGCC- sequence in d(CATGGCCATG) exists predominantly in a non-standard B-conformation which has a low affinity for ACTD. Thus, the ACTD molecules initially bind to the decameric duplex via stacking at the terminal G·C base pairs. Their hydrogen bonding interactions with one of the pentapeptide rings at the minor groove result in significant conformational alterations at the central -GGCC- sequence to make the intercalative ACTD binding at the GpC site more favorable. The initial binding of drugs, however, has considerably stabilized the duplex so that the rate of base-pair opening to accommodate the drug becomes significantly slower than decamers containing a strong binding -XGCY- sequence, and hence the observed order of magnitude slower ACTD association rate.
However, there have been reports to indicate that this drug may also bind strongly to some non-GpC-containing sequences (7–9) and even to some single-stranded DNA (10–15). Subsequent studies led to the finding that d(CGTCGTCG) and d(CGACGACG) also bind strongly to ACTD despite the lack of self-complementarity (16). Most recently it was also discovered that ACTD binds strongly to sequences such as d(TGTCATTG) (17) and d(TGTCATG) (18) with 1:1 drug to strand binding stoichiometry. Base-displacement binding models of hairpin for the former and slipped duplex for the latter have been proposed, based on the binding principle that both faces of the ACTD chromophore prefer to be stacked by the G-bases (2,19,20). In view of the fact that the oligomer d(CATGGCCATG) contains both the key bases at identical locations (underlined) and CATG sequences present in the two respective strong-ACTD-binding oligomers, a reinvestigation of the observed slow association kinetics exhibited by this sequence appears to be in order and has now been extended to include oligomers of sequence motifs d(CXYGGCCY′X′G), where X′, Y′ are complementary to X, Y, respectively. The results of these studies and the arrived conclusion are presented herein.
MATERIALS AND METHODS
Synthetic oligonucleotides were purchased from ResGen (Huntsville, AL) and used without further purification. These oligomers were purified by the vendor via reverse-phase oligonucleotide purification cartridges and exhibited single-band electrophoretic mobility in denaturing polyacrylamide gel electrophoresis with stated purity of ≥95%. Concentrations of the DNA solutions (in nucleotide) were determined by measuring the absorbances at 260 nm after melting (at 95°C). The extinction coefficients of DNA oligomers were obtained via nearest-neighbor approximation using mono- and di-nucleotide values tabulated in Fasman (21). ACTD and 7-amino-ACTD (7AM-ACTD) were purchased from Serva. Concentrations of the drug solutions were determined by measuring the absorbances at 440 nm (for ACTD) and 528 nm (for 7AM-ACTD), using extinction coefficients of 24 500 and 23 600 cm–1 M–1, respectively. Stock solutions for oligonucleotides and drugs were prepared by dissolving in 10 mM Tris-borate buffer solution of pH 8 containing 0.1 M NaCl and 1 mM MgCl2. Absorption spectra were measured with a Cary 1E spectrophotometric system. Absorption spectral titrations were carried out by starting with a 5 µM ACTD solution of 2 ml followed by progressive additions of the oligomer stock at equal time intervals. Absorbance differences between 427 and 480 nm during absorption spectral titrations were used to obtain the binding isotherms. Fluorescence spectra were obtained with a SLM 48000S system. Circular dichroic (CD) spectra were measured at room temperature with a Jasco J-500A recording spectropolarimeter using water-jacketed cylindrical cells of 2-cm path length.
Association binding constants (K) were extracted via nonlinear least-squares fits on the experimental binding isotherms using 1:1 drug to strand binding model: D + S = DS, where D, S and DS are free drug, free single-stranded DNA and drug–DNA complex, respectively. By means of equations for the mass balances of drug and DNA (in strand), the following equations can be derived:
D2K + D[KDt(X – 1) + 1] = Dt
S = Dt(X – 1) + D
Y = (εD + ε1KS)D/Dt
where X ≡ St/Dt, εD and ε1 are the extinction coefficients of the free and bound drugs, and Dt and St are the total drug and DNA strand concentrations, respectively, at each point of the titration. Experimental binding isotherms were plotted as the apparent extinction coefficient (Y) versus X, and nonlinear least-squares fits with the above equations were made by initially fixing the known εD and subsequently relaxed to obtain the best fit to extract the binding constant K. Nonlinear least-squares fit program of Micromath (Salt Lake City, UT) was used for our fitting purpose.
RESULTS
ACTD binds considerably stronger to d(GGCCY′X′G) than to d(CXYGGCCY′X′G)2 and exhibits a 1:1 drug/strand binding stoichiometry
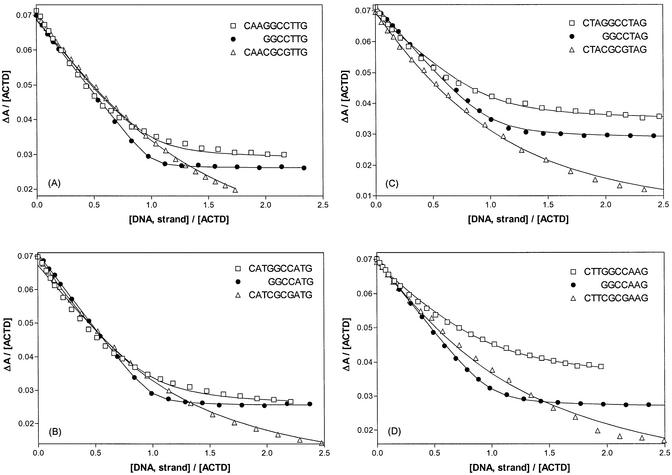
Equilibrium binding isotherms for the ACTD binding to the parent decamers d(CXYGGCCY′X′G) and their corresponding 5′-end shortened heptamers d(GGCCY′X′G) are shown in Figure 2. As is apparent from the more abrupt leveling off, d(GGCCY′X′G) oligomers bind considerably stronger to ACTD than their self-complementary parents d(CXYGG CCY′X′G)2. A distinct saturation for the heptamers occurring at the DNA strand to drug ratio of ∼1 strongly suggests a 1:1 drug/strand binding stoichiometry. Thus, the binding isotherms were fitted with the 1:1 binding model and the nonlinear least-squares fitted curves are shown as solid lines in the figure for comparison. As can be seen, the fits for d(GGCCY′X′G) are excellent, but less so for their parent decamers. The binding isotherms for the parent decamers d(CXYGGCCY′X′G) can be seen to be not as strong and the saturation points not as distinct as their shortened counterparts. The extracted binding constants are in the order of 1 × 10⁷ and 1 × 10⁶ M–1 for the 7- and 10mers, respectively (see Table 1). To provide further insight into the binding mode, studies were also made with d(CXYCGCGY′X′G) in which ACTD is expected to bind at the duplex CGCG site. The ACTD binding isotherms for these oligomers were also included in Figure 2 for comparison. It is clearly evident that saturation was definitely not reached at the strand/drug ratio of 1 for the CGCG-containing decamers since one drug should be binding to a duplex (two strands). Indeed, curve fits with 1:1 drug to strand binding model for these isotherms are apparently not as good.
Figure 2.
Comparison of equilibrium binding isotherms at 25°C for ACTD binding to d(CXYGGCCY′X′G), d(GGCCY′X′G) and d(CXYCGCGY′X′G). ΔA is the absorbance difference between 427 and 480 nm. Both ACTD and DNA strand concentrations are in µM. Solid lines are the nonlinear least-squares fitted curves using the 1:1 drug to strand binding model as described in the text and the extracted binding constants are shown in Table 1.
Table 1. Comparison of binding and melting parameters of d(CXYGGCCY′X′G) and related oligomers obtained via base removal from the 5′-end.
| Oligomer | K (µM–1) | Tm0 (°C) | Tm (°C) |
|---|---|---|---|
| CAAGGCCTTG | 1.4 ± 0.3 | 51 | 60 |
| AAGGCCTTG | 4.8 ± 0.3 | 41 | 62 |
| AGGCCTTG | 16 ± 1 | 28 | 60 |
| GGCCTTG | 33 ± 6 | 24 | 61 |
| CATGGCCATG | 3.4 ± 1.3 | 49 | 63 |
| ATGGCCATG | 2.9 ± 0.2 | 41 | 63 |
| TGGCCATG | 6.4 ± 0.9 | 29 | 62 |
| GGCCATG | 25 ± 4 | 23 | 64 |
| CTAGGCCTAG | 1.3 ± 0.3 | 46 | 63 |
| TAGGCCTAG | 4.1 ± 0.2 | 40 | 63 |
| AGGCCTAG | 24 ± 9 | 30 | 60 |
| GGCCTAG | 7 ± 1 | 26 | 64 |
| CTTGGCCAAG | 1.1 ± 0.2 | 50 | 61 |
| TTGGCCAAG | 2.3 ± 0.3 | 40 | 63 |
| TGGCCAAG | 4.1 ± 0.2 | 32 | 64 |
| GGCCAAG | 10 ± 1 | 27 | 62 |
Equilibrium titrations were carried out at 25°C and the binding constant K is obtained via nonlinear least-squares fit to the experimental isotherm using the simple 1:1 drug to strand binding model. Tm0 and Tm are the melting temperatures of 40 µM of DNA (in nucleotide) containing 0.1 M NaCl in the absence and in the presence of 8 µM ACTD, respectively. The melting profiles were obtained via absorbance monitoring for DNA at 275 nm and for DNA–drug complex at 427 nm.
It is also instructive to compare the Scatchard plots for these three types of oligomers (not shown). The much stronger ACTD binding affinities of the heptamers d(GGCCY′X′G) were evident from their steeper slopes as compared to their decameric counterparts and their apparent 1:1 binding stoichiometries could clearly be seen by the intercept of r ([bound drug]/[DNA, strand]) at ∼1. And consistent with the expected 1:1 drug to duplex (1:2 drug/strand) stoichiometry for d(CXYCGCGY′X′G), the values of their r-intercepts are considerably smaller than 1 and closer to 0.5.
To see if the much stronger ACTD binding of d(GGCCY′X′G) could be the consequence of reduced self-complementarity for more facile single strand formation, comparative studies of the parent decamers and their corresponding shorter oligomers derived from successive base-removal from the 5′-end were also made. Their extracted binding constants via model-fit are summarized in Table 1. The general trend of progressive increase in ACTD binding affinity as the sequence is shortened is clearly evident. Dramatic weakening of ACTD binding is observed for oligomers d(CCY′X′G) (results not shown) but some affinities were retained for d(GCCY′X′G). Binding constants (in µM–1) of 2.6 ± 0.1, 5.1 ± 0.2, 1.6 ± 0.1 and 0.7 ± 0.1 were found for d(GCCTTG), d(GCCATG), d(GCCTAG) and d(GCCAAG), respectively. These can be seen to be between 4- and 14-fold weaker than their d(GGCCY′X′G) counterparts (compare with Table 1).
Melting temperatures of the drug–DNA complexes are nearly identical for the parent as well as the shortened oligomers
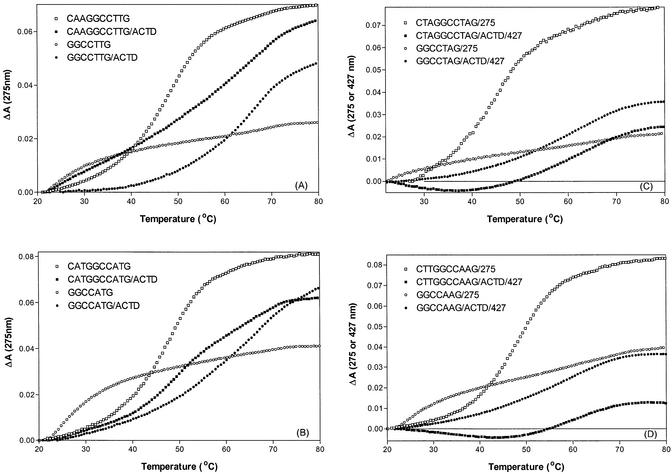
Melting temperatures for these oligomers in the absence (extracted via 275-nm profiles) and in the presence of ACTD (extracted via 427-nm profiles) are also included in Table 1 for comparison. As expected, the melting temperature of an oligomer decreases as the sequence becomes shorter as a consequence of the decreased number of possible base pairings for duplex formation. Interestingly, however, the melting temperatures of the drug complexes do not differ greatly, hovering around 62°C for all the oligomers studied. These results suggest that, despite the differing duplex stability, these oligomers may in fact share a common strong ACTD binding mode.
Comparison of melting profiles at 275 and 427 nm suggests additional ACTD binding in the temperature region where DNA duplex is in the process of melting
The melting characteristics of some of these oligomers in the absence and in the presence of ACTD are illustrated in Figure 3. The melting profiles with 275-nm monitoring for d(CAAGGCCTTG) and d(CATGGCCATG) are compared with their corresponding shorter heptamers d(GGCCTTG) and d(GGCCATG) in panels A and B, respectively. The predominance of duplex conformations at room temperature for the self-complementary decamers d(CXYGGCCY′X′G) is apparent from their melting temperatures of ∼50°C, whereas those of the heptamers are near 25°C. Despite such vast differences in their duplex stability, however, the melting temperatures of the drug–DNA complexes increased to ∼62°C (via 427-nm monitoring) for both types of oligomers, but the 275-nm melting profiles are less cooperative (see Fig. 3A) and not monophasic (see Fig. 3B) for the decameric sequences. To provide additional insight into the nature of drug binding, the melting of drug–DNA complex was also monitored by the absorbance changes at 427 nm. Melting profiles at two different wavelengths for d(CTAGGCCTAG) and d(CTTGGCCAAG) along with their heptameric counterparts are compared in Figure 3C and D, respectively. As expected, the disruption of drug complexes for the heptamers was accompanied by a monophasic melting profile of absorbance increase at 427 nm. However, for the drug complexes of the parent decamers the absorbance increase due to the disruption of the complex near 62°C is preceded by an absorbance decrease. The minima of the 427-nm profiles correspond to the melting regions of the DNA duplexes in the absence of drug (see the melting profiles with 275-nm monitoring), suggesting additional drug binding upon DNA duplex melting and subsequent disruption of the complex. Similar melting characteristics were also observed for d(CAAGGCCTTG) and d(CATGGCCATG). Such an observation is consistent with the notion that the released drug molecules further bind to single-stranded DNA to accomplish a stronger binding and account for the less cooperative and multiphasic nature of the 275-nm melting profiles for the drug complexes.
Figure 3.
Comparison of melting profiles for d(CXYGGCCY′X′G) and d(GGCCY′X′G) in the absence and in the presence of ACTD. The DNA and ACTD concentrations are 40 and 8 µM, respectively. Heating rate of 0.5°C/min was maintained during the experiment. Thermal denaturation of DNA was monitored at 275 nm whereas the disruption of the drug–DNA complex was monitored at 275 nm in (A and B) but at 427 nm in (C and D).
Association kinetic studies via fluorescence monitoring
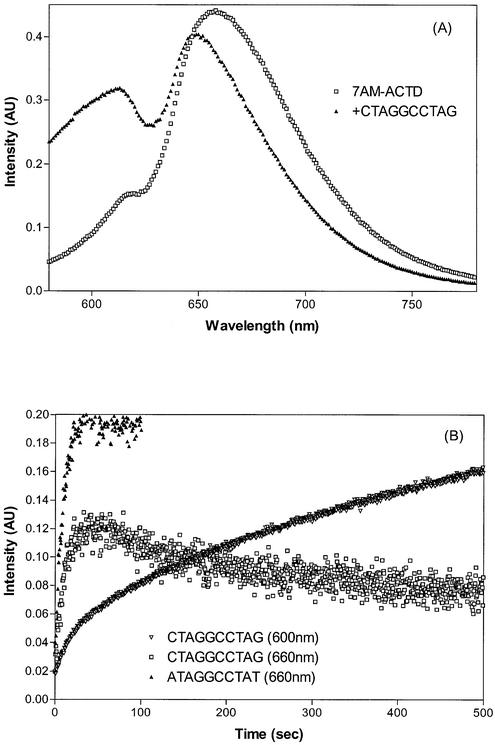
Although ACTD is only slightly fluorescent, its 7-amino derivative is strongly so and it is known that the amino group substitution does not greatly alter the intercalative binding nature of this derivative. Thus, fluorescence spectral alteration upon DNA binding can provide additional insight into the binding processes. The emission spectral characteristics of 7AM-ACTD in the absence and in the presence of d(CTAGGCCTAG) are compared in Figure 4A. The emission spectrum of the drug exhibits intensity maximum at ∼660 nm with excitation at 560 nm. In the presence of DNA oligomer, however, intensity enhancement and depression are observed in the region of 600 and 660 nm, respectively. Thus, association kinetic behavior of drug binding to these oligomers can be investigated by monitoring the fluorescence intensity changes at these spectral regions.
Figure 4.
(A) Comparison of fluorescence spectral characteristics of 2 µM 7AM-ACTD in the absence and in the presence of 40 µM d(CTAGGCCTAG) with excitation wavelength at 560 nm. (B) Comparison of fluorescence kinetic traces at 20°C for the binding of 7AM-ACTD to d(CTAGGCCTAG) (monitored at 600 and 660 nm) and to d(ATAGGCCTAT) (monitored at 660 nm) with 560-nm excitation.
The association kinetic traces of fluorescence at 600 and 660 nm with 560 nm excitation for 7AM-ACTD binding to d(CTAGGCCTAG) at 20°C are shown in Figure 4B. As can be seen, a significant intensity enhancement with slow kinetics is observed at 600 nm and the biphasic nature of the kinetic trace is clearly evident, with a fast component being followed by a considerably slower process. Nonlinear least-squares fit led to the extraction of two rate constants of 0.11 and 0.0024 s–1, or characteristic times of 9.1 and 420 s, respectively. The biphasic nature of the kinetic process can be more dramatically illustrated by monitoring the emission intensity at 660 nm upon DNA binding (Fig. 4B). The kinetic trace at this wavelength exhibits an initial burst of intensity enhancement followed by a much slower decay with intensity reduction. To provide further insight into the nature of the binding processes, studies were also made with d(ATA GGCCTAT) where the terminal C and G bases have been replaced by A and T, respectively. Only the fast process was observed, with the apparent absence of the slow kinetic component (Fig. 4B). Single-exponential fit led to a rate constant of 0.13 s–1, or a characteristic time of ∼8 s, a value akin to the observed fast component of the d(CTAGGCC TAG) duplex. Thus, it is apparent that the fast kinetic process can reasonably be associated with the initial drug binding at the GGCC site of d(CTAGGCCTAG) and that the presence of the terminal G base at the 3′-end (see later) appears to be responsible for the presence of the slow kinetic behavior.
Fluorescence spectral comparison
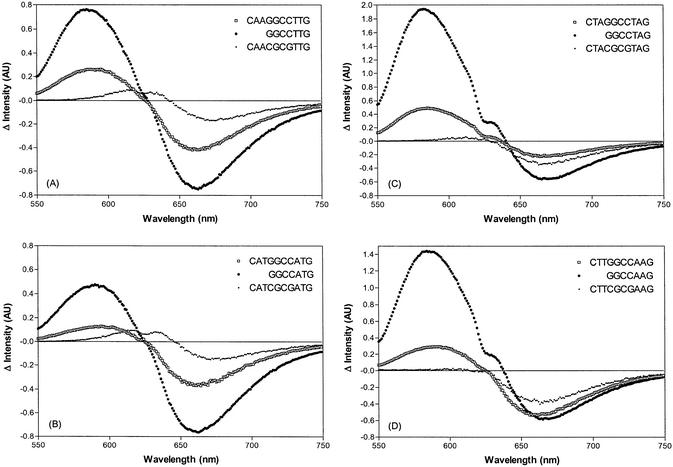
Fluorescence difference spectra for 7AM-ACTD in the absence and in the presence of d(CXYCGCGY′X′G), d(CXYGGCCY′X′G) and d(GGCCY′X′G) are compared in Figure 5. Binding of the drug to d(CXYCGCGY′X′G) results in only a weak intensity reduction near 650 nm. On the other hand, the drug binding to d(GGCCY′X′G) resulted in not only a strong fluorescence intensity reduction near 620 nm but also a concomitant intensity enhancement around 580 nm. Interestingly, aside from the considerably reduced intensity, the difference fluorescence spectra for d(CXYGGCCY′X′G) are similar to those of d(GGCCY′X′G). These results are consistent with the notion that, contrary to the classic intercalative binding mode of d(CXYCGCGY′X′G) at the GpC duplex site, d(CXYGGCCY′X′G) partially exhibits the strong binding mode of d(GGCCY′X′G). The induced fluorescence spectral features of d(CXYGGCCY′X′G) can thus be regarded as a hybrid of these two extremes, suggesting the co-existence of both binding modes in this oligomer.
Figure 5.
Comparison of difference fluorescence emission spectra (drug/DNA–drug) at 20°C for the 7AM-ACTD binding to d(CXYGGCCY′X′G), d(GGCCY′X′G) and d(CXYCGCGY′X′G). Concentrations for drug and DNA are 2 and 40 µM, respectively. Excitation wavelength was at 525 nm.
CD spectral comparison
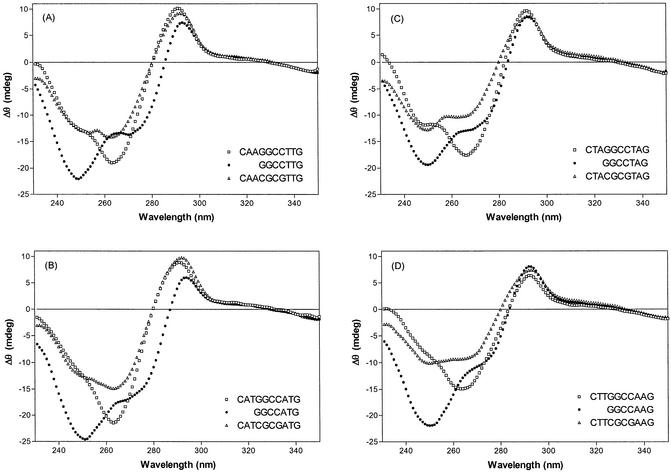
ACTD binding also induces a substantial CD spectral alteration in the DNA spectral region. Thus, induced CD spectral characteristics can also provide some indications on the differing binding modes. Distinct CD spectral characteristics are induced by ACTD binding to d(CXYGGCCY′X′G), d(GGCCY′X′G) and d(CXYCGCGY′X′G) as illustrated by the comparison of their CD difference spectra (ACTD/DNA–DNA) in Figure 6. Negative CD maxima at 250 nm and shoulders around 275 nm are induced by ACTD binding to d(GGCCY′X′G), whereas negative maxima near 265 nm and slight shoulders around 250 nm are apparent for binding to d(CXYGGCCY′X′G). On the other hand, the intensities near 250 and 265 nm are not greatly different for binding to d(CXYCGCGY′X′G).
Figure 6.
Comparison of CD difference spectra (ACTD/DNA–DNA) for ACTD binding to d(CXYGGCCY′X′G), d(GGCCY′X′G) and d(CXYCGCGY′X′G). CD measurements were made at room temperature using cylindrical cells of 2-cm path length. Concentrations for ACTD and DNA are 7 and 40 µM (in nucleotide), respectively.
DISCUSSION
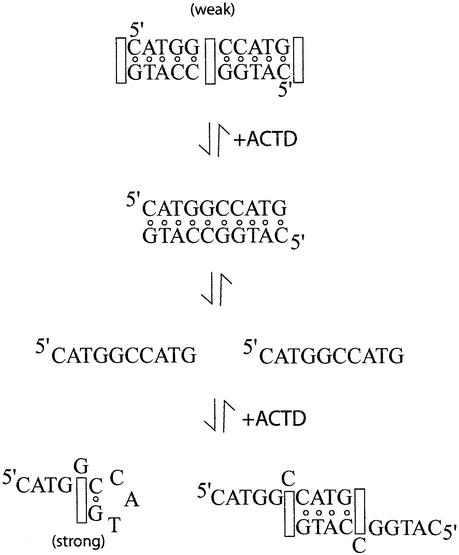
The near identical melting temperatures exhibited by the drug complexes of self-complementary decamers d(CXYGGC CY′X′G) as well as their 5′-end truncated oligomers suggest that these sequences likely share a common strong binding mode, a notion also supported by their similar induced fluorescence spectral characteristics. The stronger ACTD binding affinities for the shorter oligomers with reduced self-complementarity suggest that this strong binding mode is likely to be single-stranded in nature and that duplex formation might hinder such binding and hence weaken the ACTD affinity of the self-complementary parent decamers. This is further supported by the observed additional ACTD binding in the temperature region of the duplex melting for d(CXYGGCCY′X′G)2 and the multi-mode nature of ACTD binding to these duplexes, as manifested by the less cooperative or even biphasic melting of their drug complexes, as well as the observation that the fluorescent spectral features of 7AM-ACTD induced by binding to d(CXYGGCCY′X′G) appear as a hybrid of intercalative binding of d(CXYCG CGY′X′G) and hairpin binding of d(GGCCY′X′G). A binding model can thus be speculated in which oligomer d(CXYGGCCY′X′G) exists predominantly in the duplex form and ACTD molecules initially bind to the weak sites of the duplex (GGCC site and possibly duplex termini) upon drug addition. However, due to the stronger ACTD affinity for hairpins of the GGCCY′X′G motif, some duplexes dissociate to accomplish such a binding and thus the observed slow association kinetic component. The schematic of the likely binding processes is illustrated in Figure 7.
Figure 7.
Schematic drawings of the proposed binding of ACTD to d(CATGGCCATG) to explain the observed kinetic behavior.
For the parent self-complementary decamers in solution, the duplex conformation will be the predominant form. Thus, the majority of added drug molecules will initially bind to the central GpC site, contributing to the fast kinetic process, though some will bind to the single-stranded form as a hairpin and/or a slipped duplex. Contributions from the slipped duplexes are expected to be rather minor due to the greatly reduced number of base pair formations as well as the very dilute concentrations in our optical experiments. Due to the stronger binding of the hairpin form, the equilibrium between the duplex and single strands will be shifted to the side of single strand for further binding as hairpins to establish new equilibrium, thus contributing to the observed slower kinetic process. Such a kinetic scheme is supported by the finding that only a fast kinetic process and low affinity are observed for 7AM-ACTD binding to d(ATAGGCCTAT), where no G base is present at the 3′-terminus for possible fold-back hairpin formation for the strong drug binding. The absence of the slow kinetic component for the heptamers d(GGCCY′X′G) (results not shown) on the other hand, can be attributed to the predominance of the single-stranded form of these oligomers in solutions with little need for the duplex disruption to achieve the strong drug binding to form the hairpin complex.
The most likely hairpin conformation is for the 3′-terminus G to fold back and base-pair with the C base of the GGC to result in a hairpin with a CY′X′ loop, since the other G·C base-pair formation will result in a two-base loop which will be energetically less feasible. The obvious binding will then be for the ACTD chromophore to insert at the GpC site so that one side of the phenoxazone ring will be stacked by a G and the other side by the C·G base pair. However, a similar base-stacking pattern can also be accomplished by flipping out the central G of the GGC sequence. Such a binding mode and its unusual stability is akin to what had earlier been proposed for the strong single strand binding of sequence motifs such as d(TGTCATTG) (17) and d(TGTCTnG) (22). Such a hairpin-binding mode with displaced base(s) to accomplish both sides of the phenoxazone ring of ACTD being stacked by 3′-sides of G bases have been confirmed by NMR studies on d(GXCACCGYC) sequence motifs, where X and Y are complementary to each other (23). These oligomers form hairpins with ACC loops to result in the formation of 5′-GXC/CYG-5′ duplex stems. The loop-out X/Y bases upon ACTD binding, however, are not disordered but interact perpendicularly with the base/chromophore and form specific hydrogen bonds with DNA, thus contributing to the added stability of the complex.
The flipped-base hairpin binding mode appears to be favored, as evidenced by the observed stronger ACTD binding affinities of d(GGCCY′X′G) as compared to those of d(GCCY′X′G) where the binding is expected to be at the GpC site. The structural bases for the stronger binding for the base-displaced complex can be justified from the NMR results on the d(G1G2C3A4C5C6G7C8C9) oligomer that forms a hairpin with the 5′-G1G2C3/C9C8G7-5′ duplex stem and ACC loop (23). Thus, one would expect ACTD to insert at the GpC site to form the classic intercalation complex, yet the NMR measurements indicate a predominant binding mode of disrupting the central G·C base pair to accommodate the phenoxazone ring insertion. The looped-out G2/C8 residue in the complex does not change the G1/phenoxazone/G7 stacking core and the hydrogen bonding between the DNA guanines and the ACTD-l-Thr residues. The two looped-out perpendicular G2/C8 bases do interact well with the ACTD phenoxazone 6CH3 and 4CH3 groups and also participate in perpendicular interaction with the G1/phenoxazone/G7 stacking core in the major groove. Furthermore, hydrogen bonds between the C8NH2-G7PO5′ atoms and the phenoxazone-2NH2-G2O4′ atoms are also observed. Altogether, these factors may explain the extraordinary stability of this kind of complex and make plausible our proposed kinetic scheme on ACTD binding to DNA of the self-complementary sequence motifs d(CXYGGCCY′X′G).
Finally, our preliminary NMR studies did indicate that the addition of ACTD to the 5′-GGCCATG-3′ oligomer strongly induces the structural formation of the seemingly single-stranded DNA oligomer (Chou,S.-H., Chin,K.-H. and Chen,F.-M., unpublished results). Detailed NMR studies on such a complex are currently underway and will be reported at a later date.
Acknowledgments
ACKNOWLEDGEMENT
Research supported by a subproject of Minority Biomedical Research Support (MBRS) Grant S06GM0892.
Note added in proof
This paper should be considered as back-to-back with Chin,K.-H., Chen,F.-M. and Chou,S.-H. (2003) Solution structure of the ActD–5′-CCGTT3GTGG-3′ complex: drug interaction with tandem G·T mismatches and hairpin loop backbone. Nucleic Acids Res., 31, 2622–2629.
REFERENCES
- 1.Muller W. and Crother,D.M. (1968) Studies of the binding of actinomycin and related compounds to DNA. J. Mol. Biol., 35, 251–290. [DOI] [PubMed] [Google Scholar]
- 2.Sobell H.M. and Jain,S.C. (1972) Stereochemistry of actinomycin binding to DNA II. Detailed molecular model of actinomycin–DNA complex and its implication. J. Mol. Biol., 68, 21–34. [DOI] [PubMed] [Google Scholar]
- 3.Kamitori S. and Takusagawa,F. (1992) Crystal structure of the 2:1 complex between d(GAAGCTTC) and the anticancer drug actinomycin D. J. Mol. Biol., 225, 445–456. [DOI] [PubMed] [Google Scholar]
- 4.Chen F.-M. (1988) Binding specificities of actinomycin D to self-complementary tetranucleotide sequences -XGCY-. Biochemistry, 27, 6393–6397. [DOI] [PubMed] [Google Scholar]
- 5.Chen F.-M. (1992) Binding specificities of actinomycin D to non-self-complementary -XGCY- tetranucleotide sequences. Biochemistry, 31, 6223–6228. [DOI] [PubMed] [Google Scholar]
- 6.Chen F.-M. (1990) Observation of an anomalously slow association kinetics in the binding of actinomycin D to d(CATGGCCATG). Biochemistry, 29, 7684–7690. [DOI] [PubMed] [Google Scholar]
- 7.Snyder J.G., Hartman,N.G., D’Estantoit,B.L., Kennard,O., Remeta,D.P. and Breslauer,K.P. (1989) Binding of actinomycin D to DNA: evidence for a nonclassical high-affinity binding mode that does not require GpC sites. Proc. Natl Acad. Sci. USA, 86, 3968–3972. [DOI] [PMC free article] [PubMed] [Google Scholar]
- 8.Rill R.L., Marsch,G.A. and Graves,D.E. (1989) 7-Azido-actinomycin D: a photoaffinity probe of the sequence specificity of DNA binding by actinomycin D. J. Biomol. Struct. Dynam., 7, 591–605. [DOI] [PubMed] [Google Scholar]
- 9.Bailey S.A., Graves,D.E. and Rill,R. (1994) Binding of actinomycin D to the T(G)nT motif of double-stranded DNA: determination of the guanine requirement in nonclassical, non-GpC binding sites. Biochemistry, 33, 11493–11500. [DOI] [PubMed] [Google Scholar]
- 10.Wadkins R.M. and Jovin,T.M. (1991) Actinomycin D and 7-aminoactinomycin D binding to single-stranded DNA. Biochemistry, 30, 9469–9478. [DOI] [PubMed] [Google Scholar]
- 11.Hsieh Y.L., Li,Y.T. and Henion,J.D. (1994) Studies of non-covalent interactions of actinomycin D with single-stranded oligodeoxynucleotides by ion spray mass spectrometry and tandem mass spectrometry. Biol. Mass Spectrom., 116, 272–276. [DOI] [PubMed] [Google Scholar]
- 12.Wadkins R.M., Jares-Erijman,E.A., Klement,R., Rudiger,A. and Jovin,T.M. (1996) Actinomycin D binding to single-stranded DNA: sequence specificity and hemi-intercalation model from fluorescence and 1H NMR spectroscopy. J. Mol. Biol., 262, 53–68. [DOI] [PubMed] [Google Scholar]
- 13.Rill R.L. and Hecker,K.H. (1996) Sequence-specific actinomycin D binding to single-stranded DNA inhibits HIV reverse transcriptases and other polymerases. Biochemistry, 35, 3525–3533. [DOI] [PubMed] [Google Scholar]
- 14.Wadkins R.M., Vladu,B. and Tung,C.-S. (1998) Actinomycin D binds to metastable hairpins in single-stranded DNA. Biochemistry, 37, 11915–11923. [DOI] [PubMed] [Google Scholar]
- 15.Yoo H. and Rill,R.L. (2001) Actinomycin D binding to unstructured, single-stranded DNA. J. Mol. Recognit., 14, 145–150. [DOI] [PubMed] [Google Scholar]
- 16.Sha F. and Chen,F.-M. (2000) Actinomycin D binds strongly to d(CGACGACG) and d(CGTCGTCG). Biophys. J., 79, 2095–2104. [DOI] [PMC free article] [PubMed] [Google Scholar]
- 17.Chen F.-M. and Sha,F. (2001) Actinomycin D binds strongly to d(TGTCATTG), a single-stranded DNA devoid of GpC sites. Biochemistry, 40, 5218–5225. [DOI] [PubMed] [Google Scholar]
- 18.Chen F.-M. and Sha,F. (2002) Actinomycin D binds to d(TGTCATG) with 2:1 drug to duplex stoichiometry. Biochemistry, 41, 5043–5049. [DOI] [PubMed] [Google Scholar]
- 19.Krugh T.R. (1972) Association of actinomycin D and deoxyribodinucleotides as a model for binding of the drug to DNA. Proc. Natl Acad. Sci. USA, 69, 1911–1914. [DOI] [PMC free article] [PubMed] [Google Scholar]
- 20.Krugh T.R. and Neely,J.W. (1973) Actinomycin D-deoxydinucleotide interactions as a model for binding of the drug to deoxyribonucleic acid. Proton magnetic resonance results. Biochemistry, 12, 4418–4425. [DOI] [PubMed] [Google Scholar]
- 21.Fasman,G.D. (1975) CRC Handbook of Biochemistry and Molecular Biology, 3rd Edn. Chemical Rubber Publishing Co., Cleveland, OH, Vol. I, pp. 589. [Google Scholar]
- 22.Chen F.-M., Sha,F., Chin,K.-H. and Chou,S.-H. (2003) Binding of actinomycin D to single-stranded DNA of sequence motifs d(TGTCTnG) and d(TGTnGTCT). Biophys. J., 84, 432–439. [DOI] [PMC free article] [PubMed] [Google Scholar]
- 23.Chou S.-H., Chin,K.-H. and Chen,F.-M. (2002) Looped-out and perpendicular: deformation of Watson–Crick base pair associated with actinomycin D binding. Proc. Natl Acad. Sci. USA, 99, 6625–6630. [DOI] [PMC free article] [PubMed] [Google Scholar]


