Abstract
Cyclic nucleotide phosphodiesterase 3B (PDE3B) has been suggested to be critical for mediating insulin/IGF-1 inhibition of cAMP signaling in adipocytes, liver, and pancreatic β cells. In Pde3b-KO adipocytes we found decreased adipocyte size, unchanged insulin-stimulated phosphorylation of protein kinase B and activation of glucose uptake, enhanced catecholamine-stimulated lipolysis and insulin-stimulated lipogenesis, and blocked insulin inhibition of catecholamine-stimulated lipolysis. Glucose, alone or in combination with glucagon-like peptide–1, increased insulin secretion more in isolated pancreatic KO islets, although islet size and morphology and immunoreactive insulin and glucagon levels were unchanged. The β3-adrenergic agonist CL 316,243 (CL) increased lipolysis and serum insulin more in KO mice, but blood glucose reduction was less in CL-treated KO mice. Insulin resistance was observed in KO mice, with liver an important site of alterations in insulin-sensitive glucose production. In KO mice, liver triglyceride and cAMP contents were increased, and the liver content and phosphorylation states of several insulin signaling, gluconeogenic, and inflammation- and stress-related components were altered. Thus, PDE3B may be important in regulating certain cAMP signaling pathways, including lipolysis, insulin-induced antilipolysis, and cAMP-mediated insulin secretion. Altered expression and/or regulation of PDE3B may contribute to metabolic dysregulation, including systemic insulin resistance.
Introduction
cAMP plays critical roles in regulating energy metabolism. For example, the rate of triglyceride (TG) hydrolysis (lipolysis) is dependent on intracellular cAMP, and cAMP signaling pathways also modulate gluconeogenesis, glycogenolysis, insulin secretion, and thermogenesis (1). By catalyzing hydrolysis of cAMP and cGMP, cyclic nucleotide phosphodiesterases (PDEs) regulate their intracellular concentrations and, consequently, their physiological effects. PDEs belong to a complex and diverse superfamily of at least 11 structurally related, highly regulated, and functionally distinct gene families (PDE1–PDE11) (2, 3).
Two PDE3 subfamilies, PDE3A and PDE3B, are products of separate, but homologous, genes (3, 4) and exhibit different patterns of expression. PDE3A is relatively more abundant in the cardiovascular system, and PDE3B in cells of importance for energy metabolism including hepatocytes, brown and white adipocytes, and pancreatic β cells (4, 5). PDE3B is also found in the cardiovascular system (6). One characteristic of PDE3B isoforms is their activation in response to insulin, IGF-1, and leptin via PI3K-dependent signals as well as to agents that increase cAMP (7). In adipocytes, activation of PDE3B is thought to be a major mechanism whereby insulin increases degradation of cAMP and antagonizes catecholamine-induced lipolysis (7). PDE3B is also apparently involved in regulation of insulin-induced glucose uptake, glucose transporter–4 (GLUT-4) translocation, and lipogenesis (8, 9). IGF-1– (5), leptin- (10, 11), and insulin-mediated (11) activation of PDE3B may be important in inhibition of cAMP-induced glycogenolysis in hepatocytes (11) and of cAMP-stimulated secretion of insulin from pancreatic β cells (5, 10). Furthermore, overexpression of PDE3B in pancreatic β cells, both in vivo and in vitro, antagonized glucose- and glucagon-like peptide–1–mediated (GLP-1–mediated) increases in cAMP accumulation and insulin secretion (12, 13).
Although mechanisms for acute activation of PDE3B and its potential physiological role(s) have been extensively studied in cultured cells, its role(s) in human and animal physiology or in the development of dysregulated metabolic states, including systemic insulin resistance, is not well understood. In some rodent diabetes models, PDE3B expression is downregulated in adipose tissue, and the ability of insulin to activate PDE3B and antagonize lipolysis is reduced (14–17). In one study, treatment of obese diabetic KKAy mice with pioglitazone, an insulin-sensitizing drug, increased PDE3B expression and its responsiveness to insulin and reduced serum FFA levels (14).
To evaluate the physiological role(s) of PDE3B, we induced a targeted disruption in the murine Pde3b gene by homologous recombination. Pde3b-KO mice exhibited multiple alterations in regulation of lipolysis, lipogenesis, and insulin secretion as well as signs of peripheral insulin resistance.
Results
Targeted disruption of Pde3b.
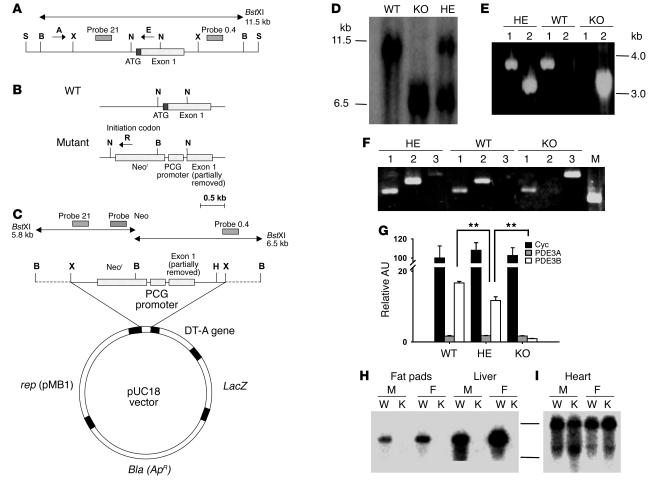
Pde3b–/– mice were generated as described in Methods (Figure 1, A–C). Mice used for experiments reported here were progeny of at least 6–7 backcrosses of heterozygous (HE) F1 mice with JAX 129/SvJ (pTyrc-ch/pTyrc substrain) mice. Genotyping of the F2 generation mice by Southern blot analyses demonstrated the predicted 6.5-kb restriction fragment in KO mice, and both 11.5-kb (WT) and 6.5-kb (KO) fragments in HE mice (Figure 1D). PCR carried out with A and R primers or A and E primers (Figure 1, A and B) amplified the expected approximately 3.0-kb band with genomic DNA from the KO and HE mice or the approximately 3.3-kb band from WT and HE mice, respectively (Figure 1E).
Figure 1. Targeted disruption of the murine Pde3b gene.
(A) Structure of the approximately 13-kb SalIPDE3B WT genomic fragment containing 5′-untranslated region and exon 1. (B) WT and disrupted KO gene fragments near exon 1. (C) Pde3b targeting vector. S, SalI; X, XbaI; B, BstXI; N, NotI; H, HindIII. (D) Southern blot of WT, HE, and KO genomic DNA, digested with BstXI and hybridized to 32P-labeled probe 0.4 (see A and C). (E) PCR amplification of WT, HE, and KO genomic DNA using the specific primers A, E, and R indicated in A and B (A and E for lane 1; A and R for lane 2). (F) RT-PCR amplification of mRNA from WT, HE, and KO livers with primers described in Methods targeted for PDE3A (lane 1), PDE3B (lane 2), and Neor (lane 3). M, molecular weight marker. (G) Quantitation of cyclophilin A (Cyc), PDE3A, and PDE3B mRNAs in WT, HE, and KO mouse livers by real-time RT-PCR. Data were normalized to the quantity of WT cyclophilin A mRNA, taken as 100 AU. Values represent mean ± SEM (n = 4 per genotype in triplicate assays). Data were similar in 2 other groups of WT and KO mice and 1 group of HE mice. **P < 0.01. (H and I) Northern blot of WT and KO mRNAs, using probe B for mPDE3B (fat pads and liver; H) or probe A for mPDE3A (heart; I) as described in Methods. M, male; F, female; W, WT mRNA; K, KO mRNA.
As shown in Figure 1F, using appropriately designed primers, PDE3A transcripts were amplified in mRNA from WT, HE, and KO mice; PDE3B transcripts were amplified in mRNA from WT and HE, but not KO mice; and neomycin resistance gene–targeted (Neor-targeted) mRNA was amplified in mRNA from HE and KO mice. As shown in Figure 1G, real-time quantitative 1-step RT-PCR using SYBR Green as the reporter fluorophore and primers from exons 2 and 3 indicated that PDE3B mRNA amplification in KO and HE livers was approximately 5% and 65%, respectively, that of WT liver. In Northern blots, PDE3B probe B (from the portion of the Pde3b gene replaced by Neor) detected approximately 5.5-kb transcripts in mRNA from fat pads and liver of WT, but not KO, mice (Figure 1H). In contrast, 2 heart mRNA transcripts (approximately 7.5 and 4.5 kb) were detected using PDE3A probe A with mRNA from both the WT and KO mice (Figure 1I). Northern blots with Clontech MTN filters revealed PDE3 mRNAs of sizes similar to those shown in Figure 1, H and I (data not shown). As also shown in Figure 1G, the amount of PDE3A mRNA was much lower than that of PDE3B mRNA in WT livers and was not increased in HE or KO livers. Thus, results in Figure 1, G and I, indicate no evidence of compensatory changes in expression of PDE3A in KO mice (at least in liver and heart).
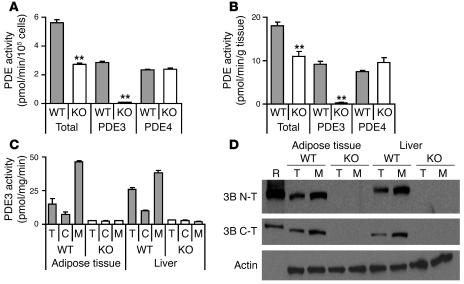
PDE3 activity in homogenates of isolated adipocytes was assessed by measurement of cAMP hydrolysis in the absence or presence of cilostamide, a specific PDE3 inhibitor (ref. 2; selective PDE3A and PDE3B inhibitors are not available). As shown in Figure 2A, PDE3 activity was virtually absent in KO adipocytes, indicating that PDE3B is the PDE3 isoform expressed in adipocytes. In isolated WT adipocytes, PDE3B accounted for almost one-half of the total PDE activity; and PDE4, somewhat less (Figure 2, A and B). PDE4 activity is that activity inhibited by 10 μM rolipram, a selective PDE4 inhibitor (2). PDE4 activities were similar in WT and KO adipocytes, indicating that there was no compensatory increase in PDE4 in KO adipocytes. PDE3B accounted for most of the PDE3 activity in adipose tissue and liver (Figure 2C). Immunoreactive approximately 135-kd PDE3B was not detected in homogenates (T) or membrane fractions (M) of adipose tissue and livers from KO mice (Figure 2D). As shown in Supplemental Figure 1 (supplemental material available online with this article; doi:10.1172/JCI24867DS1), residual PDE3 activity in livers from PDE3B KO mice could be accounted for by PDE3A; lower molecular weight material not associated with PDE3 activity was detected with anti-PDE3B (C-T) in membrane fractions from WT and KO mice.
Figure 2. PDE activity and Western blots.
(A and B) PDE activities in epididymal adipocytes prepared from 4-month-old WT and KO mice are presented as total, PDE3, and PDE4 activities. Values represent mean ± SEM of duplicate assays (n = 3 mice per group), which were repeated with similar results. **P < 0.01. (C and D) PDE3 activities (C) and protein expression (D) in adipose tissue and liver. Total cell lysate (T) as well as cytosol (C) and membrane fractions (M) were prepared from gonadal adipose tissue and livers from 4-month-old WT and KO mice (n = 10–11 mice per group). (C) PDE3 activities (pmol cAMP hydrolyzed/min/mg protein) are expressed as mean ± SEM (duplicate assays). (D) Western blots, each lane 30 μg protein, except membrane fractions (75 μg) for β-actin detection. Results are representative of 3 experiments. R, PDE3B recombinant protein. Immunoblotting was performed using a monoclonal anti–β-actin antibody and affinity-purified rabbit antibodies raised against N-terminal (3B N-T; RKDERERDTPAMRSPPP, aa 2–18) or C-terminal (3B C-T; NASLPQADEIQVIEEADEEE, aa 1076–1095) sequences of PDE3B.
Characteristics of Pde3b-KO mice.
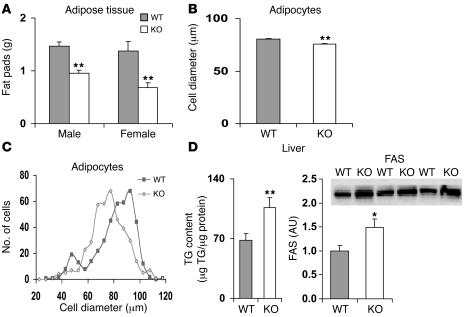
Newborn KO pups exhibited no obvious physical defects. Their growth and development, general behavior, and activity levels were similar to those of WT mice, and KO mice of both sexes were fertile. Most experiments were carried out with groups of age-matched WT and KO mice, whose dates of birth varied by 0–5 days; the mice were usually older than 3–4 months. Pde3b-KO mice were slightly heavier than their WT counterparts (Supplemental Table 1) and exhibited variations in coat color from white to yellowish brown. When mice were fed normal chow (Figure 3A) or a 60%-fat diet (data not shown), the weight of gonadal adipose tissue was lower in KO than WT mice (Figure 3A) and also represented a lesser percentage of body weight (data not shown). The mean cell diameter of KO adipocytes was significantly smaller than that of WT adipocytes, and the cell diameter distribution was shifted to a lower range (Figure 3, B and C). Weights of livers (Supplemental Table 1) as well as hearts and pancreata (data not shown) did not differ between WT and KO mice. TG content, however, was significantly increased in livers in KO mice and was associated with increased expression of fatty acid synthase (FAS) (Figure 3D).
Figure 3. Gonadal fat weight, adipocyte diameters, and liver TG and FAS content in WT and Pde3b-KO mice.
(A) WT and KO mice, housed 2 per cage and with free access to food and water, were fed normal chow. Caloric contents were 10%, 20%, and 70% fat, protein, and carbohydrate, respectively. For weight measurements, gonadal fat pads were collected from 6-month-old WT and KO mice (n = 6–8 mice per group). Data (mean ± SEM) were similar in 2 other experiments. (B and C) Diameter of epididymal adipocytes from age-matched 5-month-old WT and KO mice. (B) Cell diameter. Values are mean ± SEM (n = 357 WT and 447 KO cells). (C) Diameter distribution. The numbers of adipocytes with 5-μm intervals in their diameters were counted and plotted. Results are representative of 4 experiments. (D) Liver TG and FAS content. Liver TG content of 3- to 3.5-month-old male WT and KO mice was measured as described in Methods. Values are mean ± SEM (n = 18 per group). FAS content was determined by Western blot of liver homogenates (45 μg protein/lane) from WT and KO mice. Immunodetection was performed with anti-FAS antibody, and FAS bands were quantified. Values are mean ± SEM (n = 3 per group). *P < 0.05; **P < 0.01.
Insulin- and catecholamine-mediated regulation of lipolysis is altered in Pde3b-KO mice.
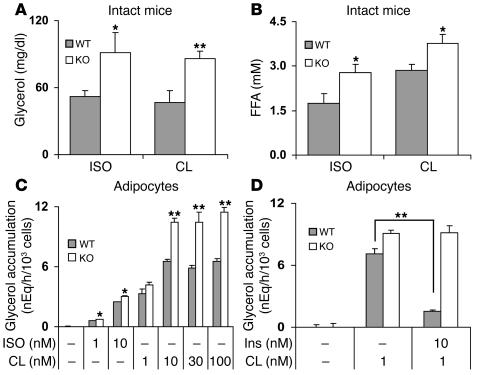
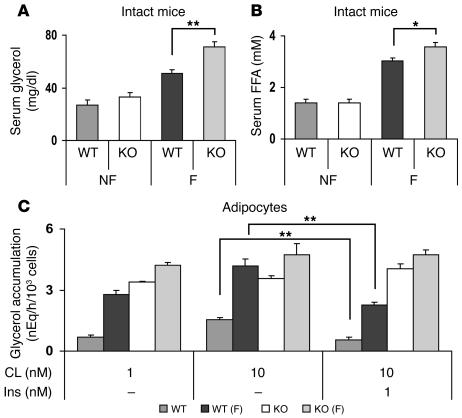
To assess the impact of the absence of adipocyte PDE3B on catecholamine-induced lipolysis in vivo, CL 316,243 (CL; a specific β3 receptor agonist — β3 receptors are the predominant subtype in rodent adipocytes; ref. 18) and isoproterenol (ISO; a general β receptor agonist) were administered by i.p. injection, and their effects on serum glycerol and FFA levels were measured. Basal levels of glycerol and FFA were similar in fed WT and KO mice. As shown in Figure 4, CL and ISO increased lipolysis, i.e., serum glycerol (Figure 4A) and FFA (Figure 4B) levels, to a greater extent in KO than in WT mice. In isolated adipocytes (Figure 4C), CL, which at low concentrations was more effective than ISO, also stimulated lipolysis to a greater extent in adipocytes isolated from KO mice than from WT mice. Consistent with current ideas that activation of PDE3B and reduction of cAMP are critical in the antilipolytic action of insulin (7), insulin inhibited catecholamine-activated lipolysis in WT, but not KO, adipocytes (Figure 4D). After fasting for 20 hours, serum glycerol (Figure 5A) and FFA (Figure 5B) levels were increased in KO mice. As shown in Figure 5C, CL stimulated lipolysis to a greater extent in adipocytes from fed KO mice than fed WT mice. CL-stimulated lipolysis was further enhanced in adipocytes from fasted WT, but not KO, mice, perhaps due to the fact that lipolytic pathways were activated to a greater extent in fasted KO than WT mice (Figure 5, A and B). Insulin inhibited CL-stimulated lipolysis in adipocytes from fed and fasted WT, but not KO, mice (Figure 5C).
Figure 4. Effects of ISO, CL, and insulin on lipolysis in intact mice and adipocytes.
(A and B) ISO or CL (1.0 mg/kg each) in PBS, or PBS alone, was injected i.p. (10 ml/kg) into 6-month-old WT and KO mice. After 20 minutes, serum glycerol (A) and FFA (B) levels were quantified. Values are mean ± SEM (n = 4 per group). Differences between serum glycerol or FFA concentrations after PBS alone (basal) and after drug administration are shown. Basal values in WT and KO mice were 20.5 ± 2.7 and 23.7 ± 1.2 mg/dl glycerol, respectively, and 1.49 ± 0.21 and 1.13 ± 0.25 mM FFA, respectively. Data were similar in 3 other experiments. (C and D) Adipocytes (0.4 ml, 5% [vol/vol]) prepared from epididymal fad pads of 6-month-old WT and KO mice were incubated for 60 minutes at 37°C in Krebs-Ringer–HEPES buffer alone or with the indicated concentrations of ISO, CL, or insulin (Ins). Lipolysis was measured as glycerol accumulation in the medium. Data are mean ± SEM of 3 incubations (duplicate assays). (C) Basal glycerol values were 0.13 ± 0.02 and 0.12 ± 0.01 nEq/h/103 cells for WT and KO, respectively. Data were similar in 3 other experiments. (D) Basal glycerol values were 0.24 ± 0.13 and 0.13 ± 0.08 nEq/h/103 cells for WT and KO, respectively. Data were similar in 2 other experiments. *P < 0.05; **P < 0.01.
Figure 5. Effects of fasting on lipolysis in intact mice and adipocytes.
(A and B) WT and KO mice (4 months old) were fed ad libitum (NF) or fasted for 20 hours (F). Serum glycerol (A) and FFA (B) levels, determined as described in Methods, are presented as mean ± SEM (n = 6–7 mice per group). Results were similar to those from another group of fed and fasted WT and KO mice. (C) WT and KO mice (5 months old) were fasted for 20 hours before preparation of adipocytes, which were incubated for 60 minutes at 37°C with the indicated concentrations of CL and insulin. Increases from basal glycerol values are shown. Basal values were 0.16 ± 0.01 and 0.12 ± 0.00 nEq/h/103 cells for WT fed and fasted adipocytes, respectively, and 0.09 ± 0.01 and 0.09 ± 0.01 nEq/h/103 cells for KO fed and fasted adipocytes, respectively. Data are mean ± SEM of 3 incubations (duplicate assays). *P < 0.05; **P < 0.01.
Insulin secretion is increased in Pde3b-KO mice.
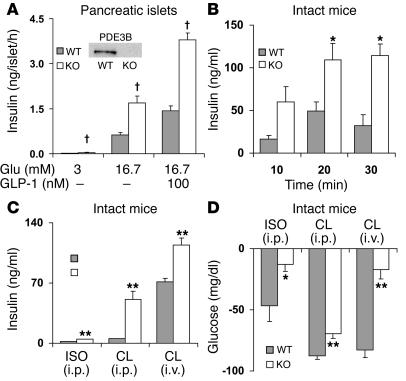
To more directly assess the effects of the absence of PDE3B in pancreatic β cells, we examined glucose-stimulated insulin secretion by pancreatic islets isolated from WT and KO mice. As shown in Figure 6A, and in agreement with previous results by us and others (5, 12, 13, 19, 20), in the presence of 16.7 mM glucose, without or with GLP-1, glucose-stimulated insulin secretion was increased to a greater extent in KO than in WT islets, indicative of increased content of, and/or increased responsiveness to, cAMP in Pde3b-deficient islets. Immunohistochemical analyses of pancreata from WT and KO mice showed no significant differences in islet size and expression/localization of insulin, glucagon, the β cell–specific transcription factor PDX-1, glucose transporter–2 (GLUT-2), and β cell glucokinase (data not shown).
Figure 6. Differences in insulin secretion from pancreatic islets, serum insulin concentrations, and blood glucose disposal in WT and Pde3b-KO mice.
(A) Insulin accumulation during incubation of isolated pancreatic islets for 1 hour with 3 or 16.7 mM glucose and without or with 100 nM GLP-1 as indicated. Data are mean ± SEM (n = 4). Inset: Immunoreactive PDE3B was detected by Western blots of WT, not KO, homogenates. (B) CL (1.0 mg/kg) in PBS or PBS alone was injected i.p. (10 ml/kg) into 6-month-old WT and KO mice. At the indicated times, differences from time 0 (basal) in serum insulin levels were quantified. Basal insulin levels in WT and KO mice were 1.4 ± 0.2 and 2.6 ± 0.1 ng/ml, respectively. Data (mean ± SEM; n = 4 mice per group) are representative of 3 experiments. (C and D) ISO or CL (1.0 mg/kg) in PBS or PBS alone were injected i.p. or i.v. (10 ml/kg) into 3- (i.p) or 4-month-old (i.v.) WT and KO mice. After 20 minutes, tail blood was collected, and changes from basal serum insulin (C) and blood glucose (D) levels were measured. Basal values were similar in PBS-treated WT and KO mice. Data (mean ± SEM; n = 4–5 mice per group) are representative of 3 experiments. *P < 0.05; **P < 0.01; †P < 0.001.
In intact mice, administration of β3 receptor agonists are known to induce insulin secretion (21, 22). Administration of i.p. CL increased serum insulin levels to a greater extent in KO than in WT mice in a time- (Figure 6B) and concentration-dependent (data not shown) manner. Maximal increases were observed within 20 minutes after injection. Administration of ISO also increased serum insulin levels to a greater extent in KO mice (Figure 6C), but ISO was less effective than CL. Because stimulatory effects of β3 receptor agonists on insulin secretion are thought to be indirect and related to the presence of white adipose tissue depots (21, 22), the effects of CL are presumably related to production and/or release of an adipocytokine(s) or incretin(s). Taken together with the results shown in Figure 6A, these observations suggest that in Pde3b-KO mice, there is increased secretion of, and/or enhanced islet-responsiveness to, these agents.
Pde3b-KO mice are insulin resistant.
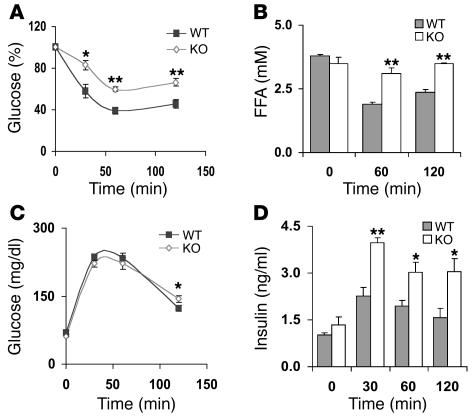
As shown in Supplemental Table 1, blood glucose and serum concentrations of glycerol, TGs, insulin, and FFAs were not significantly different in fed WT and KO mice. Although serum glycerol and FFA levels were increased in fasted KO mice (Figure 5), blood glucose and serum insulin levels were not changed (data not shown). Results of a number of experiments, however, indicated that KO mice were insulin resistant. Thus, despite the very high serum insulin concentrations in KO mice within 20 minutes after i.p. administration of CL, reduction in, or disposal of, blood glucose was not greater in CL-treated KO mice (Figure 6, C and D). As also shown in Figure 6C, within 10–20 minutes after i.v. injection of CL, serum insulin levels were also increased to a significantly greater extent in KO than in WT mice, although the differences between WT and KO mice were smaller following i.v. injection than i.p. injection. Despite the approximately 40-fold increase in serum insulin levels in the KO mice following i.v. administration of CL, there was much less removal or disposal of glucose in CL-treated KO mice than in CL-treated WT mice (Figure 6D). In addition, during insulin tolerance tests (ITTs) following i.p. injection of insulin to male mice, insulin was much less effective in reducing blood glucose and serum FFA levels in male KO than WT mice (Figure 7, A and B). Although effects of insulin on glucose disposal were similar in female WT and KO mice, insulin was less effective in reducing FFA levels in KO females than in WT females (data not shown). These results are consistent with the lack of the antilipolytic action of insulin in isolated adipocytes from KO mice (Figures 4 and 5). Furthermore, although clearance of blood glucose was similar in WT and KO mice during glucose tolerance tests (GTTs) following administration of i.p. glucose loads (Figure 7C), serum insulin levels were higher in older (9-month-old) KO males (Figure 7D) and females (data not shown); the increase in insulin secretion was not observed during GTTs in younger mice. The increase in serum insulin levels during GTTs observed in older KO mice is indicative of an altered exocytotic or secretory response to a glucose load of pancreatic β cells that lack PDE3B, and is consistent with the increased responsiveness of isolated KO islets to glucose and GLP-1 (Figure 6A).
Figure 7. ITTs and GTTs.
(A and B) Male 5-month-old WT and KO mice were fasted overnight for 20 hours prior to i.p. injection (10 ml/kg) of insulin (0.5 U/kg) in PBS or PBS alone, and blood glucose (A) and serum FFA (B) levels were measured at the indicated times. Glucose concentrations (A) are reported relative to those at time 0. Basal glucose values in WT and KO mice were 70 ± 3 and 66 ± 3 mg/dl, respectively. Data (mean ± SEM; n = 6 mice per group) were similar in 8 (A) and 2 (B) other experiments. (C and D) Male 9-month-old WT and KO mice were fasted overnight, with free access to water. At the indicated times after i.p. injections (10 ml/kg) of PBS alone or of glucose (2 g/kg) in PBS, blood glucose (C) and serum insulin (D) levels were quantified. Data (mean ± SEM; n = 6 mice per group) were similar in 2 other experiments. *P < 0.05; **P < 0.01.
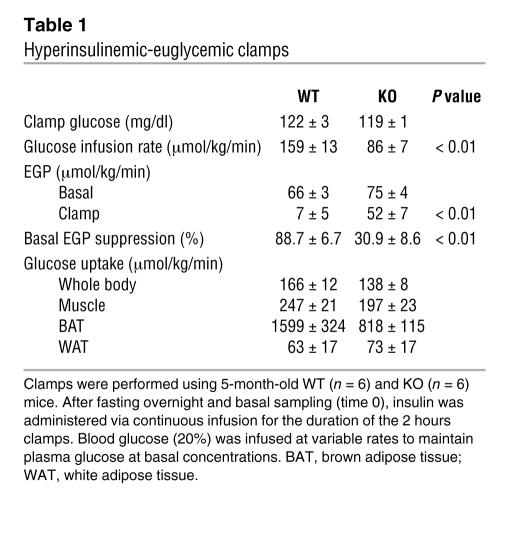
To gain insight into the possible tissue loci of the insulin resistance observed in the different settings, i.e., i.p. ITTs, i.p. GTTs, and i.p. administration of CL, hyperinsulinemic-euglycemic clamps were performed. As shown in Table 1, after 16 hours of fasting, basal glucose, insulin, and endogenous glucose production (EGP) were not significantly different in WT and KO mice, and clamp blood glucose levels also were not significantly different between WT and KO mice (122 ± 3 and 119 ± 1 mg/dl). Under the hyperinsulinemic clamp conditions, KO mice exhibited slightly lower whole-body glucose uptake and reduced uptake in brown adipose tissue than in WT mice (P < 0.09), but these differences were not statistically significant. The steady-state glucose infusion rate required to maintain euglycemia was significantly higher in WT (159 ± 13 μmol/min/kg) than in KO mice (86 ± 7 μmol/min/kg; P < 0.01), suggesting impaired insulin responsiveness in KO mice. Insulin-induced suppression of EGP was markedly lower in KO mice (30.9% ± 8.6% in KO versus 88.7% ± 6.7% in WT mice; P < 0.01), suggesting that insulin does not effectively inhibit hepatic glucose output in KO mice. Thus, in regard to dysregulation of glucose homeostasis in KO mice, the liver appears to play a critical role.
Table 1 .
Hyperinsulinemic-euglycemic clamps
Insulin and cAMP signaling, PPARγ coactivator–1α/phosphoenolpyruvate carboxykinase expression, inflammation markers, and lipid metabolism are altered in livers and adipocytes from KO mice.
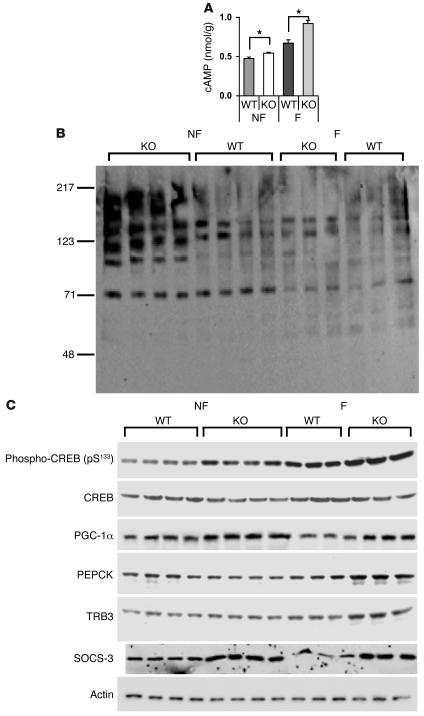
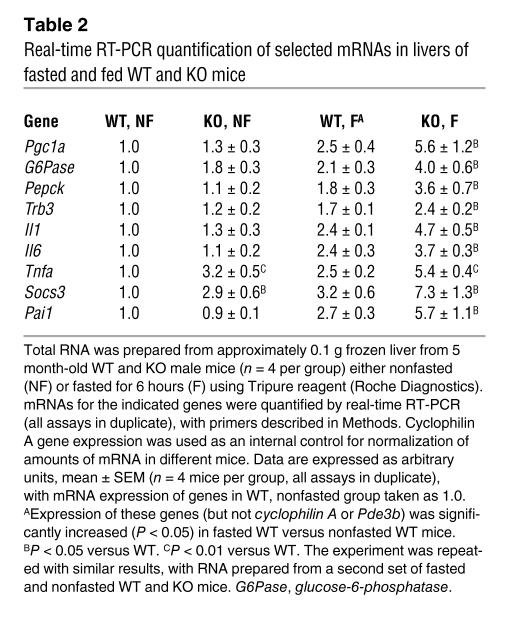
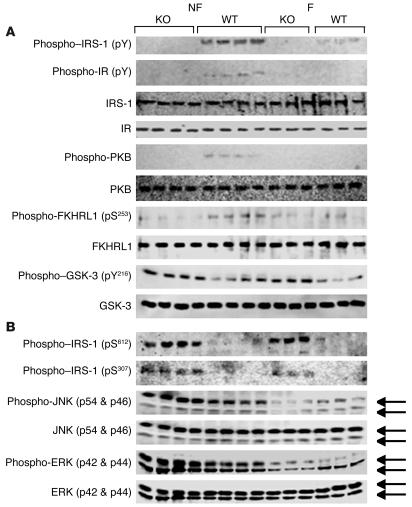
Although it is not possible to precisely determine the role of the liver in the development of insulin resistance in the KO mice, a number of changes that may contribute were identified. As shown in Figure 3D, TG content and FAS expression were significantly increased in livers from Pde3b-KO mice. As shown in Figure 8A, cAMP content was increased in liver extracts from KO mice, consistent with increased phosphorylation of PKA substrates (Figure 8B) and cAMP regulatory element–binding protein (CREB) (Figure 8C). Furthermore, the content of PPARγ coactivator–1α (PGC-1α), a transcriptional factor regulated by CREB, and phosphoenolpyruvate carboxykinase (PEPCK), a key gluconeogenic enzyme, was increased in KO livers, the latter especially in fasted animals (Figure 8C). Expression of PGC-1α, PEPCK, and glucose-6-phosphatase mRNAs were also significantly increased in fasted KO compared with fasted WT livers (Table 2), consistent with enhanced glucose production in KO livers. In addition, expression of tribbles 3 (TRB3) protein (Figure 8C) and mRNA (Table 2) was increased in fasted KO livers. Gene expression of TRB3, an inhibitor of PKB activation, is regulated by PGC-1α and PPARα, and induction of TRB3 is thought to be important in development of hepatic insulin resistance by PGC-1α (23). As shown in Figure 9A, in extracts from KO livers, tyrosine phosphorylation of insulin receptor substrate–1 (IRS-1) was decreased without any change in total IRS-1. Serine phosphorylation of PKB and forkhead (Drosophila) homolog (rhabdomyosarcoma) like 1 (FKHRL1) was decreased, and tyrosine phosphorylation of glycogen synthase kinase-3 (GSK-3) was increased in KO liver extracts, consistent with decreased signaling via PKB, a critical kinase involved in insulin-mediated effects on glucose and lipid metabolism (24). With respect to stress/inflammation signals (Figure 9B), in livers from KO mice, phosphorylated JNK (but not total JNK), which could be important in increased serine phosphorylation of IRS-1, was increased. As analyzed by real-time RT-PCR, levels of SOCS-3 mRNA and mRNAs of proinflammatory cytokines IL-1, IL-6, TNF-α, and plasminogen activator inhibitor–1 (PAI-1) were increased in fasted KO liver (Table 2). Many of these changes could contribute to development of insulin resistance in KO mice (25).
Figure 8. Hepatic cAMP content and gluconeogenic gene expression in nonfasted and 6-hour-fasted WT and Pde3b-KO mice.
(A) Hepatic cAMP content. cAMP was measured in liver extracts from 5-month-old WT and Pde3b-KO mice either fed or fasted for 6 hours as described in Methods. Values on the y axis represent nanomoles of cAMP per gram of liver. Data (mean ± SEM; n = 4 per group), which represent duplicate assays, were similar in a second group of fasted and nonfasted WT and KO mice. (B and C) Western blotting of liver lysates (50 μg protein/lane) was performed as described in Methods. n = 4 fed, 3 fasted mice per group. Data from a second, identical group of fed (n = 4) and 6-hour fasted (n = 3) WT and KO mice were similar. (B) Immunodetection with anti-PKA substrates antibody, which detects substrate proteins phosphorylated by cAMP-dependent protein kinase. (C) Immunodetection with anti–phospho-CREB (pS133); anti-CREB; anti–PGC-1α; anti-PEPCK; anti-TRB3; anti–SOCS-3; and anti-actin antibodies.
Table 2 .
Real-time RT-PCR quantification of selected mRNAs in livers of fasted and fed WT and KO mice
Figure 9. Alterations in insulin-signaling components in livers from Pde3b-KO mice.
Western blots of liver lysates (50 μg protein/lane) were performed as described in Methods. n = 4 fed, 3 fasted mice per group. Data from an identical group of nonfasted (n = 4) and 6-hour-fasted (n = 3) WT and KO mice were similar. (A) Immunodetection with anti-phosphotyrosine (pY), anti–IRS-1, anti–insulin receptor (IR), anti–phospho-PKB, anti-PKB, anti–phospho-FKHRL1 (pS253), anti-FKHRL1, anti–phospho–GSK-3 (pY216), and anti–GSK-3 antibodies. (B) Immunodetection with anti–phospho–IRS-1 (pS612), anti–phospho–IRS-1 (pS307), anti–phospho-JNK, anti-JNK, anti–phospho-ERK, and anti-ERK antibodies.
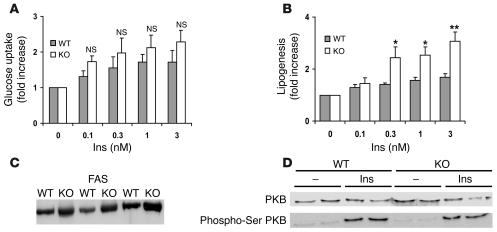
Consistent with hyperinsulinemic-euglycemic clamps in intact mice, no significant differences in insulin-induced glucose uptake were detected in isolated adipocytes from WT and KO mice (Figure 10A). Although basal lipogenesis was reduced in adipocytes from KO mice, insulin-stimulated lipogenesis was significantly enhanced in KO adipocytes (Figure 10B), which was explained in part by an increase in the expression of FAS (Figure 10C). As shown in Figure 10D, insulin-induced phosphorylation and activation of PKB were similar in WT and KO adipocytes.
Figure 10. Effects of insulin on glucose uptake, lipogenesis, and activation of PKB in adipocytes from 3- to 3.
-month-old WT and Pde3b-KO mice. (A and B) Adipocytes (0.2 ml 15% cells [vol/vol] in A; 1 ml 2.0% cells [vol/vol] in B) were incubated with the indicated concentrations of insulin for 10 minutes (A; n = 3) and 3 hours (B; n = 5). Uptake of 2-[1-3H]-deoxyglucose (A) and incorporation of D-[3H]-glucose into lipids (B) were measured as described in Methods and expressed as fold increase relative to nonstimulated cells. In KO adipocytes, basal lipogenesis was 56% ± 0.08% (mean ± SEM; P = 0.0001) that of WT adipocytes. Data (mean ± SEM) are from 5 independent experiments, each of which used adipocytes pooled from 2–3 mice. *P < 0.05; **P < 0.01. (C) Western blot analysis of FAS from WT and KO mice (20 μg protein/lane; n = 3) using anti-FAS antibody. (D) Adipocytes (each batch consisted of adipocytes from 2 of a total 6 WT and 6 KO mice) were incubated for 10 minutes with or without 1 nM insulin. Adipocyte fractions, prepared as described in Methods, were subjected to Western blotting with antibody recognizing PKB phosphorylated on serine 473 and, after stripping, with anti-PKB antibody. One Western blot representative of 3 is shown. PKB/phosphorylated PKB bands from 6 WT and 6 KO mice were quantified.
Serum adiponectin, but not leptin, is increased in KO mice.
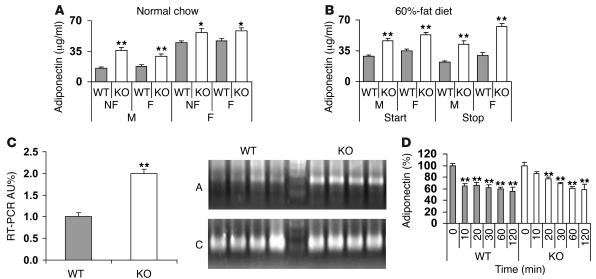
In addition to its traditional role as a storage depot for fat, adipose tissue is an important secretory organ of multiple factors, including so-called adipokines, which affect inflammation, appetite, insulin sensitivity, metabolism, and energy expenditure (26–28). One such adipokine, adiponectin, enhances insulin sensitivity in peripheral tissues, especially liver (27, 29, 30). In mice on normal chow (Figure 11A) or before or after (Figure 11B) 14 weeks on a 60%-fat diet, serum adiponectin concentrations were higher in KO mice (male and female) than in WT mice and did not change significantly after an overnight fast (Figure 11A). Adiponectin mRNA expression was increased in adipose tissue from Pde3b-KO mice fed normal chow (Figure 11C). There were no significant differences in serum leptin between WT and KO mice fed normal chow (Supplemental Table 1). Administration of CL decreased serum leptin (data not shown) and adiponectin (Figure 11D) in both WT and KO mice, indicating appropriate responses to acute increases in cAMP.
Figure 11. Adiponectin expression.
(A and B) Serum adiponectin concentrations were quantified in WT and KO mice, either fed or after fasting for 20 hours, fed normal chow (A; 6 months of age) or at the start (at 2 months of age) and end (after 14 weeks) of a 60%-fat diet (B). Data (mean ± SEM; n = 6–9 mice per group) were similar in 2 other experiments for A. (C) Adiponectin mRNA from epidydimal fat pads was amplified via real-time quantitative RT-PCR of total RNA as described in Supplemental Methods. Data (mean ± SEM; n = 4 mice per group) were similar in 2 other experiments. Inset: Agarose gel electrophoresis of adiponectin real-time RT-PCR products. A, adiponectin; C, cyclophilin A. Data from 1 other experiment were similar. (D) At the indicated times after i.p. injection (10 ml/kg) of CL (1.0 mg/kg) in PBS or PBS alone administered to 4- to 5-month old WT and KO mice, serum adiponectin levels were measured. Data (mean ± SEM) represent the percent change relative to basal values at time 0 (n = 4–9 mice per group). Basal adiponectin values were 22.2 ± 0.7 and 41.0 ± 2.0 μg/ml in WT and KO, respectively. Note: Values at every time point following CL injection were significantly lower (P < 0.01) except at 10 minutes in KO mice in the case of adiponectin. Data from 1 other experiment were similar. *P < 0.05; **P < 0.01.
Discussion
The phenotypic characteristics of Pde3b-KO mice indicate that PDE3B plays an unique role in adipocytes, liver, and pancreatic β cells and is not apparently functionally compensated for by other PDE gene families or by the other PDE3 family member, PDE3A.
Results of hyperinsulinemic-euglycemic clamp studies suggested that with respect to dysregulation of glucose metabolism, the liver is a critical site in the development of systemic insulin resistance in KO mice, where a number of defects were detected. The expression level and phosphorylation states of a number of insulin- and cAMP- signal transduction components were altered in KO livers (Figures 8 and 9), which were consistent with development of insulin resistance and/or increased glucose production. In addition, expression of TRB3, an inhibitor of PKB activation thought to be important in induction of hepatic insulin resistance by PGC-1α (23), was increased in fasted KO livers, as was expression of PEPCK and glucose-6-phosphatase, key gluconeogenic enzymes. With respect to stress/inflammation signals, in livers from KO mice, phosphorylated JNK (which may be important in increased serine/decreased tyrosine phosphorylation of IRS-1), but not total JNK, was increased. As assessed by real-time RT-PCR, increased levels of mRNAs of SOCS-3 and several proinflammatory cytokines, IL-1, IL-6, TNF-α, and PAI-1, were detected in fasted KO livers. Liver TG and FAS contents were significantly increased in KO livers; this could be important in development of systemic insulin resistance. Ample evidence in humans and rodents points to an inverse relationship between hepatic TG content and insulin’s effectiveness in regulating hepatic glucose metabolism. Excessive accumulation of TGs within the liver is recognized as part of the metabolic syndrome (31–33). In addition, the lack of PDE3B in hepatocytes could influence glycogen metabolism, since activation of PDE3B by insulin may be involved in its antiglycogenolytic effects (11).
Increased levels of FFA have been implicated in β cell dysfunction and increased peripheral insulin resistance (34). Consistent with an important role for PDE3B in the regulation of cAMP pools that modulate lipolysis (7), i.p. injection of ISO or CL increased lipolysis (serum glycerol and FFA levels) to a greater extent in KO mice than in WT mice. CL also increased lipolysis to a greater extent in isolated KO adipocytes, and insulin inhibited lipolysis in WT, but not KO, adipocytes. Thus, an enhanced lipolytic “drive” could contribute to the development of insulin resistance. Consistent with our findings in KO mice, administration of milrinone, a PDE3 inhibitor, to intact rats increased lipolysis and insulin secretion and blocked insulin-induced suppression of EGP (35). Thus, absence or inhibition of PDE3B (e.g., via milrinone; ref. 35, 36) which may lead to altered insulin signaling and dysregulation of hepatic glucose output, could be associated with the development of insulin resistance (Table 1).
Although serum leptin levels were not consistently altered, adiponectin levels were significantly increased in KO mice. In addition to its ability to increase insulin sensitivity in peripheral tissues, especially liver (27, 29), adiponectin also exerts antiinflammatory actions and cardioprotective effects (26, 30) mediated by cAMP-dependent and -independent signaling pathways (30). It is conceivable that in KO mice, changes in adiponectin as well as the increase in insulin secretion in response to glucose, GLP-1, and putative catecholamine-induced adipokines/incretins (Figure 6) and the presence of smaller adipocytes and gonadal fat depots (Figure 3) represent mechanisms that maintain or improve sensitivity to insulin and/or prevent more marked insulin resistance and glucose intolerance in KO mice. Our current unpublished studies suggest that other compensatory mechanisms, especially more efficient or enhanced energy dissipation in Pde3b-KO mice and reduced expression of proinflammatory markers in KO epididymal adipose tissue, may also be partly responsible for these findings.
The results of our present studies with KO mice, which complement those of others (5, 10, 19, 20) as well as our earlier studies in transgenic mice (13) and cultured insulin-secreting cells and isolated pancreatic islets (12), have validated hypotheses concerning 2 important PDE3B functions, i.e., modulation of insulin’s antilipolytic action and glucose- and cAMP-stimulated insulin secretion (7). In addition, our results suggest that PDE3B enzymes in adipose tissue, liver, and pancreatic β cells play an important role in regulation of energy homeostasis.
Methods
Production of Pde3b-deficient mice.
The Pde3b targeting vector (for construction of the Pde3b targeting vector, see Figure 1 and Supplemental Methods) was linearized with HindIII and electroporated into RW-4 (129/SvJ-derived) ES cells (Human Genome Sciences). Positive ES cell clones, screened by Southern blot analysis and PCR, were microinjected into C57BL blastocysts and implanted into pseudopregnant females. Resulting chimeras were mated to Black Swiss mice to produce HE F1 progeny, which were backcrossed with the JAX 129/SvJ (pTyrc-ch/pTyrc) substrain. Genotyping of generation F2 mice was performed with DNA from tail tips by Southern blots and PCR. Protocols for mouse generation and maintenance as well as all animal studies were approved by the NHLBI Animal Care and Use Committee.
Southern blots, Northern blots, genomic PCR, and real-time RT-PCR.
All were performed as described in Supplemental Methods and Figure 1.
cAMP PDE assay.
Further details are provided in Supplemental Methods. Samples were assayed as described previously (37). Protein concentration was determined by Protein Assay Reagent Kit (Pierce Biotechnology) with BSA as standard.
Tissue fractionation.
Preparation of subcellular fractions and partial purification of liver PDE3A and PDE3B is described in Supplemental Methods, with results presented in Supplemental Figure 1.
Western blots.
Details and commercial sources of antibodies are provided in Supplemental Methods. After SDS-PAGE, proteins were electrotransferred to PVDF membranes (Millipore). Chemiluminescent signals were developed with West Femto or Pico kits (Pierce Biotechnology), followed by detection by LAS-3000 or LAS-1000plus systems (FujiFilm).
Adipocyte preparation, adipocyte size, lipolysis, glucose uptake, lipogenesis, and analysis of FAS and PKB.
These processes are described in detail in Supplemental Methods. Adipocytes were isolated from epididymal fat pads by collagenase digestion (38) and were counted (39). Cell volumes were calculated from diameter measurements (at least 100 adipocytes of each preparation) made with a Zeiss LSM 5 confocal microscope. Total neutral lipid was measured gravimetrically and cell numbers were calculated (39). Lipolysis (glycerol accumulation) was measured using Trinder kits (Sigma-Aldrich) according to the manufacturer’s instructions. We measured 2-deoxy-D-[1-3H]-glucose uptake and lipogenesis in isolated adipocytes as previously described (8, 40, 41). Cytosolic fractions of adipocytes were used for Western blot analyses of FAS expression and PKB/phosphorylated PKB.
Liver TG content.
Further details are provided in Supplemental Methods. After mice were euthanized, livers were immediately perfused in situ with PBS solution (10 ml) via the portal vein to remove blood. Liver pieces (100 mg each) were homogenized in 1 ml buffer (0.5 M Tris, 1% Triton X-100, pH 7.4). After extraction into chloroform/methanol (2:1), samples were dried and assayed for TG content using TG reagent (Trace/DMA; Thermo Electron Corp.), with triolein as standard and measuring absorbance at 540 nm according to the manufacturer’s instructions.
Preparation of liver extracts from nonfasted and fasted mice.
Further details are provided in Supplemental Methods. WT and KO male mice (5 months old; n = 4 per group), nonfasted or fasted for 6 hours (started 1 hour after beginning a light cycle), were killed by CO2 asphyxiation, followed by cervical dislocation. Homogenates were centrifuged (1,000 g for 5 minutes). Resulting supernatants (total extracts) were aliquoted and stored at –80°C until future use.
Hepatic cAMP.
Two hundred milligrams of frozen liver from nonfasted and fasted WT and KO mice (n = 4 per group) were immediately immersed into 1:10 (wt/vol) ice-cold 0.1 N HCl solution and homogenized (20 strokes with a Teflon pestle). After centrifugation (20,000 g at 4°C for 2 hours), supernatants were assayed for cAMP (cAMP assay kit; R&D Systems).
Isolation of mouse islets.
Further details are provided in Supplemental Methods. Pancreatic islets were isolated from 4-month-old WT and KO mice by a previously described collagenase digestion technique (12, 13). Groups of 3 islets were distributed in 96-well plates and incubated in 200 μl of modified Krebs-Ringer–HEPES buffer (10 mM HEPES, pH 7.2–7.4, 120 mM NaCl, 5 mM KCl, 2.5 mM CaCl2, 1.2 mM KH2PO4, 1.2 mM MgSO4, 5 mM NaHCO3, and 0.2% BSA) without or with glucose and/or GLP-1 for 1 hour at 37°C. Buffer was withdrawn for quantification of insulin (commercial RIA kits; Linco).
Immunohistochemistry.
Further details are provided in Supplemental Methods. Pancreases were dissected, fixed overnight, rinsed thoroughly, and frozen on dry ice. Immunohistochemical analyses and measurements of islet size were performed as described previously (13).
Analysis of metabolites and hormones.
For experiments in which blood glucose and/or serum glycerol, FFA, and insulin levels were measured following i.p. or i.v. injection of PBS alone or CL, ISO, insulin, or glucose in PBS, serum samples were prepared by centrifugation (4°C) of blood collected from tail veins cut with a scalpel blade (after warming tails for 1 minute with a lamp) or from retroorbital sinuses. Insulin and leptin levels were assayed with ELISA kits from Alpco Diagnostics and Crystal Chem Inc., respectively. FFA levels were measured enzymatically with the colorimetric Half-Micro Test (Roche Applied Science), and glycerol and TGs were measured with Trinder kits from Sigma-Aldrich or the enzymatic method of Wieland (42). Serum adiponectin was measured with a RIA kit (Linco), and blood glucose was measured in 1–2 drops of tail blood with the Bayer Glucometer Elite.
GTTs and ITTs.
After overnight fasting, conscious mice were injected i.p. (10 ml/kg) with glucose (2 g/kg) or insulin (0.5 U/kg) in PBS. At the indicated times (Figure 7), blood glucose was measured, and/or 0.2 ml of tail blood was taken for measurement of serum FFA or insulin levels.
Hyperinsulinemic-euglycemic clamps.
Further details are provided in Supplemental Methods. The clamps, based on the procedure developed by Kim, Shulman, and collaborators (43, 44), were performed 4–6 days after catheter placement essentially as described by Chen et al. (45). Experiments, started after a 16-hour overnight fast, used [3-3H]glucose and 2-deoxy-D-[1-14C]-glucose (both from PerkinElmer) for the estimation of whole-body glucose fluxes and tissue glucose uptake, respectively. After 120 minutes of basal [3-3H]glucose infusion, hyperinsulinemic-euglycemic clamps were begun with a priming infusion of human insulin (300 mIU/kg) bolus over 3 minutes, followed by 15 pmol/kg/min of Humulin R (Lilly), and 20% glucose was infused at a rate adjusted to keep plasma glucose at approximately 110 mg/dl.
Statistics.
Data are expressed as mean ± SEM. All data presented with statistical analyses were analyzed using a 2-tailed Student’s t test (paired and unpaired) with Microsoft Excel 2003 with Data Analysis Toolpak (Microsoft). P values less than 0.05 were considered to be significant.
Supplementary Material
Acknowledgments
We thank Martha Vaughan (NHLBI) for her support and critical reading of the manuscript as well as Ed Ginns (National Human Genome Research Institute, NIH) and Mary La Marca (National Institute of Mental Health, NIH) for assistance in generating the KO mice. This work was supported in part by grants to E. Degerman from the Swedish Medical Research Council (no. 3362), Novo Nordisk, the A. Påhlssons Foundation, and the Swedish Diabetes Association.
Footnotes
Nonstandard abbreviations used: CL, CL 316,243; CREB, cAMP regulatory element–binding protein; Cyc, cyclophilin A; EGP, endogenous glucose production; FAS, fatty acid synthase; FKHRL1, Forkhead (Drosophila) homolog (rhabdomyosarcoma) like 1; GLP-1, glucagon-like peptide–1; GSK-3, glycogen synthase kinase-3; GTT, glucose tolerance test; HE, heterozygous; IRS-1, insulin receptor substrate–1; ISO, isoproterenol; ITT, insulin tolerance test; Neor, neomycin resistance; PAI-1, plasminogen activator inhibitor–1; PDE, cyclic nucleotide phosphodiesterase; PEPCK, phosphoenolpyruvate carboxykinase; PGC-1α, PPARγ coactivator–1α; TRB3, tribbles 3; TG, triglyceride.
Conflict of interest: The authors have declared that no conflict of interest exists.
Citation for this article: J. Clin. Invest. 116:3240–3251 (2006). doi:10.1172/JCI24867
References
- 1.Collins S., Surwit R.S. The β-adrenergic receptors and the control of adipose tissue metabolism and thermogenesis. Recent Prog. Horm. Res. 2001;56:309–328. doi: 10.1210/rp.56.1.309. [DOI] [PubMed] [Google Scholar]
- 2.Francis S.H., Turko I.V., Corbin J.D. Cyclic nucleotide phosphodiesterases – relating structure and function. Prog. Nucleic Acid Res. Mol. Biol. 2001;65:1–52. doi: 10.1016/s0079-6603(00)65001-8. [DOI] [PubMed] [Google Scholar]
- 3. Manganiello, V.C., and Degerman, E. 2004. Cyclic nucleotide phosphodiesterases. In Encyclopedia of biological chemistry. W. Lennarz and M.D. Lane, editors. Elsevier Science Academic Press. San Diego, California, USA. 501–505. [Google Scholar]
- 4.Shakur Y., et al. Regulation and function of the cyclic nucleotide phosphodiesterase (PDE3) gene family. Prog. Nucleic Acid Res. Mol. Biol. . 2001;66:241–277. doi: 10.1016/s0079-6603(00)66031-2. [DOI] [PubMed] [Google Scholar]
- 5.Zhao A., Zhao H., Teague J., Fujimoto W., Beavo J.A. Attenuation of insulin secretion by IGF-1 is mediated through activation of phosphodiesterase 3B. Proc. Natl. Acad. Sci. U. S. A. 1997;94:3223–3228. doi: 10.1073/pnas.94.7.3223. [DOI] [PMC free article] [PubMed] [Google Scholar]
- 6.Liu H., Maurice D.H. Expression of cyclic GMP-inhibited phosphodiesterases 3A and 3B (PDE3A and PDE3B) in rat tissues: differential subcellular localization and regulated expression by cyclic AMP. Br. J. Pharmacol. 1998;125:1501–1510. doi: 10.1038/sj.bjp.0702227. [DOI] [PMC free article] [PubMed] [Google Scholar]
- 7. Degerman, E., et al. 2003. Role for phosphodiesterase 3B in regulation of lipolysis and insulin secretion. In Diabetes mellitus: a fundamental and clinical text. 3rd edition. D. LeRoith, S.I. Taylor, and J.M. Olefsky, editors. Lippincott-Raven Publishers. Philadelphia, Pennsylvania, USA. 373–381. [Google Scholar]
- 8.Zmuda-Trzebiatowska E., Oknianska A., Manganiello V., Degerman E. Role of PDE3B in insulin-mediated glucose uptake, GLUT-4 translocation, and lipogenesis in primary rat adipocytes. Cell. Signal. 2005;18:382–390. doi: 10.1016/j.cellsig.2005.05.007. [DOI] [PubMed] [Google Scholar]
- 9.Eriksson J.W., Wesslau C., Smith U. The cGMP-inhibitable phosphodiesterase modulates glucose transport activation by insulin. Biochim. Biophys. Acta. 1994;1189:163–167. doi: 10.1016/0005-2736(94)90061-2. [DOI] [PubMed] [Google Scholar]
- 10.Zhao A.Z., Bornfeldt K.E., Beavo J.A. Leptin inhibits insulin secretion by activation of phosphodiesterase 3B. J. Clin. Invest. . 1998;102:869–873. doi: 10.1172/JCI3920. [DOI] [PMC free article] [PubMed] [Google Scholar]
- 11.Zhao A.Z., et al. Leptin induces insulin-like signaling that antagonizes cAMP elevation by glucagon in hepatocytes. J. Biol. Chem. 2000;275:11348–11354. doi: 10.1074/jbc.275.15.11348. [DOI] [PubMed] [Google Scholar]
- 12.Harndahl L., et al. Important role of phosphodiesterase 3B for the stimulatory action of cAMP on pancreatic β-cell exocytosis and release of insulin. J. Biol. Chem. 2002;277:37446–37455. doi: 10.1074/jbc.M205401200. [DOI] [PubMed] [Google Scholar]
- 13.Harndahl L., et al. Beta-cell-targeted overexpression of phosphodiesterase 3B in mice causes impaired insulin secretion, glucose intolerance and deranged islet morphology. J. Biol. Chem. 2004;279:15214–15222. doi: 10.1074/jbc.M308952200. [DOI] [PubMed] [Google Scholar]
- 14.Tang Y., et al. Improvement in insulin resistance and the restoration of reduced phosphodiesterase 3B gene expression by pioglitazone in adipose tissue of obese diabetic KKAy mice. Diabetes. 1999;48:1830–1835. doi: 10.2337/diabetes.48.9.1830. [DOI] [PubMed] [Google Scholar]
- 15.Tang Y., et al. Adipocyte-specific reduction of phosphodiesterase 3B gene expression and its restoration by JTT-501 in the obese, diabetic KKAy mouse. Eur. J. Endocrinol. 2001;145:93–99. doi: 10.1530/eje.0.1450093. [DOI] [PubMed] [Google Scholar]
- 16.Tang Y., et al. Phosphodiesterase 3B gene expression is enhanced in the liver but reduced in the adipose tissue of the obese insulin resistant db/db mouse. Diabetes Res. Clin. Pract. 2001;54:145–155. doi: 10.1016/s0168-8227(01)00271-6. [DOI] [PubMed] [Google Scholar]
- 17.Hasegawa M., et al. Differential regulation of gene expression and insulin-induced activation of phosphodiesterase 3B in adipocytes of lean insulin-resistant IRS-1(–/–) mice. Diabetes Res. Clin. Pract. 2002;58:79–85. doi: 10.1016/s0168-8227(02)00132-8. [DOI] [PubMed] [Google Scholar]
- 18.Granneman J.G., Lahners K.N., Chaudhry A. Molecular cloning and expression of the rat β3-adrenergic receptor. . Mol. Pharmacol. 1991;40:895–899. [PubMed] [Google Scholar]
- 19.El-Metwally M., Shafiee-Nick R., Pyne N.J., Furman B.L. The effect of selective phosphodiesterase inhibitors on plasma insulin concentrations and insulin secretion in vitro in the rat. Eur. J. Pharmacol. . 1997;324:227–232. doi: 10.1016/s0014-2999(97)00076-9. [DOI] [PubMed] [Google Scholar]
- 20.Parker J.C., Van Volkenburg M.A., Nardone N.A., Hargrove D.M., Andrews K.M. Modulation of insulin secretion and glycemia by selective inhibitors of cAMP phosphodiesterase III. Biochem. Biophys. Res. Commun. 1997;236:665–669. doi: 10.1006/bbrc.1997.7034. [DOI] [PubMed] [Google Scholar]
- 21.Gavrilova O., Marcus-Samuels B., Reitman M.L. Lack of responses to a β3-adrenergic agonist is lipoatrophic A-ZIP/F-1 mice. . Diabetes. 2000;49:1910–1916. doi: 10.2337/diabetes.49.11.1910. [DOI] [PubMed] [Google Scholar]
- 22.Grujic D., et al. β3-adrenergic receptors on white and brown adipocytes mediate β3-selective agonist-induced effects on energy expenditure, insulin secretion and food intake. . J. Biol. Chem. 1997;272:17686–17693. doi: 10.1074/jbc.272.28.17686. [DOI] [PubMed] [Google Scholar]
- 23.Koo S.H., et al. PGC-1 promotes insulin resistance in liver through PPARα-dependent induction of TRB-3. Nat. Med. 2004;10:530–534. doi: 10.1038/nm1044. [DOI] [PubMed] [Google Scholar]
- 24.Whiteman E.L., Cho H., Birnbaum M.J. Role of Akt/protein kinase B in metabolism. Trends Endocrinol. Metab. 2002;13:444–451. doi: 10.1016/s1043-2760(02)00662-8. [DOI] [PubMed] [Google Scholar]
- 25.Klover P., Mooney R.A. Hepatocytes: critical for glucose homeostasis. Int. J. Biochem. Cell Biol. 2004;36:753–758. doi: 10.1016/j.biocel.2003.10.002. [DOI] [PubMed] [Google Scholar]
- 26.Scherer P.E. Adipose tissue: from lipid storage compartment to endocrine organ. Diabetes. 2006;55:1537–1545. doi: 10.2337/db06-0263. [DOI] [PubMed] [Google Scholar]
- 27.Berg A.H., Combs T.P., Du X., Brownlee M., Scherer P. The adipocyte secreted protein Acrp30 enhances hepatic insulin action. Nat. Med. 2001;7:947–953. doi: 10.1038/90992. [DOI] [PubMed] [Google Scholar]
- 28.Arner P. The adipocyte in insulin resistance: key molecules and the impact of thiazolidenediones. Trends Endocrinol. Metab. . 2003;14:137–145. doi: 10.1016/s1043-2760(03)00024-9. [DOI] [PubMed] [Google Scholar]
- 29.Yamauchi T., et al. Adiponectin stimulates glucose utilization and fatty acid oxidation by activating AMP-activated protein kinase. Nat. Med. 2002;8:1288–1295. doi: 10.1038/nm788. [DOI] [PubMed] [Google Scholar]
- 30.Ouedraogo R., et al. Adiponectin suppression of high glucose-induced reactive oxygen species in vascular endothelial cells: evidence for involvement of a cAMP signaling pathway. Diabetes. 2006;55:1840–1846. doi: 10.2337/db05-1174. [DOI] [PubMed] [Google Scholar]
- 31.Den Boer M., Voshol P.J., Kuipers F., Havekes L.M., Romijin J.A. Hepatic steatosis: a mediator of the metabolic syndrome. Lessons from animal models. Arterioscler. Thromb. Vasc. Biol. 2004;24:644–649. doi: 10.1161/01.ATV.0000116217.57583.6e. [DOI] [PubMed] [Google Scholar]
- 32.Seppala-Lindroos A., et al. Fat accumulation in the liver is associated with defects in insulin suppression of glucose production and serum free fatty acids independent of obesity in normal men. J. Clin. Endocrinol. Metab. 2002;87:3023–3028. doi: 10.1210/jcem.87.7.8638. [DOI] [PubMed] [Google Scholar]
- 33.Adams L.A., Angulo P., Lindor K.D.2005. . Nonalcoholic fatty liver disease. CMAJ. 172899–905. [DOI] [PMC free article] [PubMed] [Google Scholar]
- 34.Boden G. Role of fatty acids in the pathogenesis of insulin resistance and NIDDM. Diabetes. 1997;46:3–10. [PubMed] [Google Scholar]
- 35.Cheung P., Yang G., Boden G. Milrinone, a selective PDE3 inhibitor, stimulates lipolysis, endogenous glucose production and insulin secretion. Metabolism. 2003;52:1496–1500. doi: 10.1016/s0026-0495(03)00271-3. [DOI] [PubMed] [Google Scholar]
- 36.Degerman E., Manganiello V., Holst J.J., Ahren B. Milrinone efficiently potentiates insulin secretion induced by orally, but not intravenously, administered glucose in C57BL6J mice. Eur. J. Pharmacol. 2004;498:319–323. doi: 10.1016/j.ejphar.2004.07.096. [DOI] [PubMed] [Google Scholar]
- 37.Kincaid R.L., Manganiello V.C. Assay of cyclic nucleotide phosphodiesterase using radiolabeled and fluorescent substrates. Methods Enzymol. . 1988;159:457–470. doi: 10.1016/0076-6879(88)59045-6. [DOI] [PubMed] [Google Scholar]
- 38.Honnor R.C., Dhillon G.S., Londos C. cAMP-dependent protein kinase and lipolysis in rat adipocytes. I. Cell preparation, manipulation, and predictability in behavior. J. Biol. Chem. 1985;260:15122–15129. [PubMed] [Google Scholar]
- 39.Fine J.B., Di Girolamo M. A simple method to predict cellular density in adipocyte metabolic incubations. Int. J. Obes. Relat. Metab. Disord. 1997;21:764–768. doi: 10.1038/sj.ijo.0800469. [DOI] [PubMed] [Google Scholar]
- 40.Ramlal T., Sarabia V., Bilan P.J., Klip A. Insulin-mediated translocation of glucose transporters from intracellular membranes to plasma membranes: sole mechanism of stimulation of glucose transport in L6 muscle cells. Biochem. Biophys. Res. Commun. 1988;157:1329–1335. doi: 10.1016/s0006-291x(88)81020-9. [DOI] [PubMed] [Google Scholar]
- 41.Moody A.J., Stan M.A., Stan M., Gliemann J. A simple free fat cell bioassay for insulin. Horm. Metab. Res. 1974;6:12–16. doi: 10.1055/s-0028-1093895. [DOI] [PubMed] [Google Scholar]
- 42.Wieland O. Enzymic method for the determination of glycerin. Biochem. Z. 1957;329:313–319. [PubMed] [Google Scholar]
- 43.Kim J.K., et al. Redistribution of substrates to adipose tissue promotes obesity in mice with selective insulin resistance in muscle. J. Clin. Invest. 2000;105:1791–1797. doi: 10.1172/JCI8305. [DOI] [PMC free article] [PubMed] [Google Scholar]
- 44.Haluzik M., et al. Adrenalectomy improves diabetes in A-ZIP/F-1 lipoatrophic mice by increasing both liver and muscle insulin sensitivity. Diabetes. 2002;51:2113–2118. doi: 10.2337/diabetes.51.7.2113. [DOI] [PubMed] [Google Scholar]
- 45.Chen M., et al. Increased insulin sensitivity in paternal Gnas KO mice is associated with increased lipid clearance. . Endocrinology. 2004;145:4094–4102. doi: 10.1210/en.2004-0038. [DOI] [PubMed] [Google Scholar]
Associated Data
This section collects any data citations, data availability statements, or supplementary materials included in this article.


