

Abstract
We present a method for the global analysis of the function of genes in budding yeast based on hierarchical clustering of the quantitative sensitivity profiles of the 4756 strains with individual homozygous deletion of nonessential genes to a broad range of cytotoxic or cytostatic agents. This method is superior to other global methods of identifying the function of genes involved in the various DNA repair and damage checkpoint pathways as well as other interrogated functions. Analysis of the phenotypic profiles of the 51 diverse treatments places a total of 860 genes of unknown function in clusters with genes of known function. We demonstrate that this can not only identify the function of unknown genes but can also suggest the mechanism of action of the agents used. This method will be useful when used alone and in conjunction with other global approaches to identify gene function in yeast.
Keywords: deletion pool, functional genomics, hierarchical clustering, phenotypic profiling, yeast
Introduction
A major challenge facing biologists today is the assignment of function to the novel genes identified during the sequencing phase of the human genome project. A useful resource for this task in the baker's yeast, Saccharomyces cerevisiae, has been the creation of a set of homozygous deletions of all nonessential genes, with each gene replaced by a cassette containing a 20-mer molecular ‘barcode' unique to each deletion mutant (Giaever et al, 2002). This set of deletion mutants has been used by a number of investigators to identify genes involved in response to DNA-damaging agents and in other processes (reviewed in Scherens and Goffeau, 2004). In most cases, investigators have tested the deletion strains individually rather than by hybridizing the amplified barcodes from a pool of all mutants to a high-density oligonucleotide array, which allows the relative abundance of all the strains in a pool of all deletion mutants to be determined. The hybridization method has the advantage that it allows each deletion strain to be rapidly ranked on a continuum for sensitivity or resistance to the environmental change rather than in discrete bins, such as sensitive, refractory or neutral, where the boundaries are subjective. We and others have shown that hybridization of the amplified DNA barcodes is a highly reproducible method of identifying genes responsible for resistance to DNA damage (Birrell et al, 2001; Wu et al, 2004; Lee et al, 2005).
In the present study, we have explored further the use of quantitative phenotypic profiling of the 4756 viable yeast deletion mutants in response to a variety of agents, to identify gene function (or the ‘biological process' in gene ontology (GO) terms). We show that, at least for the processes interrogated, this is a powerful method and appears superior to other genome-wide methods of identifying gene function, including protein–protein interactions, gene expression profiling and synthetic lethality.
Results and discussion
Generation of phenotypic profiles for nonessential gene deletions
We obtained phenotypic profiles of the pool of homozygous diploid deletions of all nonessential genes for a total of 51 diverse stresses, including some that we reanalyzed from publicly available databases (Table I). Each of these profiles provides a quantitative distribution of the sensitivity or resistance for an individual gene deletion. The final complete data set is provided in the Supplementary Information I, and all of the raw cel files generated by us are available on the supporting website (http://microarray-pubs.stanford.edu/phenotypic_profiling/).
Table 1.
List of agents used in clustering analysis
| Name | Rep | Treatment | Control | Ref |
|---|---|---|---|---|
| AAPO | 2 | Antimycin A 1 μg/ml, 1 mM hydrogen peroxide chronic 16 h | Mock | a |
| ACTD | 3 | Actinomycin D 400 μM 4 h, YPD 17 h | Mock | a |
| ALK-15G | 2 | pH 8.0 15 generations | Historic | b |
| ALK-5G | 2 | pH 8.0 five generations | Historic | b |
| ANTA | 3 | Antimycin A 1 μg/ml in YPD chronic 16 h | Mock | a |
| ARAC | 2 | AraC 400 μM 4 h, YPD 16 h | Mock | a |
| ARN | 4 | Arsenite 1 mM (2), 2.5 mM (1), 5 mM (1) 1 h, YPD 16 h | Mock | f |
| ARS | 3 | Arsenic 20 μM (1) or 100 μM (2) 2 h, YPD 16 h | Mock | a |
| BEN | 3 | Benomyl 10 μM (2) or 15 μM (1) 2 h, YPD 16 h | Mock | a |
| BLEO | 4 | Bleomycin 0.01 U/ml 4 h, YPD 16 h | Mock | a |
| CAFF | 3 | Caffeine 6 mM chronic 16 h | Mock | a |
| CALC | 3 | Calcofluor white 3 μg/ml chronic 16 h | Mock | a |
| CIS1 | 6 | Cisplatin 1.0 mM 1 h, YPD 16 h | Mock | e |
| CIS4 | 6 | Cisplatin 0.23 mM 4 h, YPD 16 h | Mock | e |
| CPTA | 3 | Camptothecin 250 μM (2) or 300 μM (1) 2 h, YPD 16 h | Mock | a |
| CPTC | 3 | Camptothecin 5 μg/ml chronic 16 h | Mock | a |
| DOX | 6 | Doxorubicin 0.2 mM 4 h, YPD 16 h | Mock | a |
| GAL-15G | 2 | YPGalactose 15 generations | Historic | b |
| GAL-5G | 2 | YPGalactose five generations | Historic | b |
| GLYE | 3 | YEP 2% glycerol 2% ethanol chronic 16 h | Mock | a |
| H2O2 | 4 | Hydrogen peroxide 3 mM chronic 16 h | Mock | a |
| HU | 3 | Hydroxyurea 100 mM chronic 16 h | Mock | a |
| HYGB | 3 | Hygromycin B 7 μg/ml chronic 16 h | Mock | a |
| IDA | 3 | Idarubicin 50 μM (2) or 100 μM (1) 2 h, YPD 16 h | Mock | a |
| IR | 3 | IR 200Gy Cs137, YPD 18 h | Mock | d |
| LOVA | 3 | Lovastatin 100 μg/ml (0.75% EtOH) chronic 16 h | Mock | a |
| LYS | 2 | Lys minus five generations | Mock | b |
| MECH | 1 | Mechlorethamine 20 μM 3 h, YPD 16 h | Mock | a |
| MEL | 3 | Melphalan 800 μM 4 h, YPD 16 h | Mock | a |
| MIN-15G | 2 | Minimal+his/leu/ura 15 generations | Historic | b |
| MIN-5G | 2 | Minimal+his/leu/ura five generations | Historic | b |
| MMC | 5 | MitomycinC 0.5 mM 4 h, YPD 16 h | Mock | e |
| MMS | 3 | Methyl methanesulfonate 0.03% chronic 16 h | Mock | a |
| NACL-15G | 2 | NaCl 1 M 15 generations | Historic | b |
| NACL-5G | 2 | NaCl 1 M five generations | Historic | b |
| NYS-15G | 2 | Nystatin 10 μM 15 generations | Historic | b |
| NYS-5G | 2 | Nystatin 10 μM five generations | Historic | b |
| OXA | 3 | Oxaloplatin 4 h 10 mM, YPD 16 h | Mock | e |
| RAFA | 3 | Raffinose 6% with 1 μg/ml antimycin A chronic 16 h | Mock | a |
| SC | 2 | Minimal complete five generations | Historic | b |
| SORB-15G | 2 | Sorbitol 1.5 M 15 generations | Historic | b |
| SORB-5G | 2 | Sorbitol 1.5 M five generations | Historic | b |
| THR | 1 | Thr minus five generations | Historic | b |
| TPT | 1 | Topotecan 20 μM 3 h, YPD 16 h | Mock | a |
| TPZ | 4 | Tirapazamine 250 μM (3) or 300 μM (1) 2 h, YPD 16 h | Mock | a |
| TRP | 2 | Trp minus five generations | Historic | b |
| UVA | 4 | UVA 36 J/cm2 (1), 288 J/cm2 (3), 16 h YPD | Mock | a |
| UVB | 5 | UVB 3400 J/m2, YPD 16 h | Mock | c |
| UVC | 5 | UVC 200 J/m2, YPD 16 h | Mock | c |
| WORT | 3 | Wortmannin 1.5 μM (DMSO 1 μg/ml SC) chronic 16 h | Mock | a |
| YPD | 3 | Growth in YPD media 16 h | Time 0 | a |
Name given to each type of treatment followed by the number of repetitions that make up the geometric mean ratio of treated over the control. Treatment is a brief description of the treatment parameters: drug, concentration, and time. Chronic exposure is batch growth in continuous presence of the treatment. Acute exposures are for a defined time period followed by a recovery phase in YPD media. The type of control is indicated as a matched ‘mock' control, a ‘time 0' control used for change over time, and the ‘historic' controls taken from Giaever et al (2002) in which a highly replicated control condition was tested for the given number of generations. The references cited are (a) this work; (b) Giaever et al (2002); (c) Birrell et al (2001); (d) Game et al (2003); (e) Wu et al (2004); and (f) Haugen et al (2004).
Hierarchical clustering of the phenotypic profiles identifies treatments by mechanism of action
To assess the degree of similarity of the phenotypic profiles of individual deletion strains, and therefore the likely gene products in various functional pathways, we clustered all the data without filtering out any of the phenotypically neutral deletions. Figure 1 shows the hierarchical clustering of the phenotypic profiles of 4281 genes after filtering for data quality against the 51 different treatments. We employed two-way unsupervised uncentered clustering employing a Pearson's correlation coefficient in order to favor trends in the profiles rather than the absolute magnitudes. It is apparent from the vertical axis of Figure 1 showing the treatments used that hierarchical clustering groups the agents by mechanism of action. This is expected, as agents with the same mechanism of action should produce similar phenotypic profiles. The shorter the vertical lengths of the arms of the dendrogram connecting adjacent treatments, the closer the mechanisms of action of the agents used. For example, UVB and UVC with two different wavelengths and intensities produce the same lesions and have almost indistinguishable phenotypes, whereas a third wavelength (UVA) producing a different spectrum of lesions does not (Cadet et al, 2005). Similar profiles are also produced by chronic or acute exposures to camptothecin (CPTC and CPTA), amino-acid deprivation (TRP, LYS and SC), the two platinum analogs, cisplatin (CIS1 and CIS4 for a 1 and 4 h exposure to cisplatin) and oxaliplatin (OXA), and two bifunctional alkylating anticancer agents that kill cells by forming interstrand crosslinks, mitomycin C and mechlorethamine. Also, the novel anticancer agent tirapazamine, which we have recently shown produces DNA double-strand breaks by poisoning topoisomerase II (Peters and Brown, 2002), has a profile similar to that for the known topoisomerase II poison idarubicin.
Figure 1.

Two-way unsupervised uncentered unnormalized hierarchical clustering using a Pearson's correlation of the phenotypic profiles of 4281 nonessential genes to 51 different treatments. The expanded region shows the DNA-damage cluster, which contains the components of the DNA-damage checkpoint function, nucleotide excision repair, and homologous recombination.
Hierarchical clustering identifies gene function and compares favorably with other methods in identifying the genes in the DNA-damage response pathway
The expanded portion of Figure 1 shows the genes whose deletion produces sensitivity to the diverse set of DNA-damaging agents used. Of note is the fact the DNA-damage checkpoints genes RAD17, RAD24, MEC3, RAD9 and DDC1 form a tight group and represent all of the nonessential DNA-damage cell-cycle checkpoint genes involved in sensing DNA damage (Zhou and Elledge, 2000). In addition, all of the nonessential genes involved in nucleotide excision repair (NER) are in their own subcluster with no false positives (genes in the cluster not involved in NER). Note that the two uncharacterized open-reading frames (ORFs) at the top of Figure 1 (inset), YBR099C and YBR100W, are not separate bona fide genes—YBR099C is characterized as a dubious ORF on the opposite strand of MMS4 (so its deletion would also delete MMS4), and YBR100W has now been annotated as part of MMS4 following correction of a sequencing error (Brachat et al, 2003). The fact that both of these ORFs cocluster with MMS4 provides additional support for the robustness of the clustering analysis. Despite this efficient functional classification of the genes involved in the response of the cell to DNA damage, some are missing. These have hybridization signals in the control pool that are too low to give informative data (e.g. RAD6, RAD52, MRE11 and XRS2). This applied to 9% of the nonessential genes (see Supplementary Information II).
We analyzed the other three global methods for their ability to group the five genes involved in the DNA-damage checkpoint and NER (Table II). Protein–protein interactions identify only three members, Rad17p, Ddc1p and Mec3p, of the checkpoint group, and, in addition, identify 105 other proteins, most, if not all, of which are likely to be false positives. The data on synthetic lethality for these five genes also identify a number of genes that are likely not involved in the DNA-damage checkpoint, although hierarchical clustering of the profiles of synthetic lethality clusters four of the genes (all except MEC3) (Tong et al, 2004). Only four genes are synthetically lethal to all the DNA-damage checkpoint clusters of genes, of which the remaining unique lethalities argue incorrectly that they do not function in the same pathway. Table II also shows that expression profiling of yeast with highly similar sorts of treatments cannot cluster this group of genes, as none of the genes are coordinately regulated in response to DNA damage (Gasch et al, 2001) or to stress (Gasch et al, 2000). The nonessential genes involved in NER represent another well-studied pathway that is successfully clustered by phenotypic profiles as shown in Figure 1, but fails by the other methods. Combining all the protein–protein interactions from the Yeast Grid database (http://biodata.mshri.on.ca/yeast_grid/servlet/SearchPage), a network of direct linkages can be constructed linking all but one, Rad2, of the known members of the NEFs (NER factors), although incorporating 81 other potential false-positive interactions as shown in Table II. Synthetic lethality fails to show any shared interactions with the NER genes, and this failure is not due to the lack of a coessential function, as 10 unique lethalities are annotated on the Yeast Grid website. As seen with the DNA-damage checkpoint genes, there is an overall lack of transcriptional coordination that would implicate the NER genes in a common function. Of the nine NER genes, only RAD16 and RAD4 share a similar expression profile as shown in Table II, and the large number of additional genes implicated by coordinated expression are not functionally related.
Table 2.
Interacting proteins, synthetic lethal interactions, and coordinated gene expression for the nonessential genes in the DNA-damage checkpoint and NER pathways
| All nonessential genes in pathway | Clustered by phenotypic profiling? | Interacting proteins by two-hybrid, co-IP and mass spec. analysisa | Common synthetic lethalitya | Coordinated expression to stressb | Coordinated expression to DNA damageb | Cluster no. by integration analysisc |
|---|---|---|---|---|---|---|
| DNA damage checkpoint | ||||||
| DDC1 | Yes (0) | Mec3, Rad17 (3) | 4 (17)d | None (0) | None (0) | 8 |
| MEC3 | Yes (0) | Ddc1, Rad17 (84) | 4 (1) | None (0) | None (0) | 14 |
| RAD9 | Yes (0) | None (4) | 4 (11)d | None (0) | None (0) | 14 |
| RAD17 | Yes (0) | Ddc1, Mec3 (3) | 4 (1)d | None (0) | None (0) | 14 |
| RAD24 | Yes (0) | None (11) | 4 (6)d | None (0) | None (0) | 14 |
| NER | ||||||
| RAD1 | Yes (0) | Rad10, Rad14 (33) | 0 (0) | None (0) | None (0) | NC |
| RAD10 | Yes (0) | Rad1 (13) | 0 (1) | None (0) | None (2) | 9 |
| RAD14 | Yes (0) | Rad1, Rad4, Rad16 (3) | 0 (0) | None (0) | None (8) | 9 |
| RAD4 | Yes (0) | Rad14, Rad23 (1) | 0 (3) | Rad16 (>20) | None (0) | 9 |
| RAD23 | Yes (0) | Rad4 (9) | 0 (4) | None (0) | None (0) | NC |
| RAD2 | Yes (0) | None (1) | 0 (0) | None (>20) | None (1) | 9 |
| RAD7 | Yes (0) | Rad16, Elc1 (1) | 0 (0) | None (0) | None (4) | 9 |
| RAD16 | No (0) | Rad14, Rad7 (20) | 0 (2) | Rad4 (>20) | None (10) | 9 |
| ELC1 | Yes (0) | Rad7 (0) | 0 (0) | None (0) | None (0) | NC |
aInteraction data show the gene names, intrapathway interactions as well as the number of additional nonpathway interactions in parenthesis obtained from Yeast Grid as well as the number of synthetically lethal interactions found at (http://biodata.mshri.on.ca/yeast_grid/servlet/SearchPage).
bThe number of genes that are coordinately regulated using either response to DNA damage (Gasch et al, 2001) or to stress (Gasch et al, 2000) with a Pearson correlation of >0.8 to the query gene from http://db.yeastgenome.org/cgi-bin/expression/expressionConnection.pl.
cCoclusters identified by probabilistic functional analysis by Lee et al (2004). Cluster number is given or NC for genes which failed to cluster.
dGenes that are coclustered by Tong et al (2004).
Recently, efforts to combine the data sets and filter out the inherent noise have improved the ability to predict functional clusters of genes (Troyanskaya et al, 2003; Lee et al, 2004). As shown in Table II, combining the data sets filtered for quality is an improvement over any of the individual methods. The fact that phenotypic profiling is as good if not better than all of the other methods combined for at least these two functional groups demonstrates the interrogative power of the methodology.
Analysis of gene clusters by GO
A critical test of the value of phenotypic profiling is to identify the function of genes of previously unknown function. To determine the feasibility of this on a genome-wide scale, we first performed a rigorous statistical analysis (see Materials and methods) to divide the hierarchical cluster into subclusters of genes, such that the correlations by which the members of a subcluster were joined are significant. Using a false discovery rate (FDR) of 10%, we found 630 nonoverlapping subclusters, containing 3084 of the original 4281 genes. Some 860 and 1151 genes in these 630 subclusters are of unknown biological process or molecular function, respectively (not counting ‘dubious' ORFs). With the remaining 1197 unessential genes not currently assigned to a cluster at this cutoff, we have failed to elicit a significant shared phenotype for functionally related genes, suggesting that testing of more conditions designed to probe other cellular functions would cluster more functionally related genes.
Next, we used GO (Ashburner et al, 2000), a set of three structured, controlled vocabularies that define the biological processes, molecular functions and cellular components of gene products, in conjunction with GO annotations for yeast gene products curated by the Saccharomyces Genome Database (http://www.yeastgenome.org/GOContents.shtml). Using these, we determined whether GO annotations were significantly enriched among the genes within each significant subcluster using GO::TermFinder (Boyle et al, 2004; http://search.cpan.org/dist/GO-TermFinder/), which when given a list of genes, determines whether any of the GO terms are significantly enriched as compared to the background of GO annotations in the population of all genes. A caveat to this is that as a large proportion of the GO terms are based on mutant phenotypes, the process of relating phenotypes to GO terms is somewhat circular. However, there is at present no alternative gold standard against which to test functional clusters. Of the 630 subclusters generated, 84 showed significant associations (with a Bonferroni corrected P-value to allow for multiple hypothesis testing of less than 0.01) with one or more biological processes, 51 with molecular functions and 61 with cellular components. The lack of significance of the majority of the subclusters with GO terms does not mean that the genes in these clusters are not functionally related, because (i) we have tested only 51 conditions, and therefore have not interrogated all the biological processes in the cell, and (ii) 176 of the subclusters had only two genes, thereby precluding statistical significance. We have developed a web-based tool for rapidly browsing the results of our analyses that displays the GO structure and the phenotypic profiling data for our significant subclusters (http://microarray-pubs.stanford.edu/phenotypic_profiling/index.shtml). This should prove useful for other researchers to find genes clustered with their genes, or process of interest and its utility will grow as new phenotypic profiles interrogating additional cellular processes are added.
Comparison of phenotypic profiles as indicators of functional relationships with other genome-wide approaches
In order to compare the present phenotypic profiling method with the other genome-wide data sets, we evaluated the enrichment of known functional relationships between pairs of genes with highly correlated phenotypic profiles using the biological process GO as a gold standard (Ashburner et al, 2000). To test the predictive power of our data for biological processes that were directly targeted with our selection of 51 conditions and agents, we limited the gold standard for comparison to the GO terms: DNA repair (GO:0006281), amino-acid biosynthesis (GO:0008652), cell-cycle checkpoint (GO:0000075), response to osmotic stress (GO:0006970), aerobic respiration (GO:0009060) and galactose metabolism (GO:0006012).
Figure 2A illustrates the precision–recall characteristics of Pearson's correlations over pairs of phenotype profiles relative to a variety of high-throughput genomic data types (see Supplementary Information II). For the biological processes our study focuses on, the phenotype data are both more precise and sensitive than any of the other evidence types evaluated. For instance, at comparable specificity, phenotypic profile correlations predict five-fold more gene relationships than synthetic lethal interactions and 10-fold more than both high-throughput yeast two-hybrid or affinity precipitation experiments. For the processes evaluated here, the phenotypic data also provide more predictive power than microarray expression correlation over a variety of conditions. At the highest precision achieved by microarray correlation (∼7% at 0.6% recall), the phenotype data predict the same number of functional relationships at seven-fold higher precision (50% compared to 7%).
Figure 2.

Precision–recall evaluation of phenotype data on GO biological processes. The predictive power of phenotype profile correlations was evaluated against a gold standard based on six biological processes as defined by the GO: DNA repair, amino-acid biosynthesis, cell cycle checkpoint, response to osmotic stress, aerobic respiration, and galactose metabolism (A). The fraction of known functionally related gene pairs to total predictions (precision) at a range of thresholds is plotted versus the percentage of the number of known gene relationships recovered (recall) ( ). The characteristics of other high-throughput experimental data, affinity precipitation (▪), yeast two hybrid (
 ), synthetic lethality (
 ), transcription factor binding site data (
 ), microarray correlation (
 ), and functional data derived from Hughes et al (2000) (
 ) are shown for comparison. Two supervised feature selection methods were used to select the relevant features from the diverse collection of microarray data, one selecting single data set features independently and the other including or excluding entire data sets. The phenotype data is both more sensitive and precise than other high-throughput data on this set of processes. The phenotype profiles were also evaluated against a more general set of GO terms for comparison against existing data including (B) and excluding (C) the ribosome biogenesis GO term (GO:0007046), which tends to dominate gene pairs implicated by coexpression. The phenotype profiles implicate gene relationships over a broad range of biological processes.
Since the expression correlation used for comparison was computed over a set of 11 diverse data sets, one might expect that functional signal for the processes evaluated here might be obscured by the variety of other relationships present in the data. To test this hypothesis, we applied two different approaches to supervised feature selection on the 11 microarray data sets. First, we used a rank-sum statistic to test each microarray experiment (column) individually and selected the most functionally relevant set for the six GO terms of interest (Figure 2A, single feature selection). We also tried a supervised feature selection at the data set level, in which sets of experiments from the same data set were either all included or all excluded based on a comparison of correlations between the genes of interest with random pairs of genes from the same data set (Figure 2A, data set selection). Details of these approaches are discussed in Materials and methods. While supervised feature selection amplifies the functional signal present in correlations of expression profiles, neither approach yields comparable results to unsupervised correlations on the phenotype profiles. For instance, at 50% precision, the phenotype data predict 10-fold more gene relationships than the microarray data set feature selection, the more successful of the two supervised approaches (Figure 2A). Overall, the phenotypic data are clearly superior to existing high-throughput studies in predicting functional relationships specific to the processes interrogated.
We have also studied the enrichment of gene relationships in highly correlated phenotypic profiles across a broader range of biological processes. Figure 2B and C illustrate the precision–recall characteristics of our data compared to other high-throughput studies evaluated against a more general gold standard based on the biological process GO (see Materials and methods for details). Although the phenotypic data are not as precise or sensitive at predicting general functional relationships as it is in the target processes, it compares favorably with previous studies in this general evaluation. This is particularly evident if we exclude the ribosome biogenesis GO term (GO:0007046), which often dominates the gene relationships implicated by microarray coexpression (Figure 2C). Excluding this GO term, we find that the phenotype data can predict 100 gene–gene relationships correctly at 67% precision, while microarray coexpression and the Hughes et al (2000) data set, a functional profiling of deletion mutants, both predict 100 correct relationships at 30% precision.
Identifying the function of unknown genes coclustered with known genes
To test the hypothesis that an uncharacterized gene would function in the same pathway as the other genes in that cluster, we chose one of the subclusters identified by the GO analysis that included an ORF of unknown function. We chose the RIM subcluster (Supplementary Figure S1, Supplementary Information II), which contains many of the known proteins involved in the RIM101 pathway, so named for their ability to ‘regulate IM E2', a transcription factor involved in sporulation (von Mering et al, 2002). One gene, YGR122W, in the RIM cluster is currently not annotated for function, but would be predicted to be a member of the RIM101 pathway by our analysis. We performed a series of epistatic studies that not only showed that this ORF encoded a gene involved in sporulation, but also that it was in the same subpathway as the genes in the same phenotypic cluster (Figure S2, Supplementary Information II). This illustrates that clustering of phenotypic profiles can group genes in functional pathways not specifically interrogated by the agents or conditions used.
Materials and methods
Yeast strains
Genotypes of the parental yeast strain BY4743, construction of the homozygous diploid deletion strains and construction of the homozygous diploid deletion pool have been described previously (Winzeler et al, 1999; Giaever et al, 2002). We use a mutant pool of 4756 strains containing nonessential homozygous diploid deletions in the parental diploid strain BY4743. Construction of double mutants and testing of sporulation efficiencies was performed according to standard procedures (Guthrie and Fink, 1991).
Treatment assays, probe production and chip hybridization
Deletion pool aliquots are resuspended in YPD media and treated as described earlier (Wu et al, 2004). Briefly, equivalent numbers of cells (6 × 10⁶) are treated or mock treated for 1–16 h. For the acute treatments of less than 16 h, a fraction of the cell resuspension is washed and added to 60 ml YPD and grown for the indicated time at 30°C. After the regrowth period, the cells are harvested, the genomic DNA isolated, PCR amplification of the ‘molecular barcodes' performed, hybridized to custom-made Affymetrix oligonucleotide arrays and the chip scanned as described previously (Winzeler et al, 1999).
Postscanning analysis to maximize data quality
Each deletion strain is associated with four hybridization signals on the high-density oligonucleotide array generated in two separate PCR labeling reactions: UPTAG (sense and antisense) and DNTAG (sense and antisense). Equal numbers of cells are harvested in both the control and treated pools in order to produce equal pool label intensities. We normalize the data generated in the experimental array to that of the control array in order to eliminate any bias created during the PCR amplification reaction. In brief, we calculated separate UPTAG and DNTAG normalization factors, such that the total signal intensities of the UPTAGs and DNTAGs are equal in the control and experimental arrays. We calculate the background intensity of each array in order to identify those tags that fail to generate a signal sufficiently above the background level in the controls to produce a meaningful ratio as described earlier (Wu et al, 2004). For inclusion of strains in subsequent analyses, all three of the following criteria must hold:
Two or more of the tags for any strain must be at least 2 × background in any experimental control for that strain to be counted in that experiment.
Strains must be counted in two or more of the replicate experiments for a ratio to be called.
Strains must have a ratio called in 50% or more of the treatments. This minimizes clustering of ‘null' genes.
Application of these quality control criteria eliminated 9% of all strains in the pool (i.e. we analyzed 4281 of the total 4756 deletion strains). Data taken from previously published works (Birrell et al, 2001; Giaever et al, 2002; Game et al, 2003; Haugen et al, 2004; Wu et al, 2004) have been reanalyzed with the current criteria using the original cel files to standardize the data for inclusion in the hierarcial clustering. An average control cel file was generated for the analysis of the published data, which utilized a common historic control for pools grown after five and 15 generations from the original cel files (Giaever et al, 2002).
Hierarchical clustering
For the unsupervised complete linkage analysis, we used the Pearson correlation coefficient method of similarity measurement resident in the HCE 2.0 software available from the University of Maryland Human–Computer Interaction Lab (http://www.cs.umd.edu/hcil/hce/), without normalization, uncentered, two-way complete linkage.
Calculation of the number of significant subclusters
As we are performing multiple tests (one per each joining correlation in the hierarchical cluster), it is necessary to perform a multiple hypothesis correction. To do this, we used the FDR, which is the expected proportion of true null hypotheses rejected out of the total number of rejections. In our case, the null hypothesis is that the joining correlation of a cluster of genes is not significant, and the FDR is the proportion of hypotheses that we think are significant, but are not, that is, we erroneously reject the null hypothesis. To calculate an FDR for the correlation of each of the nodes in our hierarchical cluster, we permuted the phenotypic profiling data matrix within both rows and columns, and then clustered the permuted data. We repeated this process 1000 times, and the joining correlations for every node in each clustering were saved. We then processed the correlations generated for our real data, comparing them to the correlations generated by the permuted data, as follows:
Let S be the correlation for a node within a cluster, higher values of S being better.
For a given correlation, S 0, we computed the following:
R=the number of nodes generated from the clustered real data with a correlation ⩾S 0.
V=the number of nodes, on average, generated from the permuted data, with a correlation ⩾S 0.
The FDR for a given S 0, FDR(S 0), is thus given by V/R, and indicates the fraction of nodes with a correlation at or better than S 0, which would be expected to be false positives. Setting the FDR at 10%, we generated 630 nonoverlapping subclusters, containing 3084 of the original 4281 genes.
GO functional relationship evaluation and comparison with other genome-wide data
Each type of genomic data used for comparison is described in detail below.
Affinity precipitation, synthetic lethality and yeast two hybrid
Affinity precipitation, synthetic lethality and yeast two-hybrid data were obtained by merging data from the GRID and BIND databases (Breitkreutz et al, 2003; Alfarano et al, 2005).
Transcription factor binding sites
Transcription factor binding site data from SCPD (Zhu and Zhang, 1999) and TRANSFAC (Wingender et al, 2000) were downloaded from (http://seq.cbrc.jp/~wataru/PROSPECT/). Pairs of genes sharing a transcription factor were evaluated against the GO standard as described below.
Microarray correlation
We collected microarray data sets from the Stanford Microarray Database (Ball et al, 2005). Our collection includes 11 different studies, totaling 30 distinct biological conditions (see Supplementary Information II). Pearson's correlation coefficients for each gene pair were computed on each set of biological conditions separately and converted to standard normal z-scores. For example, for gene pair i–j in condition set k,
![]()
where ρ ij k is the Pearson correlation coefficient computed over the kth set of conditions, ρ̄ k is the average correlation over all pairs for those conditions and σρ k is the standard deviation over all pairs for those conditions. The final combined score for each gene pair was then computed by summing the z-scores for all sets of conditions, that is,
![]()
Microarray feature selection
Two supervised feature selection approaches were used on the diverse set of microarray data. For the individual experiment (column) feature selection approach, we used a rank-sum statistic to test the null hypothesis that the expression values of a group of coannotated genes (for any of the six GO terms of interest) was no different than a random set of genes of the same size drawn from the same array. Only experiments for which this hypothesis was rejected were used in computing the final correlation.
For the data set feature selection approach (i.e. where sets of experiments from the same data set were either all included or excluded), we computed correlation coefficients between all pairs of related genes for the six GO terms on each data set separately. Then, we tested the null hypothesis that this set of functional correlations was no different from correlations between random pairs of genes in the same data set. For both approaches, we used ⅓ of the related genes from each of the six categories to select features, and evaluated the remaining ⅔.
GO gold standard for evaluation
To compare the power of phenotypic profiles for predicting functional relationships with other genome-wide approaches, we obtained sets of gold standard-positive and -negative gene pairs from the Saccharomyces Genome Database annotation of the biological process GO (Ashburner et al, 2000). To test the predictive power of our data for biological processes related to the biological functions that were directly targeted with our selection of 51 conditions and agents, we limited the gold standard to the GO terms DNA repair (GO:0006281), amino-acid biosynthesis (GO:0008652), cell cycle checkpoint (GO:0000075), response to osmotic stress (GO:0006970), aerobic respiration (GO:0009060), and galactose metabolism (GO:0006012). Propagating all annotations from children of these nodes upward to the nodes themselves yields a total of approximately 21 000 positive pairs. To obtain gold standard negatives, we first propagated each biological process annotation up to its parents and counted the number of total direct and indirect annotations per GO term. As the biological specificity of each term roughly corresponds to the number of total annotations, gene pairs whose most specific coannotation occurs in nodes with 1000 total annotations or more were considered negatives. Furthermore, we limited the set of negatives to pairs with at least one gene annotated to one of the six specific nodes above (or their children), resulting in a total of 1.3 million gold standard-negative pairs.
For the comparison over a broader range of biological processes, we used the coannotation term size approach described above. Specifically, gold standard positives were all pairs of genes with coannotations in GO terms with less than 300 total direct and indirect annotations. Pairs of genes whose most specific coannotation occurs in nodes with 1000 total annotations or more were considered gold standard negatives, resulting in a total of approximately 500 000 positive pairs and 6 million negative pairs.
Constructing the precision–recall curve
Precision and recall for each genomic data type were calculated as described below.
True positives (TP): Gene pairs associated by data (high correlation) and annotated as positives in GO standard.
False positives (FP): Gene pairs associated by data (high correlation) and annotated as negatives in GO standard.
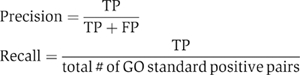
For continuous-valued data (e.g. correlation of phenotype profiles and microarray correlation), the precision and recall calculations above are computed for a range of thresholds. Each threshold yielded one point on the precision–recall curve by considering gene pairs whose correlation exceeds the threshold value as positive predictions and other pairs as negative.
Supplementary Material
Supplementary Information I
Supplementary Information II
Acknowledgments
This work was supported by a National Cancer Institute Grant P01 CA67166 (JMB), by a training Grant CA09302 (to JAB) from the National Cancer Institute, by Grant R01 HG003469 from the National Human Genome Research Institute (to GS), by a Quantitative and Computational Biology Program Grant T32 HG003284-01(CLM), and an NIH Grant 1R01GM071966-01A1 (to OGT).
References
- Alfarano C, Andrade CE, Anthony K, Bahroos N, Bajec M, Bantoft K, Betel D, Bobechko B, Boutilier K, Burgess E, Buzadzija K, Cavero R, D'Abreo C, Donaldson I, Dorairajoo D, Dumontier MJ, Dumontier MR, Earles V, Farrall R, Feldman H, Garderman E, Gong Y, Gonzaga R, Grytsan V, Gryz E, Gu V, Haldorsen E, Halupa A, Haw R, Hrvojic A, Hurrell L, Isserlin R, Jack F, Juma F, Khan A, Kon T, Konopinsky S, Le V, Lee E, Ling S, Magidin M, Moniakis J, Montojo J, Moore S, Muskat B, Ng I, Paraiso JP, Parker B, Pintilie G, Pirone R, Salama JJ, Sgro S, Shan T, Shu Y, Siew J, Skinner D, Snyder K, Stasiuk R, Strumpf D, Tuekam B, Tao S, Wang Z, White M, Willis R, Wolting C, Wong S, Wrong A, Xin C, Yao R, Yates B, Zhang S, Zheng K, Pawson T, Ouellette BF, Hogue CW (2005) The biomolecular interaction network database and related tools 2005 update. Nucleic Acids Res 33: D418–D424 [DOI] [PMC free article] [PubMed] [Google Scholar]
- Ashburner M, Ball CA, Blake JA, Botstein D, Butler H, Cherry JM, Davis AP, Dolinski K, Dwight SS, Eppig JT, Harris MA, Hill DP, Issel-Tarver L, Kasarskis A, Lewis S, Matese JC, Richardson JE, Ringwald M, Rubin GM, Sherlock G (2000) Gene ontology: tool for the unification of biology. The Gene Ontology Consortium. Nat Genet 25: 25–29 [DOI] [PMC free article] [PubMed] [Google Scholar]
- Ball CA, Awad IA, Demeter J, Gollub J, Hebert JM, Hernandez-Boussard T, Jin H, Matese JC, Nitzberg M, Wymore F, Zachariah ZK, Brown PO, Sherlock G (2005) The Stanford Microarray Database accommodates additional microarray platforms and data formats. Nucleic Acids Res 33: D580–D582 [DOI] [PMC free article] [PubMed] [Google Scholar]
- Birrell GW, Giaever G, Chu AM, Davis RW, Brown JM (2001) A genome-wide screen in Saccharomyces cerevisiae for genes affecting UV radiation sensitivity. Proc Natl Acad Sci USA 98: 12608–12613 [DOI] [PMC free article] [PubMed] [Google Scholar]
- Boyle EI, Weng S, Gollub J, Jin H, Botstein D, Cherry JM, Sherlock G (2004) GO:TermFinder—open source software for accessing gene ontology information and finding significantly enriched gene ontology terms associated with a list of genes. Bioinformatics 20: 3710–3715 [DOI] [PMC free article] [PubMed] [Google Scholar]
- Brachat S, Dietrich FS, Voegeli S, Zhang Z, Stuart L, Lerch A, Gates K, Gaffney T, Philippsen P (2003) Reinvestigation of the Saccharomyces cerevisiae genome annotation by comparison to the genome of a related fungus: Ashbya gossypii . Genome Biol 4: R45 [DOI] [PMC free article] [PubMed] [Google Scholar]
- Breitkreutz BJ, Stark C, Tyers M (2003) The GRID: the general repository for interaction datasets. Genome Biol 4: R23 [DOI] [PMC free article] [PubMed] [Google Scholar]
- Cadet J, Sage E, Douki T (2005) Ultraviolet radiation-mediated damage to cellular DNA. Mutat Res 571: 3–17 [DOI] [PubMed] [Google Scholar]
- Game JC, Birrell GW, Brown JA, Shibata T, Baccari C, Chu AM, Williamson MS, Brown JM (2003) Use of a genome-wide approach to identify new genes that control resistance of Saccharomyces cerevisiae to ionizing radiation. Radiat Res 160: 14–24 [DOI] [PubMed] [Google Scholar]
- Gasch AP, Huang M, Metzner S, Botstein D, Elledge SJ, Brown PO (2001) Genomic expression responses to DNA-damaging agents and the regulatory role of the yeast ATR homolog Mec1p. Mol Biol Cell 12: 2987–3003 [DOI] [PMC free article] [PubMed] [Google Scholar]
- Gasch AP, Spellman PT, Kao CM, Carmel-Harel O, Eisen MB, Storz G, Botstein D, Brown PO (2000) Genomic expression programs in the response of yeast cells to environmental changes. Mol Biol Cell 11: 4241–4257 [DOI] [PMC free article] [PubMed] [Google Scholar]
- Giaever G, Chu AM, Ni L, Connelly C, Riles L, Veronneau S, Dow S, Lucau-Danila A, Anderson K, Andre B, Arkin AP, Astromoff A, El-Bakkoury M, Bangham R, Benito R, Brachat S, Campanaro S, Curtiss M, Davis K, Deutschbauer A, Entian KD, Flaherty P, Foury F, Garfinkel DJ, Gerstein M, Gotte D, Guldener U, Hegemann JH, Hempel S, Herman Z, Jaramillo DF, Kelly DE, Kelly SL, Kotter P, LaBonte D, Lamb DC, Lan N, Liang H, Liao H, Liu L, Luo C, Lussier M, Mao R, Menard P, Ooi SL, Revuelta JL, Roberts CJ, Rose M, Ross-Macdonald P, Scherens B, Schimmack G, Shafer B, Shoemaker DD, Sookhai-Mahadeo S, Storms RK, Strathern JN, Valle G, Voet M, Volckaert G, Wang CY, Ward TR, Wilhelmy J, Winzeler EA, Yang Y, Yen G, Youngman E, Yu K, Bussey H, Boeke JD, Snyder M, Philippsen P, Davis RW, Johnston M (2002) Functional profiling of the Saccharomyces cerevisiae genome. Nature 418: 387–391 [DOI] [PubMed] [Google Scholar]
- Guthrie C, Fink GR (eds) (1991) Guide to Yeast Genetics and Molecular Biology. San Diego: Academic Press Inc [Google Scholar]
- Haugen AC, Kelley R, Collins JB, Tucker CJ, Deng C, Afshari CA, Brown JM, Ideker T, Van Houten B (2004) Integrating phenotypic and expression profiles to map arsenic-response networks. Genome Biol 5: R95 (Epub Nov 29) [DOI] [PMC free article] [PubMed] [Google Scholar]
- Hughes TR, Marton MJ, Jones AR, Roberts CJ, Stoughton R, Armour CD, Bennett HA, Coffey E, Dai H, He YD, Kidd MJ, King AM, Meyer MR, Slade D, Lum PY, Stepaniants SB, Shoemaker DD, Gachotte D, Chakraburtty K, Simon J, Bard M, Friend SH (2000) Functional discovery via a compendium of expression profiles. Cell 102: 109–126 [DOI] [PubMed] [Google Scholar]
- Lee I, Date SV, Adai AT, Marcotte EM (2004) A probabilistic functional network of yeast genes. Science 306: 1555–1558 [DOI] [PubMed] [Google Scholar]
- Lee W, St Onge RP, Proctor M, Flaherty P, Jordan MI, Arkin AP, Davis RW, Nislow C, Giaever G, Snyder M (2005) Genome-wide requirements for resistance to functionally distinct DNA-damaging agents. PLoS Genet 1: e24 [DOI] [PMC free article] [PubMed] [Google Scholar]
- Peters KB, Brown JM (2002) Tirapazamine: a hypoxia-activated topoisomerase II poison. Cancer Res 62: 5248–5253 [PubMed] [Google Scholar]
- Scherens B, Goffeau A (2004) The uses of genome-wide yeast mutant collections. Genome Biol 5: 229.221–229.228. [DOI] [PMC free article] [PubMed] [Google Scholar]
- Tong AH, Lesage G, Bader GD, Ding H, Xu H, Xin X, Young J, Berriz GF, Brost RL, Chang M, Chen Y, Cheng X, Chua G, Friesen H, Goldberg DS, Haynes J, Humphries C, He G, Hussein S, Ke L, Krogan N, Li Z, Levinson JN, Lu H, Menard P, Munyana C, Parsons AB, Ryan O, Tonikian R, Roberts T, Sdicu AM, Shapiro J, Sheikh B, Suter B, Wong SL, Zhang LV, Zhu H, Burd CG, Munro S, Sander C, Rine J, Greenblatt J, Peter M, Bretscher A, Bell G, Roth FP, Brown GW, Andrews B, Bussey H, Boone C (2004) Global mapping of the yeast genetic interaction network. Science 303: 808–813 [DOI] [PubMed] [Google Scholar]
- Troyanskaya OG, Dolinski K, Owen AB, Altman RB, Botstein D (2003) A Bayesian framework for combining heterogeneous data sources for gene function prediction (in Saccharomyces cerevisiae). Proc Natl Acad Sci USA 100: 8348–8353 [DOI] [PMC free article] [PubMed] [Google Scholar]
- von Mering C, Krause R, Snel B, Cornell M, Oliver SG, Fields S, Bork P (2002) Comparative assessment of large-scale data sets of protein–protein interactions. Nature 417: 399–403 [DOI] [PubMed] [Google Scholar]
- Wingender E, Chen X, Hehl R, Karas H, Liebich I, Matys V, Meinhardt T, Prèuss M, Reuter I, Schacherer F (2000) TRANSFAC: an integrated system for gene expression regulation. Nucleic Acids Res 28: 316–319 [DOI] [PMC free article] [PubMed] [Google Scholar]
- Winzeler EA, Shoemaker DD, Astromoff A, Liang H, Anderson K, Andre B, Bangham R, Benito R, Boeke JD, Bussey H, Chu AM, Connelly C, Davis K, Dietrich F, Dow SW, El Bakkoury M, Foury F, Friend SH, Gentalen E, Giaever G, Hegemann JH, Jones T, Laub M, Liao H, Liebundguth N, Lockhart DJ, Lucau-Danila A, Lussier M, M'Rabet N, Menard P, Mittmann M, Pai C, Rebischung C, Revuelta JL, Riles L, Roberts CJ, Ross-MacDonald P, Scherens B, Snyder M, Sookhai-Mahadeo S, Stroms RK, Veronneau S, Voet M, Volckaert G, Ward TR, Wysocki R, Yen GS, Yu K, Zimmermann K, Philippsen P, Johnston M, Davis RW (1999) Functional characterization of the S. cerevisiae genome by gene deletion and parallel analysis. Science 285: 901–906 [DOI] [PubMed] [Google Scholar]
- Wu HI, Brown JA, Dorie MJ, Lazzeroni L, Brown JM (2004) Genome-wide identification of genes conferring resistance to the anticancer agents cisplatin, oxaliplatin, and mitomycin C. Cancer Res 64: 3940–3948 [DOI] [PubMed] [Google Scholar]
- Zhou BB, Elledge SJ (2000) The DNA damage response: putting checkpoints in perspective. Nature 408: 433–439 [DOI] [PubMed] [Google Scholar]
- Zhu J, Zhang MQ (1999) SCPD: a promoter database of the yeast Saccharomyces cerevisiae . Bioinformatics 15: 607–611 [DOI] [PubMed] [Google Scholar]
Associated Data
This section collects any data citations, data availability statements, or supplementary materials included in this article.
Supplementary Materials
Supplementary Information I
Supplementary Information II