

Abstract
As one of the most recent members of the omics family, large-scale quantitative metabolomics data are currently complementing our systems biology data pool and offer the chance to integrate the metabolite level into the functional analysis of cellular networks. Network-embedded thermodynamic analysis (NET analysis) is presented as a framework for mechanistic and model-based analysis of these data. By coupling the data to an operating metabolic network via the second law of thermodynamics and the metabolites' Gibbs energies of formation, NET analysis allows inferring functional principles from quantitative metabolite data; for example it identifies reactions that are subject to active allosteric or genetic regulation as exemplified with quantitative metabolite data from Escherichia coli and Saccharomyces cerevisiae. Moreover, the optimization framework of NET analysis was demonstrated to be a valuable tool to systematically investigate data sets for consistency, for the extension of sub-omic metabolome data sets and for resolving intracompartmental concentrations from cell-averaged metabolome data. Without requiring any kind of kinetic modeling, NET analysis represents a perfectly scalable and unbiased approach to uncover insights from quantitative metabolome data.
Keywords: genome-scale analysis, metabolic regulation, metabolomics, stoichiometric network, thermodynamics
Introduction
Ultimately, systems biology strives to gain a quantitative systems-level understanding of complex and highly inter-related cellular processes and phenomena. The various interactions between the cellular domains and the mere number of the components involved, however, represent a complexity beyond intuitive comprehension. For this reason, mathematical models are required as tools to integrate the ever increasing biological knowledge and the data originating from the diverse cellular domains and, in a further step, to infer novel insight from the integrated available knowledge and data (Kitano, 2002; Stelling, 2004).
In order to fully exploit the wealth of information contained in genome-scale data, the mathematical model to be used to extract insight from the data should ideally have the same dimensionality. Unfortunately, the only existing class of genome-scale models are stoichiometric models (Borodina and Nielsen, 2005), whose development was pioneered by Palsson (Reed and Palsson, 2003). As these models only reflect the metabolic capabilities of an organism, today's basis for model-based mechanistic integration and analysis of genome-scale data is rather limited.
Nevertheless, already the stoichiometric models were demonstrated to be valuable tools for integration and analysis of a number of different omics data sets, such as fluxome data (Blank et al, 2005), high-throughput growth phenotyping data (Covert et al, 2004) and transcriptome data (Covert et al, 2004; Patil and Nielsen, 2005). Owing to the development of affordable and powerful mass spectrometers, large-scale sets of quantitative metabolite data are currently emerging into the area of systems biology (Goodacre et al, 2004; Nielsen and Oliver, 2005), and it is desired to also integrate these data in order to infer novel insight (Stitt and Fernie, 2003; Sato et al, 2004; Nielsen and Oliver, 2005).
A natural approach for model-based analysis of metabolome data would be the extension of stoichiometric models by kinetic rate expressions for each enzymatic reaction. However, there is no comprehensive knowledge about in vivo reaction mechanisms and parameters. In addition, the continuing challenges in the area of measurement (Lafaye et al, 2005; Wu et al, 2005) and computational analysis (Voit et al, 2005) make it very unlikely that large-scale kinetic models will be available in the near future. For these reasons, large-scale sets of metabolome data cannot yet be assimilated into mathematical models (Nielsen and Oliver, 2005). Consequently, insight, for instance into underlying regulatory mechanisms, can hardly be inferred.
In attempts to deal with the lack of detailed knowledge on parameters and mechanisms, fundamental thermodynamic principles have been increasingly applied in systems biology and metabolic engineering. In this regard, the second law of thermodynamics was incorporated into stoichiometric models (Beard et al, 2002; Price et al, 2002; Yang et al, 2005) or Gibbs energies of reaction were used to analyze metabolic pathways or small networks (Mavrovouniotis, 1993; Pissarra and Nielsen, 1997; Beard and Qian, 2005; Henry et al, 2006).
In this work, we also draw on these fundamental principles and present a computational thermodynamics-based framework for the analysis of quantitative metabolome data. The mapping of such data onto a stoichiometric reaction network allows extraction of novel insight without requiring any kind of kinetic modeling. In the proposed network-embedded thermodynamic analysis (NET analysis), large-scale qualitative intracellular fluxes (derived from metabolic flux analysis) and metabolite concentrations are coupled to each other via the second law of thermodynamics and the metabolites' Gibbs energies of formation, and an optimization algorithm is employed to compute network-constrained, feasible ranges of Gibbs energies of reaction.
After illustrating the novel concept, first, we will apply the NET analysis tool to a small set of quantitative metabolite data acquired from Escherichia coli to demonstrate the practical application of the optimization framework as a tool (i) for consistency analysis of measured metabolite concentrations, (ii) for prediction of metabolite concentrations beyond the actually taken measurements and (iii) for identification of putative active sites of genetic or allosteric regulation. Then, we analyze a larger data set obtained from Saccharomyces cerevisiae in order to illustrate that the method is also applicable to more complex systems such as organisms with subcellular structures.
Network-embedded thermodynamic analysis
Assuming constant pressure and a closed system, according to the second law of thermodynamics a reaction occurs only in the direction of negative Gibbs energy of reaction, ΔrG. This can be expressed in the inequalities
![]()
where r denotes the reaction rate, or in other words the net flux between metabolites participating in a reaction. Here, a negative reaction rate signifies a flux in backward direction.
The Gibbs energy of a reaction j can be calculated from the Gibbs energies of formation of the participating reactants i, ΔfGi, and the reactants' stoichiometric coefficients in the reaction j, sij,
![]()
In turn, a metabolite's Gibbs energy of formation can be calculated from its standard Gibbs energy and its thermodynamic activity. In biochemistry, thermodynamic activities are typically replaced by molar concentrations, whereas the effect of ionic strength is taken into account by an adequate standard Gibbs energy. Moreover, possible reactant dissociation forms are lumped into a single reactant, and thus transformed Gibbs energies of formation, ΔfGi′, are used, which in turn are calculated from the standard transformed Gibbs energies of formation, ΔfGi′0, and the concentration ci of the particular metabolite i (Alberty, 2003),
![]()
For simplicity, ‘transformed Gibbs energies' will only be referred to as ‘Gibbs energies' in the following.
The presented equations form the foundation for NET analysis. Metabolite concentrations and metabolic fluxes are linked via thermodynamics and the stoichiometric network. The metabolites' Gibbs energies of formation determine, together with the stoichiometry, the Gibbs energies of reaction. These Gibbs energies of reaction and the flux directions are then coupled via the second law of thermodynamics to identify thermodynamically feasible ranges for the Gibbs energies of reaction and for concentrations of non-measured metabolites. Figure 1 provides an illustration of the input data required for NET analysis (i.e. metabolite concentrations, flux directions, a metabolic network model and Gibbs energies of formation) and the various insights, which can be obtained.
Figure 1.

Illustration of the network-embedded thermodynamic analysis (NET analysis). a, b and c denote alternatives, white and grey boxes are actions and inputs, respectively, and ellipses indicate outputs.
In the NET analysis, as an extension to an earlier employed method (Mavrovouniotis, 1993; Pissarra and Nielsen, 1997; Stephanopoulos et al, 1998), the Gibbs energies of reaction are constrained by the mutual thermodynamic interdependencies of reactions in a network (i.e. the reactions' simultaneous action in the network). This way metabolite concentrations have to be feasible not only in view of one specific reaction but with respect to the functioning of the entire network (cf. Figure 2). As we will show below, this significantly limits the feasible ranges of Gibbs energies of reaction and therefore also the feasible concentration ranges of unmeasured metabolites.
Figure 2.

Illustration of the mutual thermodynamic interdependencies of reactions in a network. The presented sample network comprises the reactants A, B, C and D, for which only ranges of concentrations are known. Possible ranges for the reactants' Gibbs energies of formation, taking into account only these concentration ranges, are shown with confined vertical bars. Owing to the provided flux directions and the cooperative action of the reactions in the network, however, the thermodynamically feasible ranges are smaller, which is highlighted by the bold parts of the bars. A flux can only flow from a higher to a lower level of Gibbs energy of formation. Thus, the planes indicating the lower and upper bounds of the thermodynamically feasible Gibbs energies of formation are not allowed to incline against the direction of the flow. The space between the displayed planes, which is defined by the thermodynamic and network-derived constraints (equations (1), 2 and (3)), consists of the thermodynamically feasible Gibbs energies of formation and, thus, describes the feasible concentration space.
In the following, we will outline the optimization procedure that underlies the NET analysis. The optimization determines the feasible range (i.e. upper and lower bounds) of the Gibbs energy of a particular reaction k, ΔrGk′, using metabolite concentrations, reaction directionalities, a metabolic network and thermodynamic data:

In this optimization, the Gibbs energy for the reaction k is minimized and maximized under the following constraints: All reactions j in the network (including the considered reaction k) can only proceed in the direction of a negative Gibbs energy of reaction (equations 4(a) and (b)). In turn, the Gibbs energies of reaction are determined by the reaction stoichiometries and the reactants' Gibbs energies of formation (equation (4c)), which are a function of the predetermined standard Gibbs energies of formation and the metabolite concentrations (equation (4d)). The latter are by default constrained to typical intracellular concentration ranges (see Materials and methods). These ranges should be defined cautiously such that they surely cover the possible variation in concentration under the considered experimental conditions. Measured concentration values are also considered with these constraints, which, owing to the fact that measurement uncertainties cannot be excluded, are typically allowed to vary by 10% around the measured values.
With an analogous procedure, we can determine feasible concentration ranges rather than Gibbs energies of reaction.
As mentioned above, a prerequisite for the NET analysis is the knowledge of the directions of intracellular fluxes (cf. Figure 1). These can either be defined based on preexisting knowledge (a), determined from experimental data (b), or (in case experimental flux data are not available) computed using flux balance analysis (FBA) (c). FBA employs linear programming to optimize a suitable cellular objective, while assuming steady state for the mass balances (Kauffman et al, 2003; Price et al, 2003).
In the context of assigning flux directions, it is important to note that one does not necessarily need to provide directions for all fluxes. If in doubt about a certain flux, no direction should be assigned to the particular reaction. In consequence, fewer constraints are imposed on the NET analysis optimization. This results in a larger solution space meaning that the computed ranges of feasible Gibbs energies of reaction and concentrations eventually become wider. Thus, neglecting a reaction can only lead to less insight from the measurement data but in no case will such an omission lead to wrong results. The same holds true for missing or unknown pathways: If a pathway is not considered, also only less insight is obtained.
Results
In the following, to first demonstrate the type of results that can be obtained from our method, we will analyze a set of measured metabolite concentrations from E. coli as a representative from the prokaryotic domain. After having approved the method for the simple test case, we demonstrate its general applicability on a larger data set from S. cerevisiae.
Before presenting the actual results, the effect of embedding the reactions into the metabolic network is illustrated for the analyzed E. coli data. Possible ranges of Gibbs energies of reaction, only defined by the concentrations of the participating reactants, were compared to the thermodynamically feasible ranges calculated using the NET analysis. A comparison of the two ranges is shown in Figure 3 for several reactions. From this figure, it can be seen that only small parts of the concentration-defined ranges are feasible, when also considering the operation of the reaction network.
Figure 3.

Ranges of Gibbs energies of reaction with and without considering the respective reaction's operation in the metabolic network. White bars indicate possible ranges due to the provided concentration ranges (see Materials and methods), whereas the black bars display thermodynamically feasible ranges after introducing the constraints of the reaction network. Abbreviations: me(NADH), malic enzyme (NADH dependent); pdh, pyruvate dehydrogenase; nadk, NAD kinase; akgdh, α-ketoglutarate dehydrogenase; cs, citrate synthase; udh, cytosolic transhydrogenase; atps, ATPase; fba, fructosebisphosphate aldolase; me(NADPH), malic enzyme (NADPH dependent); mdh, malate dehydrogenase; rpi, ribosephosphate isomerase; pgk, phosphoglycerate kinase; gapd, glyceraldehyde 3-phosphate dehydrogenase; tpi, triosephosphate isomerase; pgm, phosphoglycerate mutase; eno, enolase.
For example, the reactions pgk, gapd, pgm, eno, rpi and tpi are restricted to a range of Gibbs energy of reaction close to zero when the network operation is taken into account. The reactions udh and fba do not operate at equilibrium. Had these two reactions been analyzed separately from the network, the employed concentration limits would have allowed for that. These examples demonstrate that in cases where only a limited set of metabolite concentrations is available, the NET analysis-based integration of the reactions leads to narrower feasible ranges of Gibbs energies of reaction, and thus to a more precise classification of the reactions.
Thermodynamic consistency of metabolome data
Despite the recent tremendous advances in mass spectrometry, small dynamic ranges of these instruments and effects such as ion suppression still impose serious difficulties on reliable quantification, and consequently quantitative metabolomics still requires sophisticated means to circumvent these problems (Lafaye et al, 2005; Wu et al, 2005). Testing for thermodynamic feasibility of a data set can constitute a part of the necessary assessment of a measurement's reliability.
Thermodynamically feasible sets of measured concentrations are a prerequisite for the NET analysis, as the measured concentrations need to allow for negative Gibbs energies of reaction for each preset flux, so that a solution for the optimization problem (equation (4)) exists. Here, we demonstrate that NET analysis can indeed be used as a tool to determine thermodynamic consistency of the data.
For the E. coli data set we analyzed, consistency was approved. In contrast, employing the NET analysis to other published quantitative E. coli metabolome data, we found that out of seven available data sets, only four were thermodynamically feasible (Lowry et al, 1971; Emmerling et al, 1999; Peng et al, 2004; Siddiquee et al, 2004). In case a data set is classified as infeasible, it is furthermore possible to identify the erroneous concentration combinations by systematically omitting measured concentrations from the data set until a feasible solution for the optimization problem is established. The measured adenylate energy charge and NADH/NAD+ ratio of the data set in Buchholz et al (2001) lay outside physiological ranges (Penfound and Foster, 1996; Berg et al, 2003). The NET analysis revealed further that in two of the three infeasible cases, flux through glycolysis was inhibited by too high an F6P/G6P ratio (explanations for the metabolite abbreviations are provided in the legend of Figure 4) (Buchholz et al, 2001) and by too high a PEP/F16P ratio (overarching the lower part of glycolysis) (Chassagnole et al, 2002). For the last one (Hoque et al, 2005), the OXA/MAL, the G3P/DHAP and the R5P/RU5P ratios were too high, so that the measurements were not consistent with the assumed fluxes through the tricarboxylic acid cycle, glycolysis and pentose phosphate pathway.
Figure 4.

NET analysis of the E. coli metabolome data (Schaub et al, 2006). Abbreviations: pgi, glucose 6-phosphate isomerase; pfk, phosphofructose kinase; pyk, pyruvate kinase; g6pdh, glucose 6-phosphate dehydrogenase; pgl, phosphogluconolactonase; gnd, phosphogluconate dehydrogenase; rpe, ribulosephosphate epimerase; tkt1, transketolase; tkt2, transketolase; tala, transaldolase; edd, phosphogluconate dehydratase; eda, phosphogluconate aldolase; acont, acontinase; icdh, isocitrate de-hydrogenase; succoas, succinyl-CoA synthase; sucdh, succinate dehydrogenase; fum, fumerase; icl, isocitrate lyase; mals, malate synthase; ppc, phosphoenolpyruvate carboxylase; ppck, phosphoenolpyruvate carboxykinase; pgmt, phosphoglucomutase; g3pd, glycerol 3-phosphate dehydrogenase; pgcd, phosphoglycerate dehydrogenase; sulr, sulfite reductase; G6P, glucose 6-phosphate; F6P, fructose 6-phosphate; F16P, fructose 1,6-bisphosphate; DHAP, dihydroxyacetone phosphate; G3P, glyceraldehyde 3-phosphate; 13DPG, 1,3-diphosphoglycerate; 3PG, 3-phosphoglycerate; 2PG, 2-phosphoglycerate; PEP, phosphoenolpyruvate; PYR, pyruvate; 6PGL, 6-phosphogluconolactone; 6PGC, 6-phosphogluconate; RU5P, ribulose 5-phosphate; R5P, ribose 5-phosphate; X5P, xylulose 5-phosphate; S7P, seduheptulose 7-phosphate; E4P, erythrose 4-phosphate; 2DDG6P, dehydrodeoxy-6-phosphogluconate; ACCOA, acetyl-CoA; CIT, citrate; ICIT, isocitrate; AKG, α-ketogluterate; SUCCOA, succinyl-CoA; SUCC, succinate; FUM, fumerate; MAL, malate; OXA, oxaloacetate; G1P, glucose 1-phosphate; GLYC3P, glycerol 3-phosphate; 3PHP, 3-phosphohydroxypyruvate; SO32−, sulfide; H2S, hydrogen sulfide. (Summation of the inferred concentration ranges of the pooled metabolites (e.g. 2PG and 3PG) can exceed the actually measured (pooled) concentration of these metabolites. The reason for this is the introduced uncertainty in the measured concentrations of these pooled metabolites (in order to account for potential measurement uncertainties).)
Quantitative metabolome data are now used in the area of mathematical modeling. Thus, it is important that only quantitatively correct data sets are employed in these endeavors in order to prevent erroneous conclusions. For these reasons, also the Yeast Systems Biology Network working group (http://www.ysbn.org) recently stated that it would be desirable to have a tool for quality control check that is easily applicable to quantitative metabolome data sets before their actual use in modeling efforts or their entry into databases. Owing to its inherent control of thermodynamic feasibility, NET analysis can fulfill parts of the quality control check.
It is important to note that unknown pathways missing in the used metabolic network model as well as unknown and thus not specified flux directions, or unavailable thermodynamic data for certain metabolites will never render a data set infeasible, and thus NET analysis is rather conservative. Further, thermodynamic feasibility is only a necessary but not a sufficient condition for correct quantification of metabolite concentrations. However, NET analysis as an easy-to-apply tool can test for major experimental errors, while relying only on indisputable (i.e. thermodynamic) facts.
Prediction of metabolite concentrations
In a next step, we tested whether NET analysis can also be used to predict concentrations of unmeasured metabolites. In the E. coli data set we analyzed, besides a few actually measured metabolites, the measurements provided only pooled concentrations of the isobaric molecules F6P/G6P, DHAP/G3P, 3PG/2PG and R5P/RU5P/X5P. With the NET analysis, however, it was possible to specify the concentrations of the individual metabolites (see Figure 4). Furthermore, narrow concentration ranges for the unmeasured metabolites 13DPG, 3PHP and AMP could also be calculated.
This demonstrates that it is indeed possible to use the NET analysis to specify narrow concentration ranges for unmeasured metabolites. This kind of prediction is particularly useful for metabolites that are difficult to resolve experimentally (such as isobaric molecules). Instead of putting efforts into experimental resolution, this could also be achieved by a subsequent NET analysis. As we will show below with the S. cerevisiae data set, in a similar manner NET analysis is even able to resolve compartmental concentrations from cell-averaged metabolome data.
Prediction of potential active regulatory sites
Measured metabolite concentrations alone hardly provide any insights into the organization of metabolism, that is, the regulatory structure responsible for routing of matter via the different metabolic pathways, the result of which is a certain intracellular flux distribution. A flux distribution is established by the fact that in comparison with the neighboring reactions, the rates of some reactions are limited by the available catalytic activity (either owing to low enzyme concentration or activity), so that at branch points, mass flux is accordingly distributed into the possible pathways. A limited catalytic activity of a reaction manifests itself in a large Gibbs energy of reaction. By the NET analysis, such reactions can be identified even on the basis of incomplete metabolome data via the consideration of flux directions and of the simultaneous action of the reactions in the network.
The relationship between the thermodynamic operational mode of a reaction (far from or close to equilibrium) and its regulation was established in the area of metabolic flux control analysis: Reactions operating near equilibrium usually have a large sensitivity of the reaction rate towards variations in metabolite concentrations, and thus, such reactions have a small determining effect on the flux through the respective pathway (Nielsen, 1997; Visser et al, 2004). On the other hand, reactions with large values of Gibbs energy of reaction do not necessarily have an impact on flux control, as also other parameters of the enzymatic rate expressions are influencing the flux. However, it was found that reactions operating far from equilibrium are more likely to impose flux control (Wang et al, 2004), and it is assumed that the corresponding enzymes are more likely to be regulated by the cell (Crabtree et al, 1997) as only in these cases flux and thus phenotype can be affected.
The NET analysis, using the E. coli metabolome data, classified reactions under the applied experimental conditions whether they are potential active regulatory sites or not (Figure 4). A first look at these results reveals that the pfk and pyk reactions are operating far from equilibrium and thus may represent regulatory enzymes of glycolysis, whereas most other glycolytic reactions display only small absolute Gibbs energies of reaction. As this assignment of regulatory enzymes is in perfect agreement with earlier studies (for a review see Romeo and Snoep, 2005) and as also most of the other findings displayed in Figure 4 comply with our current knowledge (cf. discussion in Supplementary information 4), this indicates that NET analysis of metabolome data is indeed able to provide correct regulatory insight.
Another finding obtained from the E. coli data is related to E. coli's cytoplasmic transhydrogenase (udh): in glucose-limited continuous cultivations, compared to the biosynthetic demands, an excess of NADPH is produced (Nanchen et al, 2006). In order to eliminate the excess NADPH, the udh-transhydrogenase converts NADPH into NADH. As revealed by NET analysis, the udh reaction operates far from equilibrium in the considered experiment signifying that this reaction may be subject to regulation (Figure 4). By a sensitivity analysis, we found that a regulatory control of the udh-transhydrogenase is indeed required for physiological reasons: further equilibration of the udh reactants, corresponding to a shift of the NAD(H) pool to the reduced state, would render the normal operation of some catabolic (i.e. NAD-dependent) dehydrogenases infeasible. Of the reactions considered in this work, glyceraldehyde 3-phosphate dehydrogenase is the most critical, because the conversion of G3P to 13DPG would stop at NADH/NAD+ ratios above 0.018.
The identification of the regulatory action being effective on the udh-transhydrogenase and of its underlying design principle underpins the value and power of the NET analysis in uncovering system properties. First, only by using the NET analysis-based sensitivity studies, it was possible to classify the udh reaction as operating far from equilibrium (cf. Figure 3). Second, with NET analysis, we were able to uncover the reasons underlying the active udh regulation: they root in reaction interdependencies that overarch various parts of metabolism. Both findings could not have been obtained by solely considering the available metabolite concentrations.
General applicability of NET analysis
So far, the conceptual idea and application of the NET analysis was demonstrated for E. coli as a simple prokaryote. In a next step, we wanted to test the method's applicability to more complex systems such as eukaryotes with subcellular structures. For this, we extended the method and analyzed the largest available set of quantitative data from S. cerevisiae (Mashego et al, 2005).
First, using NET analysis, we could ascertain the thermodynamic feasibility of the measured metabolite data. Also with this data set, based on the computed feasible Gibbs energies of reaction, reactions in central carbon metabolism (e.g. pfk, icl or pdh) or the first steps in amino-acid synthesis (e.g. asparagine transaminase or asparagine synthase) could be identified as potential active regulatory sites (cf. Supplementary information 5). Interestingly, NET analysis was even able to resolve compartmental differences: in contrast to mitochondria, the production of oxaloacetate via malate dehydrogenase and aspartate transaminase is thermodynamically infeasible in the cytosol as here the reactions display positive Gibbs energies of reaction (cf. Supplementary information 5). Obviously, these reactions are only needed under different environmental conditions.
An inherent problem with all current omics analyses of higher (i.e. compartmentalized) organisms is that the data obtained only represent averages over the whole cell. Several scientific questions, however, can be envisioned, for which a subcellular resolution of the data would be advantageous. Here, NET analysis was revealed to be a tool that is able to infer subcellular metabolite concentrations from cell-averaged metabolite data, as it draws on additional information on compartmentialized metabolic network topology and flux distribution. Examples for subcellular metabolite concentrations resolved from the present yeast data are given in Table I. These values demonstrate the power of NET analysis in inferring insight by an elegant, thermodynamics-based integration of data.
Table 1.
Resolved intracompartmental metabolite concentrations for the S. cerevisiae data
| Metabolite | Cytosol (mM) | Mitochondria (mM) |
|---|---|---|
| L-Aspartate | 9.1–10 | <0.07 |
| Fumarate | <0.23 | >0.3 |
| L-Malate | <1.6 | 1.56–7.15 |
| Oxaloacetatea | >1.56 | <0.004 |
| Phosphoenolpyruvate | 2.21–4.21 | >3 |
| Pyruvate | 0.27–0.35 | <0.07 |
| L-Threoninea | 0.004–2.1 | <0.23 |
Non-measured; for others, a cell-averaged measurement value was available.
Finally, we will demonstrate that NET analysis of metabolome data can also assist in comprehensively analyzing functional relationships in S. cerevisiae's metabolism that range over different compartments. NADH metabolism in yeast is separated between the cytosol and mitochondria: NADH produced in the cytosol (e.g. in glycolysis) has to be reoxidized via the respiratory chain situated in the mitochondrial membrane. As pyrimidine nucleotides cannot cross this membrane, yeast can use an NADH:ubiquinone oxidoreductase external to the mitochondrial membrane to reoxidize its cytosolic NADH. Alternatively, yeast has several redox shuttle systems, which, by means of other metabolites, virtually transfer the protons into the mitochondria for subsequent oxidation (Bakker et al, 2001; Rigoulet et al, 2004). To date, the true physiological role of these shuttle pathways is not fully understood and thus still a subject of current research (Påhlman et al, 2002; Cavero et al, 2003). In this context, it was recently stated that here indeed the resolution of compartmental concentrations could provide insight as whole-cell analyses are unable to contribute to an understanding of these processes, which, in total, have the same net outcome (Bakker et al, 2001).
To investigate whether the four known shuttles (Bakker et al, 2001) and the external NADH:ubiquinone oxidoreductase can be operational under the considered experimental conditions, we tested each of these options for their thermodynamic feasibility. On the basis of the present S. cerevisiae metabolite data set, NET analysis revealed that under the respective experimental conditions, NADH reoxidation can only occur via the external NADH:ubiquinone oxidoreductase or the glycerol 3-phosphate shuttle whereas the other three shuttles (ethanol–acetaldehyde shuttle, malate–oxaloacetate shuttle, malate–aspartate shuttle) cannot be operative for thermodynymic reasons. Through laborious experimental efforts employing a series of gene knockout studies, it was found that here the external NADH:ubiquinone oxidoreductase reoxidizes the cytosolic NADH (Rigoulet et al, 2004). As demonstrated, by employing a compartmentalized metabolic network model, NET analysis is able to uncover functional relationships from metabolome data that are related to compartmentation and which otherwise can only be obtained by elaborate experimental efforts.
Discussion
To gain insight from large-scale quantitative metabolome data, a coupling to mechanistic models is required. Integration with kinetic models will most likely remain a major challenge for at least the near future. Consequently, we present a new methodology that does not require the derivation of sophisticated model structures but rather applies fundamental physical laws to the interpretation of quantitative metabolite data sets: the framework of the NET analysis maps metabolome data to the stoichiometric network via thermodynamics and metabolic fluxes. Insight can be obtained from even limited data sets.
NET analysis is designed for the analysis of quantitative metabolome data, as the optimization requires quantitative concentrations (in terms of mmol/l) as input, and thus the application is limited to respective data sets. Beyond, employing NET analysis further requires a (i) metabolic network model, (ii) flux directions that reflect the metabolic state of the organism under the analyzed experimental conditions and (iii) the Gibbs energies of formation for a large number of metabolites. It is important to note that pathways missing in the metabolic network model, not completely defined flux directions, and incomplete thermodynamic information do not lead to wrong conclusions but only limit the extent of insight that can be drawn from NET analysis. In essence, incorrect conclusions can be avoided if solely assured information is employed for NET analysis. As shown in this work, NET analysis is not restricted to data from simple organisms but can also be applied to data from more complex systems such as organisms with subcellular structure.
In the NET analysis, the measurement data first undergo a validation of thermodynamic feasibility. The necessity for such a quality control is stressed by the fact that approximately 40% of the analyzed data sets of E. coli metabolite concentrations originating from various research groups were found to be infeasible. Actually, this percentage is even more dramatic considering that thermodynamic feasibility is only a necessary, but not a sufficient condition for correct data. As the number of metabolites quantified from a single experiment will constantly increase in the future and the metabolic reactions are highly interconnected, however, the chance to uncover thermodynamic infeasibility will increase. The NET analysis can be used as an easy-to-apply tool to test metabolome data for major experimental errors.
The ability of NET analysis to computationally resolve intracompartmental metabolite concentrations, which in general are hardly accessable experimentally, allows a more detailed view of an organism with subcellular structure. This capability opens up the possibility to elucidate cellular functionalities that rely on compartmentation. Furthermore, the NET analysis-based resolution of pooled metabolite concentrations enables the design of more efficient analytical methods as certain pooled metabolites do not have to be separated experimentally.
The most prominent feature of NET analysis, however, is the ability to decode valuable insights from metabolome data: besides unraveling functional relationships overarching several parts of metabolism, NET analysis is able to identify reactions most likely to be subject to active allosteric or genetic regulation on the basis of metabolome data representing a physiological snapshot at the final level in cellular hierarchy. In this context, NET analysis could be particularly helpful for screening of high-throughput metabolome data acquired from, for example, libraries of single-ORF deletion mutants for reactions, upon which the cell exerts either genetic or allosteric regulatory action under the considered experimental conditions. We envision that the superposition of this NET analysis-derived information obtained from different mutant strains should ultimately facilitate identification of novel inter-relationships in metabolic regulation. Such regulatory insight would tremendously enhance our knowledge about the regulation of metabolic pathways, where, in stark contrast to the regulation of genes encoding enzymes used to introduce specific substrates into the central metabolism, only little is known.
In contrast to detailed kinetic models, the NET analysis does not provide deterministic statements. However, as it is easy to apply, perfectly scalable to the systems level and only relies on indisputable facts, it represents a valuable tool to computationally decipher insight from quantitative large-scale metabolome data. It can be easily envisioned that it will significantly assist systems biology research and also will support more applied fields such as metabolic engineering.
Materials and methods
Stoichiometric models
For the E. coli data set, we employed the genome-scale model iJR904 developed by Palsson and co-workers (Reed et al, 2003), which is an elementally balanced stoichiometric network. The fully compartmentalized, elementally and charge balanced model iND750 (Duarte et al, 2004) was employed to analyze the set of metabolite concentrations from S. cerevisiae. For our studies on the redox shuttles, transport reactions between cytosol and mitochondria were added according to Bakker et al (2001).
Thermodynamic data
A prerequisite for the NET analysis is the availability of standard Gibbs energies of formation for a large number of metabolites. With these and values for intracellular pH and ionic strength (see below), standard transformed Gibbs energies of formation specific for intracellular conditions were calculated using the software Mathematica (Wolfram Research Inc., IL, USA) and a Mathematica notebook provided at http://library.wolfram.com/infocenter/MathSource/797 (Alberty, 2003). Standard transformed Gibbs energies of formation for the metabolites involved in the pentose phosphate pathway and the shikimate pathway were added by drawing on data from the NIST database on thermodynamics of enzyme-catalyzed reactions (http://xpdb.nist.gov/enzyme_thermodynamics) and from the literature (Tewari et al, 2001, 2002).
In order to account for potential errors in the experimentally determined equilibrium constants (from which the transformed Gibbs energies of formation were derived), standard transformed Gibbs energies of formation were allowed to vary in the NET analysis by 0.5 kJ mol−1 around the reported value. Converted to the concentration domain, this represents an uncertainty of approximately 20% for the measured equilibrium concentration of a reactant.
In summary, for 137 of the 761 metabolites in the E. coli model, standard transformed Gibbs energies of formation were available, and consequently, for 154 out of the 922 biochemical reactions in the metabolic model, it was possible to calculate Gibbs energies of reaction. For the S. cerevisiae model, Gibbs energies of reaction could be calculated for 232 (out of 1149) reactions with the available Gibbs energies of formation for 128 (out of 645) metabolites.
Analyzed metabolome data set and input data for E. coli
We examined a set of measured metabolite concentrations (Schaub et al, 2006) obtained from an E. coli (W3110) chemostat culture that was operated at a dilution rate of 0.1 h−1. The culture was fed with M9 minimal medium containing 5 g l−1 glucose. The reactor with a working volume of 1.5 l was aerated with 1 vvm and stirred at 800 r.p.m. in order to ensure a dissolved oxygen concentration above 60%. The concentrations of six metabolites (F13P, PEP, PYR, 6PGL, ADP, ATP) and four groups of pooled metabolites (G6P/F6P, DHAP/G3P, 2PG/3PG, R5P/RU5P/X5P) were measured on an ion-chromatography/single quadrupol mass spectrometer system (Dionex, Thermo Finnigan) following a novel integrated sampling procedure (Schaub et al, 2006).
Owing to the limited number of measured metabolites in the analyzed data set, from a broad literature survey, metabolite data obtained from aerobic E. coli growth experiments on glucose under various conditions (batch, chemostat and substrate pulse experiments) were gathered, and based on these data the concentration ranges of 29 metabolites were further restricted (see Supplementary information 2) assuming that these ranges reflect the typical variance of metabolite homeostasis. In the NET analysis, NAD(H) and NADP(H) were considered with their ratios (NADH/NAD+ and NADPH/NADP+) and the adenylate nucleotides, ATP, ADP and AMP, as adenylate energy charge (AEC, see Supplementary information 1 for definition). Upper and lower bounds for these ratios were also defined based on respective values obtained from the literature survey (see Supplementary information 2). Beyond, the concentrations of all other non-measured metabolites were, by default, restricted to ranges that reflect the typical levels in the cytoplasm, which usually lie within the μM to mM range (Fraenkel, 1992). Thus, for the NET analysis, default minimal and maximal concentration limits were set to 0.001 and 10 mM, respectively.
The standard Gibbs energies of formation were calculated for an intracellular pH of 7.6 (Shimamoto et al, 1994) and an ionic strength of 0.15 M (Voets et al, 1999) to reflect E. coli's intracellular conditions. The energy required for transfer of protons from the cytosol to the extracellular environment (or energy gained in the case of reflux) was estimated using an experimentally determined proton motive force of −150 mV (Riondet et al, 1999). Multiplication of this value with the Faraday constant provided the respective Gibbs energy for proton translocation (−15 kJ mol−1).
Analyzed metabolome data set and input data for S. cerevisiae
Quantified metabolite concentrations of S. cerevisiae CEN.PK 113-7D were obtained from an aerobic, glucose/ethanol-limited chemostat culture at a dilution rate of 0.052 h−1 (Mashego et al, 2005). Measurements were performed for 18 metabolites (AKG, F16P, F6P, FUM, G1P, G6P, GLX (glyoxylate), MAL, PEP, PYR, SUCC, TRE (trehalose), ATP, ADP, AMP, ALA (L-alanine), ASP (L-aspartate), GLU (L-glutamate)) and three groups of pooled metabolites (2PG/3PG, CIT/ICIT, NADH/NAD+) either by mass spectroscopy on an LC-ESI-MS/MS system, by IE-HPLC or enzymatically. We analyzed the metabolite data obtained after eight generation cycles. By default, the measured metabolite concentrations were considered as average concentrations over all intracellular compartments using compartmental volume fractions given in Supplementary information 3. If, however, according to the metabolic model a metabolite could not enter a particular compartment by diffusion and was not participating in any active reaction, its concentration was assumed to be negligible in this compartment under the assumption that available transporters are not expressed. Analogous to the analysis of the E. coli data, default ranges that reflect physiological conditions were set for the non-measured metabolite concentrations, and ratios of pyridine nucleotides and the AEC (see Supplementary information 3).
A cytosolic and mitochondrial pH of 7 and 7.5, respectively, was assumed (JJ Heijnen, personal communication, 2006), whereas an ionic strength of 0.15 M was used. To translocate ions against the mitochondrial membrane potential of −180 mV (Ludovico et al, 2001), the necessary energy was considered in the calculation of the respective Gibbs energies of reaction.
Determination of flux directions
Experimentally determined fluxes for E. coli were obtained from Nanchen et al (2006) and for S. cerevisiae from Daran-Lapujade et al (2004) and Wu et al (2006). To obtain a flux distribution (beyond the actually measured set of fluxes) that we used as input data, we employed the optimization approach introduced by Blank et al (2005):
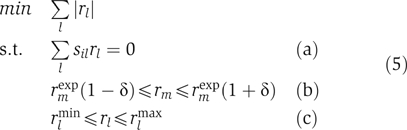
In this optimization, the L1 norm of all fluxes rl (including the intracellular fluxes rj as well as the exchange fluxes with the extracellular environment) is minimized under the constraint that the mass balances hold (equation (5a); sil are the stoichiometric coefficients including those of the intracellular reactions (sij), of the exchange fluxes and of a pseudo-reaction describing biomass synthesis). The fluxes rm, for which experimental data are available, have to lie within a range δ (here, 10%) around the measured values rmexp (equation (5b)). rlmin and rlmax are default flux boundaries defining the reversibility/irreversibility of the intracellular and exchange fluxes (equation (5c)).
Optimization
The optimization problems were solved using LINDO API (LINDO Systems Inc., IL, USA) via the Matlab (The MathWorks Inc., MI, USA) interface. The actual formulations of the optimization procedures employed are presented in Supplementary information 1.
Supplementary Material
Supplementary information 1
Supplementary information 2
Supplementary information 3
Supplementary information 4
Supplementary information 5
Acknowledgments
We thank Matthias Reuss (University of Stuttgart) and Michael Daunes (INSILICO biotechnology) for sharing data before publication and Robert Alberty (MIT), Sef Heijnen (TU Delft), Uwe Sauer (ETH Zurich) and Jörg Stelling (ETH Zurich) for helpful discussions.
References
- Alberty RA (2003) Thermodynamics of Biochemical Reactions. Hoboken, NJ, USA: John Wiley & Sons Inc [Google Scholar]
- Bakker BM, Overkamp KM, van Maris AJ, Kötter P, Luttik MA, van Dijken JP, Pronk JT (2001) Stoichiometry and compartmentation of NADH metabolism in Saccharomyces cerevisiae. FEMS Microbiol Rev 25: 15–37 [DOI] [PubMed] [Google Scholar]
- Beard DA, Liang SD, Qian H (2002) Energy balance for analysis of complex metabolic networks. Biophys J 83: 79–86 [DOI] [PMC free article] [PubMed] [Google Scholar]
- Beard DA, Qian H (2005) Thermodynamic-based computational profiling of cellular regulatory control in hepatocyte metabolism. Am J Physiol Endocrinol Metab 288: 633–644 [DOI] [PubMed] [Google Scholar]
- Berg JM, Tymoczko JL, Stryer L (2003) Biochemistry. New York, NY, USA: WH Freeman and Company [Google Scholar]
- Blank L, Küpfer L, Sauer U (2005) Large-scale 13C-flux analysis reveals mechanistic principles of metabolic network robustness to null mutations in yeast. Genome Biol 6: R49. [DOI] [PMC free article] [PubMed] [Google Scholar]
- Borodina I, Nielsen J (2005) From genomes to in silico cells via metabolic networks. Curr Opin Biotechnol 16: 350–355 [DOI] [PubMed] [Google Scholar]
- Buchholz A, Takors R, Wandrey C (2001) Quantification of intracellular metabolites in Escherichia coli K12 using liquid chromatographic-electrospray ionization tandem mass spectrometric techniques. Anal Biochem 295: 129–137 [DOI] [PubMed] [Google Scholar]
- Cavero S, Vozza A, del Arco A, Palmieri L, Villa A, Blanco E, Runswick MJ, Walker JE, Cerdan S, Palmieri F, Satrustegui J (2003) Identification and metabolic role of the mitochondrial aspartate-glutamate transporter in Saccharomyces cerevisiae. Mol Microbiol 50: 1257–1269 [DOI] [PubMed] [Google Scholar]
- Chassagnole C, Noisommit-Rizzi N, Schmid JW, Mauch K, Reuss M (2002) Dynamic modeling of the central carbon metabolism of Escherichia coli. Biotechnol Bioeng 79: 53–73 [DOI] [PubMed] [Google Scholar]
- Covert MW, Knight EM, Reed JL, Herrgård MJ, Palsson BØ (2004) Integrating high-throughput and computational data elucidates bacterial networks. Nature 429: 92–96 [DOI] [PubMed] [Google Scholar]
- Crabtree B, Newsholme EA, Reppas NB (1997) Principles of regulation and control in biochemistry: a pragmatic, flux-oriented approach. In Handbook of Physiology, Hoffman JF, Jamieson JD (eds) Vol. Section 14: Cell Physiology, pp 117–180. New York, USA: Oxford University Press [Google Scholar]
- Daran-Lapujade P, Jansen ML, Daran JM, van Gulik W, de Winde JH, Pronk JT (2004) Role of transcriptional regulation in controlling fluxes in central carbon metabolism of Saccharomyces cerevisiae. A chemostat culture study. J Biol Chem 279: 9125–9138 [DOI] [PubMed] [Google Scholar]
- Duarte NC, Herrgård MJ, Palsson BØ (2004) Reconstruction and validation of Saccharomyces cerevisiae iND750, a fully compartmentalized genome-scale metabolic model. Genome Res 14: 1298–1309 [DOI] [PMC free article] [PubMed] [Google Scholar]
- Emmerling M, Bailey JE, Sauer U (1999) Glucose catabolism of Escherichia coli strains with increased activity and altered regulation of key glycolytic enzymes. Metab Eng 1: 117–127 [DOI] [PubMed] [Google Scholar]
- Fraenkel DG (1992) Genetics and intermediary metabolism. Annu Rev Genet 26: 159–177 [DOI] [PubMed] [Google Scholar]
- Goodacre R, Vaidyanathan S, Dunn WB, Harrigan GG, Kell DB (2004) Metabolomics by numbers: acquiring and understanding global metabolite data. Trends Biotechnol 22: 245–252 [DOI] [PubMed] [Google Scholar]
- Henry CS, Jankowski MD, Broadbelt LJ, Hatzimanikatis V (2006) Genome-scale thermodynamic analysis of Escherichia coli metabolism. Biophys J 90: 1453–1461 [DOI] [PMC free article] [PubMed] [Google Scholar]
- Hoque MA, Ushiyama H, Tomita M, Shimizu K (2005) Dynamic responses of the intracellular metabolite concentrations of the wild type and pykA mutant Escherichia coli against pulse addition of glucose or NH3 under those limiting continuous cultures. Biochem Eng J 26: 38–49 [Google Scholar]
- Kauffman KJ, Prakash P, Edwards JS (2003) Advances in flux balance analysis. Curr Opin Biotechnol 14: 491–496 [DOI] [PubMed] [Google Scholar]
- Kitano H (2002) Systems biology: a brief overview. Science 295: 1662–1664 [DOI] [PubMed] [Google Scholar]
- Lafaye A, Labarre J, Tabet JC, Ezan E, Junot C (2005) Liquid chromatography–mass spectrometry and 15N metabolic labeling for quantitative metabolic profiling. Anal Chem 77: 2026–2033 [DOI] [PubMed] [Google Scholar]
- Lowry OH, Carter J, Ward JB, Glaser L (1971) Effect of carbon and nitrogen sources on level of metabolic intermediates in Escherichia coli. J Biol Chem 246: 6511–6521 [PubMed] [Google Scholar]
- Ludovico P, Sansonetty F, Côrte-Real M (2001) Assessment of mitochondrial membrane potential in yeast cell populations by flow cytometry. Microbiology 147: 3335–3343 [DOI] [PubMed] [Google Scholar]
- Mashego MR, Jansen ML, Vinke JL, van Gulik WM, Heijnen JJ (2005) Changes in the metabolome of Saccharomyces cerevisiae associated with evolution in aerobic glucose-limited chemostats. FEMS Yeast Res 5: 419–430 [DOI] [PubMed] [Google Scholar]
- Mavrovouniotis ML (1993) Identification of localized and distributed bottlenecks in metabolic pathways. In Proceedings of the 1st Int. Conf. on Intelligent Systems for Molecular Biology, Hunter L, Searls DB, Shavlik JW (eds) pp 275–283. Bethesda, MA: AAAI [PubMed]
- Nanchen A, Schicker A, Sauer U (2006) Nonlinear dependency of intracellular fluxes on growth rate in miniaturized continuous cultures of Escherichia coli. Appl Environ Microbiol 72: 1164–1172 [DOI] [PMC free article] [PubMed] [Google Scholar]
- Nielsen J (1997) Metabolic control analysis of biochemical pathways based on a thermokinetic description of reaction rates. Biochem J 321: 133–138 [DOI] [PMC free article] [PubMed] [Google Scholar]
- Nielsen J, Oliver SG (2005) The next wave in metabolome analysis. Trends Biotechnol 23: 544–546 [DOI] [PubMed] [Google Scholar]
- Påhlman IL, Larsson C, Averét N, Bunoust O, Boubekeur S, Gustafsson L, Rigoulet M (2002) Kinetic regulation of the mitochondrial glycerol-3-phosphate dehydrogenase by the external NADH dehydrogenase in Saccharomyces cerevisiae. J Biol Chem 277: 27991–27995 [DOI] [PubMed] [Google Scholar]
- Patil KR, Nielsen J (2005) Uncovering transcriptional regulation of metabolism by using metabolic network topology. Proc Natl Acad Sci USA 102: 2685–2689 [DOI] [PMC free article] [PubMed] [Google Scholar]
- Penfound T, Foster JW (1996) Biosynthesis and recycling of NAD. In Escherichia coli and Salmonella: Cellular and Molecular Biology, Neidhardt FC, Curtiss III R, Ingraham JL, Lin ECC, Low KB, Magasanik B, Reznikoff WS, Riley M, Schaechter M, Umbarger HE (eds) 2nd edn, pp 721–730. Washington, DC, USA: ASM Press [Google Scholar]
- Peng L, Arauzo-Bravo MJ, Shimizu K (2004) Metabolic flux analysis for a ppc mutant Escherichia coli based on 13C-labelling experiments together with enzyme activity assays and intracellular metabolite measurements. FEMS Microbiol Lett 235: 17–23 [DOI] [PubMed] [Google Scholar]
- Pissarra PD, Nielsen J (1997) Thermodynamics of metabolic pathways for penicillin production: analysis of thermodynamic feasibility and free energy changes during fed-batch cultivation. Biotechnol Prog 13: 156–165 [Google Scholar]
- Price ND, Famili I, Beard DA, Palsson BØ (2002) Extreme pathways and Kirchhoff's second law. Biophys J 83: 2879–2882 [DOI] [PMC free article] [PubMed] [Google Scholar]
- Price ND, Papin JA, Schilling CH, Palsson BØ (2003) Genome-scale microbial in silico models: the constraints-based approach. Trends Biotechnol 21: 162–169 [DOI] [PubMed] [Google Scholar]
- Reed JL, Palsson BØ (2003) Thirteen years of building constraint-base in silico models of Escherichia coli. J Bacteriol 185: 2692–2699 [DOI] [PMC free article] [PubMed] [Google Scholar]
- Reed JL, Vo TD, Schilling CH, Palsson BØ (2003) An expanded genome-scale model of Escherichia coli K12 (iJR904 GSM/GPR). Genome Biol 4: R54. [DOI] [PMC free article] [PubMed] [Google Scholar]
- Rigoulet M, Aguilaniu H, Avéret N, Bunoust O, Camougrand N, Grandier-Vazeille X, Larsson C, Pahlman IL, Manon S, Gustafsson L (2004) Organization and regulation of the cytosolic NADH metabolism in the yeast Saccharomyces cerevisiae. Mol Cell Biochem 256–257: 73–81 [DOI] [PubMed] [Google Scholar]
- Riondet C, Cachon R, Wache Y, Alcaraz G, Divies C (1999) Changes in the proton-motive force in Escherichia coli in response to external oxidoreduction potential. Eur J Biochem 262: 595–599 [DOI] [PubMed] [Google Scholar]
- Romeo T, Snoep JL (2005) Glycolysis and flux control. In August Böck EcoSal—Escherichia coli and Salmonella: Cellular and Molecular Biology, Chapter 3.5.1. Washington, DC, USA: ASM Press http://www.ecosal.org [Google Scholar]
- Sato S, Soga T, Nishioka T, Tomita M (2004) Simultaneous determination of the main metabolites in rice leaves using capillary electrophoresis mass spectrometry and capillary electrophoresis diode array detection. Plant J 40: 151–163 [DOI] [PubMed] [Google Scholar]
- Schaub J, Schiesling C, Reuss M, Dauner M (2006) Integrated sampling procedure for metabolome analysis. Biotechnol Prog (in press) [DOI] [PubMed] [Google Scholar]
- Shimamoto T, Inaba K, Thelen P, Ishikawa T, Goldberg EB, Tsuda M, Tsuchiya T (1994) The NhaB Na+/H+ antiporter is essential for intracellular pH regulation under alkaline conditions in Escherichia coli. J Biochem (Tokyo) 116: 285–290 [DOI] [PubMed] [Google Scholar]
- Siddiquee KA, Arauzo-Bravo MJ, Shimizu K (2004) Metabolic flux analysis of pykF gene knockout Escherichia coli based on 13C-labeling experiments together with measurements of enzyme activities and intracellular metabolite concentrations. Appl Microbiol Biotech 63: 407–417 [DOI] [PubMed] [Google Scholar]
- Stelling J (2004) Mathematical models in microbial systems biology. Curr Opin Microbiol 7: 513–518 [DOI] [PubMed] [Google Scholar]
- Stephanopoulos G, Aristidou AA, Nielsen J (1998) Metabolic Engineering. Academic Press: San Diego [Google Scholar]
- Stitt M, Fernie AR (2003) From measurements of metabolites to metabolomics: an ‘on the fly' perspective illustrated by recent studies of carbon–nitrogen interactions. Curr Opin Biotechnol 14: 136–144 [DOI] [PubMed] [Google Scholar]
- Tewari YB, Hawkins AR, Lamb HK, Goldberg RN (2002) A thermodynamic study of the reactions: {2-dehydro-3-deoxy-D-arabino-heptanoate 7-phosphate(aq)=3-dehydroquinate(aq)+phosphate(aq)} and {3-dehydroquinate(aq)=3-dehydroshikimate(aq)+H2O(1)}. J Chem Thermodyn 34: 1671–1691 [Google Scholar]
- Tewari YB, Kishore N, Bauerle R, LaCourse WR, Goldberg RN (2001) Thermochemistry of the reaction {phosphoenolpyruvate(aq)+D-erythrose 4-phosphate(aq)+H2O(l)=2-dehydro-3-deoxy-D-arabino-heptonate 7-phosphate(aq)+phosphate(aq)}. J Chem Thermodyn 33: 1791–1805 [Google Scholar]
- Visser D, Schmid JW, Mauch K, Reuss M, Heijnen JJ (2004) Optimal re-design of primary metabolism in Escherichia-coli using linlog kinetics. Metab Eng 6: 378–390 [DOI] [PubMed] [Google Scholar]
- Voets T, Droogmans G, Raskin G, Eggermont J, Nilius B (1999) Reduced intracellular ionic strength as the initial trigger for activation of endothelial volume-regulated anion channels. Proc Natl Acad Sci USA 96: 5298–5303 [DOI] [PMC free article] [PubMed] [Google Scholar]
- Voit EO, Marino S, Lall R (2005) Challenges for the identification of biological systems from in vivo time series data. In Silico Biol 5: 83–92 [PubMed] [Google Scholar]
- Wang LQ, Birol I, Hatzimanikatis V (2004) Metabolic control analysis under uncertainty: framework development and case studies. Biophys J 87: 3750–3763 [DOI] [PMC free article] [PubMed] [Google Scholar]
- Wu L, Mashego MR, Proell AM, Vinke JL, Ras C, van Dam J, van Winden WA, van Gulik WM, Heijnen JJ (2006) In vivo kinetics of primary metabolism in Saccharomyces cerevisiae studied through prolonged chemostat cultivation. Metab Eng 8: 160–171 [DOI] [PubMed] [Google Scholar]
- Wu L, Mashego MR, van Dam JC, Proell AM, Vinke JL, Ras C, van Winden WA, van Gulik WM, Heijnen JJ (2005) Quantitative analysis of the microbial metabolome by isotope dilution mass spectrometry using uniformly 13C-labeled cell extracts as internal standards. Anal Biochem 336: 164–171 [DOI] [PubMed] [Google Scholar]
- Yang F, Qian H, Beard DA (2005) Ab initio prediction of thermodynamically feasible reaction directions from biochemical network stoichiometry. Metab Eng 7: 251–259 [DOI] [PubMed] [Google Scholar]
Associated Data
This section collects any data citations, data availability statements, or supplementary materials included in this article.
Supplementary Materials
Supplementary information 1
Supplementary information 2
Supplementary information 3
Supplementary information 4
Supplementary information 5