Abstract
Forest fragmentation is considered a greater threat to vertebrates than to tree communities because individual trees are typically long-lived and require only small areas for survival. Here we show that forest fragmentation provokes surprisingly rapid and profound alterations in Amazonian tree-community composition. Results were derived from a 22-year study of exceptionally diverse tree communities in 40 1-ha plots in fragmented and intact forests, which were sampled repeatedly before and after fragment isolation. Within these plots, trajectories of change in abundance were assessed for 267 genera and 1,162 tree species. Abrupt shifts in floristic composition were driven by sharply accelerated tree mortality and recruitment within ≈100 m of fragment margins, causing rapid species turnover and population declines or local extinctions of many large-seeded, slow-growing, and old-growth taxa; a striking increase in a smaller set of disturbance-adapted and abiotically dispersed species; and significant shifts in tree size distributions. Even among old-growth trees, species composition in fragments is being restructured substantially, with subcanopy species that rely on animal seed-dispersers and have obligate outbreeding being the most strongly disadvantaged. These diverse changes in tree communities are likely to have wide-ranging impacts on forest architecture, canopy-gap dynamics, plant–animal interactions, and forest carbon storage.
Keywords: edge effects, floristic composition, forest dynamics, habitat fragmentation, tree communities
The rainforests of central Amazonia contain some of the most biologically diverse tree communities ever encountered, averaging >250 species that attain a diameter of at least 10 cm (measured at breast height or above any buttresses) per hectare (1, 2). These communities are also being cleared and fragmented at alarming rates as a result of large-scale cattle ranching, slash-and-burn farming, rapid soya expansion, industrial logging, and wildfires (3–8). Because tree communities are crucial components of forest ecosystems (9) and sustain a wide variety of dependent animal species (10, 11), their persistence in fragmented landscapes will ultimately have a major impact on tropical biodiversity.
We evaluated the most extensive dataset ever collected on tree-community dynamics in fragmented forests, obtained from the Biological Dynamics of Forest Fragments Project, the world's largest and longest-running experimental study of habitat fragmentation (12, 13). Within a 1,000-km2 landscape, data were collected in 40 1-ha plots arrayed across nine forest fragments ranging from 1 to 100 ha in area and in control sites in nearby intact forest (see Methods). A key advantage of our experiment is that all study plots in fragmented and intact forests were sampled both before isolation of the fragments and at regular intervals thereafter, greatly increasing confidence in our findings. Our analysis, based on a two-decade study of nearly 32,000 trees, provides uniquely detailed insights into the impact of forest fragmentation on one of the world's most diverse tree floras.
Results and Discussion
At least during the initial decades after isolation, edge effects (i.e., the diverse environmental changes associated with the abrupt, artificial boundaries of forest fragments) appear to be the most important drivers of ecological change in fragmented Amazonian forests. Of particular significance is that tree mortality is chronically elevated within ≈100 m of forest edges as a result of greater desiccation stress and wind turbulence (14). Large (>60 cm in diameter) trees are especially vulnerable, dying nearly three times faster near edges than in forest interiors (15). Rapid tree death reduces forest biomass (16, 17) and leads to increased treefall gaps (14), wood debris, fine litter (17), and climbing vines (18) in fragmented forests.
At the outset, we estimated the rate of change in tree species richness for each of our 40 plots by regressing the number of species recorded in each census against the time in years since the initial census and then using the slope term as our response variable [see supporting information (SI) Tables 1–3]. Rates of change did not differ significantly (P = 0.22, Mann–Whitney U test) between forest edges (mean ± SD; 0.00 ± 1.23 species ha−1 year−1) and interiors (−0.36 ± 0.58 species ha−1 year−1), or among 1-, 10-, and 100-ha fragments and intact forest (P = 0.33, Kruskal–Wallis test). Results were similar (P > 0.24 in all tests) when rates of change were based on Fisher's alpha diversity index (SI Tables 1 and 2), which is insensitive to variation in sample size. Thus, at least during the initial two decades after fragmentation, tree species richness did not decline significantly in edge or fragment plots.
These simple patterns, however, obscure many striking changes in tree communities. First, the density of trees fluctuated considerably over time in many fragment plots (SI Tables 1–3), especially near forest edges, as a result of major episodes of tree mortality from windstorms or droughts, often followed by large pulses of tree recruitment. As a consequence, coefficients of variation (CV) in tree number were much higher (P < 0.0001, Mann–Whitney U test) for individual edge plots (6.0 ± 4.8%) than for interior plots (1.7 ± 1.2%).
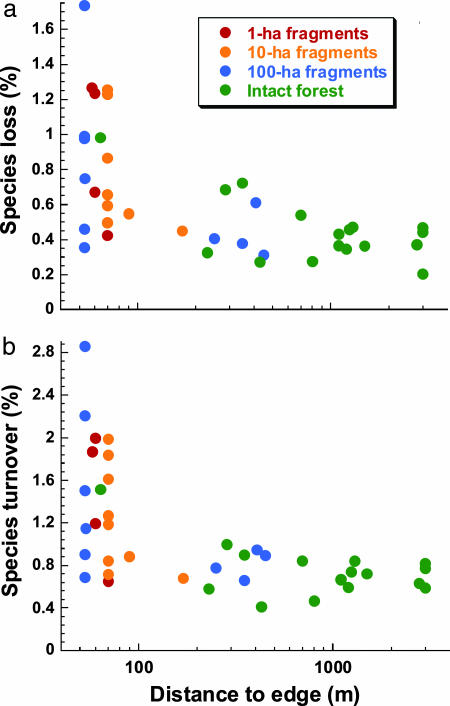
Second, the rate at which species disappeared (being absent from samples of ≥10-cm-diameter trees) rose dramatically in edge and fragment plots (Fig. 1a). These losses were largely countered by elevated recruitment of new species, leading to rapid species turnover (Fig. 1b). As a result of such volatility, species richness fluctuated markedly over time in individual edge plots, which had significantly (P = 0.005; Mann–Whitney U test) higher CVs in species richness (3.5 ± 2.4%) than did interior plots (1.5 ± 0.7%). Hence, despite the fact that species number did not decline consistently in fragments, the tree communities were much less stable, with accelerated species losses and turnover and temporally varying species richness (SI Tables 1–3).
Fig. 1.
Mean annual percentage rates of species loss (a) and species turnover (b) in Amazonian tree communities as a function of the distance of plots from the forest edge. Species loss: rs = −0.612, P = 0.0003; species turnover: rs = −0.630, P = 0.0001; Spearman rank correlations.
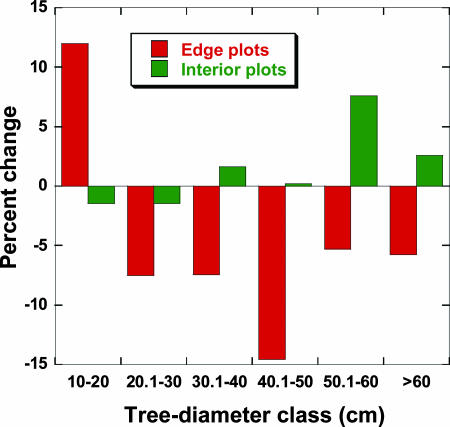
Third, the size distributions of trees changed markedly in edge plots, with small (10- to 20-cm diameter) trees increasing in number, whereas trees in all larger size classes declined (Fig. 2). These changes were highly significant in edge plots (χ2 = 56.4, df = 5, P < 0.00001; χ2 test for independence) and nonsignificant in forest-interior plots (χ2 = 1.58, df = 5, P = 0.90) (see SI Table 4). Because of the large proliferation of small trees, total tree density increased in many (13 of 19) edge plots but varied little over time in the interior plots.
Fig. 2.
Percentage changes in the population density of trees in different size classes near forest edges (plot center <100 m from the nearest edge) and in forest interiors (170–3,000 m from the edge) between the initial and final censuses of all plots.
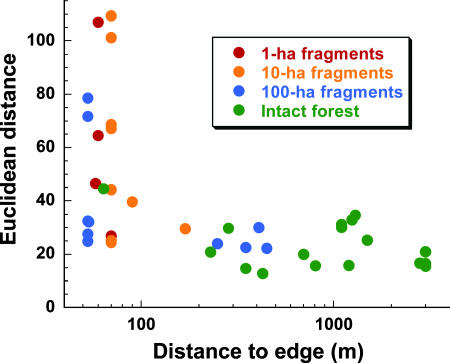
Finally, fragmentation caused important changes in species composition and abundances. We initially assessed these changes with Euclidean distances (19) to estimate floristic dissimilarity between the initial and final abundances of all 267 tree genera in our plots. We found much larger Euclidean distances near forest edges (54.5 ± 28.8) than in forest interiors (22.9 ± 6.8), revealing a breakdown of compositional stability in many fragment plots (Fig. 3).
Fig. 3.
Relative instability of tree-community composition in fragmented and intact forests, as illustrated by Euclidean distances between the initial and final abundances of 267 tree genera in each plot. Euclidean distances increased significantly in plots near forest edges (rs = −0.539, P = 0.0003; Spearman rank correlation).
The rapidly changing composition of forest fragments is further revealed by comparing the abundances of individual tree genera between the initial and final censuses of all edge plots, using bootstrapping. A total of 141 genera were sufficiently common (initially present in at least five plots) to permit statistical analysis. Of these, 15 increased significantly (10.6% of all genera) and 26 declined significantly (18.4% of all genera), even when we used a conservative (P ≤ 0.01) alpha value (see SI Table 5). Forest-interior plots in our study area have also experienced some shifts in tree abundance (20), but these involve fewer significant changes (10.7% vs. 29.1% of genera) and a much smaller magnitude of change across all genera (10.7% vs. 38.3% on average) than is occurring in forest fragments.
The trajectories of floristic change in Amazonian forest fragments are highly nonrandom. This is shown by an ordination analysis of all 267 tree genera, in which plot samples are arrayed in positions in ordination space that reflect their relative floristic composition, such that changes in the position of individual plots over time describe trajectories of change in floristic composition. The ordination analysis revealed three major gradients in floristic composition and explained 67% of the total variation in the dataset (see SI Table 6). Axis 3 did not differ significantly between edge and interior samples and was not considered further.
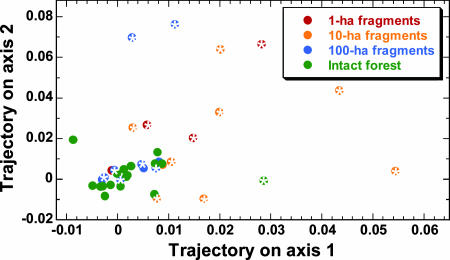
Although one would expect fragment plots, because of their considerable instability, to have longer trajectories than intact-forest plots, there is no a priori reason to assume that the fragment plots would move in any consistent direction. [Neutral-community models, for example, predict largely random deviations from initial species composition, with communities becoming increasingly dominated after fragmentation by locally abundant species (2, 21).] However, most fragment and edge plots exhibited similar trajectories of change, increasing along both the first and second ordination axes (Fig. 4). In contrast, intact-forest plots clustered around zero (little or no change) on both axes. The likelihood of this pattern arising by chance is minuscule (P = 0.0001, χ2 = 22.83, df = 4; Fisher's log-probability test).
Fig. 4.
Trajectories of change in tree-community composition in fragmented and intact forests in central Amazonia. For both axes, plots within 100 m of forest edges (indicated by a white asterisk within each data point) had significantly larger values than did forest-interior plots (axis 1, P = 0.001; axis 2, P = 0.028; Mann–Whitney U tests). If edge plots were changing randomly, then plot trajectories would be relatively evenly scattered around the control plots rather than being strongly biased toward positive values on both axes.
A key driver of these nonrandom compositional changes is elevated tree mortality in forest fragments. This is illustrated by highly significant relationships between the first two ordination vectors, which describe trajectories of floristic change in plots, and the mean rate of tree mortality in each plot (axis 1: P < 0.0001, R2 = 49.4%, F1,38 = 37.15; axis 2: P < 0.0001, R2 = 42.4%, F1,38 = 27.98; linear regressions). Even among edge and fragment plots, tree mortality varied considerably as a result of factors such as varying local topography, the spatial patchiness of windstorms, and differing distances of plots from the forest edge (14, 22), and these differences account for substantial variation in the floristic trajectories of different plots. In addition, spatial variability in the modified vegetation surrounding our fragments (pastures and different types and ages of regrowth forest), which provides a seed rain of disturbance-adapted tree species that proliferate in fragments (22), also explains some variation in floristic trajectories among the plots (23).
The rapid compositional shifts we observed are complex, and their interpretation is complicated by the fact that many Amazonian tree taxa are rare and poorly studied. Nevertheless, a quantitative assessment of 22 ecological, physiological, and life-history traits (SI Table 5) reveals many differences between the increasing and declining genera. In univariate tests (see SI Text: Univariate Tests of Increasing and Declining Genera), declining genera have significantly slower stem growth; naturally lower mortality, recruitment, and population-turnover rates; higher wood density; larger seeds; less abiotic (wind- and gravity-mediated) seed dispersal; higher leaf longevity; lower leaf-nitrogen content; lower photosynthetic capacity; higher shade tolerance; and a later successional status than do the increasing genera. An ordination analysis demonstrated that many of these traits are intercorrelated (see SI Table 7), and a multiple regression model using four ordination axes as potential predictors (see SI Table 8) revealed that early successional status and, to a lesser extent, abiotic seed dispersal and its correlates, were highly advantageous in fragmented forests (F2,38 = 43.9, R2 = 69.8%, P < 0.0001) (see SI Figs. 6–8). Traits correlated with tree size and with population density were nonsignificant predictors of fragmentation responses.
In general, these significant predictors distinguish specialized old-growth species, which frequently decline in forest fragments, from light-loving and habitat-generalist species, which often proliferate, sometimes dramatically. The pioneer Cecropia sciadophylla, for example, has increased by >3,000% in density since our study area was fragmented (22). The ecological differences between increasing and declining taxa are consistent with our interpretation that certain edge effects, especially sharply elevated tree mortality and a heavy seed rain from generalist trees growing in the surrounding modified lands, are key drivers of floristic change in our forest fragments, at least during the initial one to two decades after fragmentation.
In addition to dramatically increasing early successional trees, forest fragmentation is also altering old-growth tree assemblages. When early successional genera were excluded from the analysis of tree traits, we still encountered persistent differences between the remaining “winners” and “losers.” Old-growth genera that decline in fragments are significantly biased toward smaller, often subcanopy trees that rely on animal seed-dispersers, have obligate outbreeding systems (dioecious, gynodioecious, or androdioecious species), and tend to be relatively abundant in intact forest (see SI Text: Univariate Tests of Old-Growth Genera). Hence, even among old-growth species, ecological and life-history differences often cause large variations in responses to habitat fragmentation. Edge effects probably underlay at least some of these changes, given that many old-growth subcanopy trees are slow-growing and physiologically specialized for the low-light conditions of the intact-forest understory (24, 25) and thus are likely to be poorly adapted for exploiting edge conditions. However, the declines of genera that require obligate outbreeding and animal seed-dispersers suggest that losses of key pollinators and seed dispersers in fragments (26–31) could also be affecting tree communities.
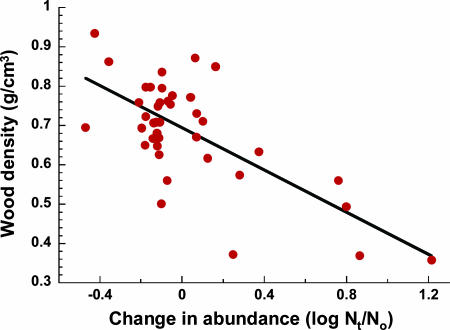
Our findings suggest that habitat fragmentation will have pervasive, long-term impacts on the species and functional composition of Amazonian forests. Trees that increase in abundance in fragments are very different at higher taxonomic levels than are trees that decline (SI Fig. 7). These changes could affect many aspects of forest ecology and functioning. Wood density, for example, is strongly and negatively related to the responses of tree genera to fragmentation (Fig. 5), suggesting that compositional shifts are reducing carbon storage in fragmented forests, above and beyond the carbon losses that result from elevated tree mortality (16, 17). Compositional changes in tree communities are also likely to affect forest architecture, canopy-gap dynamics, nutrient cycling, and plant–animal interactions in fragmented forests (9–11, 26–31).
Fig. 5.
Negative relationship between the wood density (dry specific gravity) of 41 tree genera and their responses to forest fragmentation (F1,39 = 35.72, R2 = 47.8%, P < 0.0001; linear regression analysis). The response of each genus was quantified as log(final importance value/initial importance value), with genera that increased in edge plots having positive values and those that declined having negative values.
A key finding of this study is that habitat fragmentation provokes surprisingly rapid changes in the composition of Amazonian tree communities. In less than two decades after fragmentation, nearly a fifth of the more-common tree genera have declined significantly (P < 0.01) in abundance, whereas over a tenth of the common genera have increased significantly. Such abrupt shifts are surprising. First, individuals of many Amazonian tree species can live for centuries or even millennia (32, 33), at least in intact old-growth forests, and thus one might expect assemblages of mature trees to change only slowly. Second, we only sampled newly recruited trees once they attained at least 10 cm in diameter, creating an inherent time lag and conservative bias in our findings. The impacts of fragmentation on seedlings and saplings are likely to be even more dramatic (e.g., ref. 34) than the pervasive changes we detected in larger-tree communities, because many seedlings and saplings would have regenerated and grown after fragmentation occurred. The highly nonrandom nature of these compositional alterations suggests that, over the long term, forest fragments may tend to converge in composition (35), supporting an increasingly biased and possibly depauperate subset of the complex Amazonian tree flora.
Had we focused in this study simply on species richness, the main parameter in many island-biogeography studies (36), we would have mistakenly concluded that forest fragmentation had nonsignificant impacts on Amazonian tree communities. Instead, we found that fragmentation instigated a suite of changes in community dynamics, functional and community composition, and forest structure. Such insights would have been nearly impossible without detailed prefragmentation data on the abundances of tree species in our plots and a long-term monitoring effort involving tens of thousands of individual trees. Few comparable studies contain prefragmentation data or involve extensive monitoring of target communities, and hence they could fail to detect important consequences of habitat fragmentation. In one of the few exceptions, long-term monitoring of man-made islands in Venezuela has revealed that plant and animal communities experience striking, transitory changes in species abundances and trophic composition following isolation (26, 37, 38).
We believe that the ecological impacts of habitat fragmentation will be severe in many human-dominated landscapes, where forest fragments are typically small (<100 ha in area) and irregularly shaped (39–41) and thus are highly vulnerable to edge and area effects. Such impacts are frequently aggravated by selective logging, invasive surface fires, and other anthropogenic disturbances that further elevate tree mortality in fragmented forests (39–42). Furthermore, the decline or hyperabundance of numerous animal species in fragmented landscapes can distort key ecological processes such as pollination, seed dispersal, herbivory, and nutrient cycling (26–31, 37, 38, 43, 44), with additional impacts on rainforest tree communities. In the long term, such wide-ranging disruptions could pose an important threat to tropical biodiversity, given the myriad ecological linkages among rainforest trees and their many dependent animal, plant, and fungal species.
Methods
Study Design.
The Biological Dynamics of Forest Fragments Project is a 1,000-km2 experimental landscape in central Amazonia. Within this landscape, nine forest fragments ranging from 1 to 100 ha in area were isolated from nearby intact forest during the early 1980s by clearing and burning the intervening vegetation to create cattle pastures. Some of the pastures have been abandoned and now support 2- to 15-year-old regrowth forest. Detailed descriptions of the project, including its study design, fragment histories, the matrices of modified vegetation surrounding fragments, and the methods used for censusing and identifying trees, are provided elsewhere (e.g., refs. 12–18).
Before fragment isolation, permanent 1-ha plots were established within each fragment and in eight comparable sites in nearby intact forest. The present study incorporates tree demography data from 40 1-ha plots, 24 of which were located in forest fragments or near forest edges (plot center <100 m from the nearest edge), whereas the other 16 were in intact-forest interiors (170–3,000 m from the edge). After an initial, exhaustive inventory of tree communities, each plot was resampled after fragmentation at typical intervals of 4–6 years to assess tree mortality, damage, and growth, and the recruitment of new trees (14–16). Altogether, the fates of nearly 32,000 trees were followed for periods of up to 18 years (mean = 14.7 years).
Species Loss, Gain, and Turnover.
On average, 95.3% of all trees in each plot were identified to the species or morphospecies level; nonidentified trees were not included in species-level analyses. For each plot, mean rates of species loss (% year−1) were derived by first calculating, for each census interval, [(Ne/No)/t] × 100, where Ne is the number of local extinctions during the interval, No is the number of species at the beginning of the interval, and t is the census duration in years. Data from multiple censuses of each plot were then weighted by census duration and averaged. Rates of species gain were calculated similarly, except that Ne was replaced by Ng (number of new species during the interval) and No was replaced by Nt (total number of species at the end of the interval). Species turnover for each interval was [(Ne + Ng)/(No + Ng)] × 100, with data for multiple intervals weighted by census duration and averaged as above.
Floristic Composition.
Analyses of floristic composition were conducted at the genus level, rather than the species level, because this greatly reduced the number of rare taxa that can confound statistical comparisons [88% of tree species in our study area have a mean density of <1 individual (≥10 cm in diameter at breast height) per hectare]. Several studies have shown that Amazonian and other tropical trees tend to show a high degree of ecological and life-history similarity at the genus level (45–50), although certain genera, such as Inga, are relatively more variable. The abundances of tree genera were quantified by using importance values (19), which combine relativized measures of density and basal area for each taxon and provide a more representative measure of the contribution of each genus to forest stands than do either density or basal-area data alone. (Frequency data were not incorporated into the importance values because the values were generated for individual plots.)
Changes in Tree Abundance.
Bootstrapping, a robust statistical method that makes no assumptions about the underlying data distributions, was used to test for changes in abundances of tree genera in forest fragments. Our analysis focused on plots in the vicinity of fragment edges (plot center <100 m from the nearest edge) because plots deep in the interiors of large fragments exhibit few if any effects of fragmentation (14, 18). For each genus, change in mean abundance (λ) was defined as NT/N0, where NT is the final abundance of the genus and N0 is its initial abundance. To estimate confidence limits for λ, we bootstrapped across all fragment-edge plots, with the same number of plots drawn at random, with replacement, and with λ calculated each time (the same set of plots was used to find both NT and N0). From 1,000 replicates, the 5th and 995th ranking values of λ were taken as the 99% confidence limits. Observed values of λ that fell outside this range were considered significant at the P ≤ 0.01 level (using a two-tailed test). Because this method is less reliable for taxa occurring in a small number of plots, we restricted analyses to genera initially present in at least five plots.
Ordination and Vectors of Floristic Change.
An ordination analysis was used to assess trajectories of change in floristic composition for each plot, based on repeated censuses of all tree genera. Nonmetric multidimensional scaling was used, with Sorensen's distance metric and untransformed tree-abundance data. Randomization tests were used to determine the number of significant axes in the analysis. For each 1-ha plot and ordination axis, plot trajectories were calculated by regressing the ordination score for each plot census against time (number of years since the initial plot census), to calculate the mean annual distance that the plot moved along each axis. To determine the overall likelihood that floristic trajectories of edge and interior plots differed significantly, results from individual t tests of the axis 1 and 2 trajectories were integrated using Fisher's log-probability test for combining the results of two independent tests of the same hypothesis (19).
Attributes of Tree Genera.
Data on 22 ecological, morphological, physiological, and life-history traits were gleaned from our long-term demographic study and from a detailed review of published and online resources and graduate theses. Most data from literature and online sources were for Amazonian tree species found in our study area; in a few cases for which few or no data were available, information from congeneric species found elsewhere in the Neotropics was used. For 16 traits for which data were available for all 41 genera that exhibited significant declines or increases in abundance, principal components analysis was used to identify intercorrelated suites of traits (SI Table 7), which were then used to predict responses of tree genera to fragmentation and edge effects in a multiple regression model.
Supplementary Material
Acknowledgments
We thank L. Borda da Agua, M. A. Cochrane, C. Dick, R. Didham, R. Ewers, P. Hall, K. Kitajima, and two anonymous referees for comments. This work was supported by the A. W. Mellon Foundation, the National Aeronautics and Space Administration Large-Scale Biosphere–Atmosphere Experiment in Amazônia program, the World Wildlife Fund/U.S., the Smithsonian Institution, the Brazilian Ministry for Science and Technology (CNPq), the U.S. National Science Foundation, and the Conservation, Food, and Health Foundation. This is publication no. 472 in the Biological Dynamics of Forest Fragments Project technical series.
Footnotes
The authors declare no conflict of interest.
This article contains supporting information online at www.pnas.org/cgi/content/full/0609048103/DC1.
References
- 1.Oliveira AA, Mori S. Biodiv Conserv. 1999;8:1219–1244. [Google Scholar]
- 2.Gilbert B, Laurance WF, Leigh EG, Jr, Nascimento HEM. Am Nat. 2006;168:304–317. doi: 10.1086/506969. [DOI] [PubMed] [Google Scholar]
- 3.Cochrane MA, Alencar A, Schulze MD, Souza CM, Nepstad DC, Lefebvre P, Davidson E. Science. 1999;284:1832–1835. doi: 10.1126/science.284.5421.1832. [DOI] [PubMed] [Google Scholar]
- 4.Laurance WF, Cochrane MA, Bergen S, Fearnside PM, Delamonica P, Barber C, D'Angelo S, Fernandes T. Science. 2001;291:438–439. doi: 10.1126/science.291.5503.438. [DOI] [PubMed] [Google Scholar]
- 5.Fearnside PM. Environ Conserv. 2001;28:23–38. [Google Scholar]
- 6.Asner GP, Knapp D, Broadbent E, Oliveira P, Keller M, Silva J. Science. 2005;310:480–482. doi: 10.1126/science.1118051. [DOI] [PubMed] [Google Scholar]
- 7.Soares-Filho BS, Nepstad DC, Curran LM, Coutinho Cerqueira G, Garcia RA, Azevedo Ramos C, Voll E, McDonald A, Lefebvre P, Schlesinger P. Nature. 2006;440:520–523. doi: 10.1038/nature04389. [DOI] [PubMed] [Google Scholar]
- 8.Morton DC, DeFries RS, Shimabukuro YE, Anderson LO, Arai E, Bon Esperito-Santo F, Freitas R, Morisette J. Proc Natl Acad Sci USA. 2006;103:14637–14641. doi: 10.1073/pnas.0606377103. [DOI] [PMC free article] [PubMed] [Google Scholar]
- 9.Clark DB, Clark DA. Forest Ecol Manage. 1995;80:235–244. [Google Scholar]
- 10.Richards PW. The Tropical Rain Forest. Cambridge, UK: Cambridge Univ Press; 1998. [Google Scholar]
- 11.Terborgh J. In: Conservation Biology: The Science of Scarcity and Diversity. Soulé M, editor. Sunderland, MA: Sinauer; 1986. pp. 330–344. [Google Scholar]
- 12.Lovejoy TE, Bierregaard RO, Rylands A, Malcolm JR, Quintela C, Harper L, Brown K, Powell A, Powell G, Schubart H, Hays M. In: Conservation Biology: The Science of Scarcity and Diversity. Soulé M, editor. Sunderland, MA: Sinauer; 1986. pp. 257–285. [Google Scholar]
- 13.Laurance WF, Lovejoy TE, Vasconcelos HL, Bruna EM, Didham RK, Stouffer PC, Gascon C, Bierregaard RO, Laurance SG, Sampiao E. Conserv Biol. 2002;16:605–618. [Google Scholar]
- 14.Laurance WF, Ferreira L, Rankin-de Merona J, Laurance S. Ecology. 1998;79:2032–2040. [Google Scholar]
- 15.Laurance WF, Delamonica P, Laurance SG, Vasconcelos HL, Lovejoy TE. Nature. 2000;404:836. doi: 10.1038/35009032. [DOI] [PubMed] [Google Scholar]
- 16.Laurance WF, Laurance SG, Ferreira LV, Rankin-de Merona J, Gascon C, Lovejoy TE. Science. 1997;278:1117–1118. [Google Scholar]
- 17.Nascimento H, Laurance WF. Ecol Applic. 2004;14:S127–S138. [Google Scholar]
- 18.Laurance WF, Perez-Salicrup D, Delamonica P, Fearnside PM, D'Angelo S, Jerozolinski A, Pohl L, Lovejoy TE. Ecology. 2001;82:105–116. [Google Scholar]
- 19.Magurran AE. Ecological Diversity and Its Measurement. Princeton: Princeton Univ Press; 1998. [Google Scholar]
- 20.Laurance WF, Oliveira AA, Laurance SG, Condit R, Nascimento HEM, Sanchez-Thorin AC, Lovejoy TE, Andrade A, D'Angelo S, Dick C. Nature. 2004;428:171–175. doi: 10.1038/nature02383. [DOI] [PubMed] [Google Scholar]
- 21.Hubbell SP. The Unified Neutral Theory of Biodiversity and Biogeography. Princeton: Princeton Univ Press; 2001. [DOI] [PubMed] [Google Scholar]
- 22.Laurance WF, Nascimento HEM, Laurance SG, Andrade A, Fearnside PM, Ribeiro JELS. Ecology. 2006;87:469–482. doi: 10.1890/05-0064. [DOI] [PubMed] [Google Scholar]
- 23.Nascimento HEM, Andrade A, Camargo JLC, Laurance WF, Laurance SG, Ribeiro JELS. Conserv Biol. 2006;20:853–860. doi: 10.1111/j.1523-1739.2006.00344.x. [DOI] [PubMed] [Google Scholar]
- 24.Thomas SC. Am J Bot. 1996;83:556–566. [Google Scholar]
- 25.Nascimento HEM, Laurance WF, Condit R, Laurance SG, D'Angelo S, Andrade A. J Veg Sci. 2005;16:625–634. [Google Scholar]
- 26.Terborgh J, Lopez L, Nuñez P, Rao M, Shahabuddin G, Orihuela G, Riveros M, Ascanio R, Adler GH, Lambert TD, Balbas L. Science. 2001;294:1923–1926. doi: 10.1126/science.1064397. [DOI] [PubMed] [Google Scholar]
- 27.Cardoso da Silva JM, Tabarelli M. Nature. 2000;404:72–74. doi: 10.1038/35003563. [DOI] [PubMed] [Google Scholar]
- 28.Cordeiro NJ, Howe HF. Conserv Biol. 2001;15:1733–1741. [Google Scholar]
- 29.Peres CA. Conserv Biol. 2001;15:1490–1505. [Google Scholar]
- 30.Sekercioglu CH, Daily GC, Ehrlich PR. Proc Natl Acad Sci USA. 2004;101:18042–18047. doi: 10.1073/pnas.0408049101. [DOI] [PMC free article] [PubMed] [Google Scholar]
- 31.Sekercioglu CH. Trends Ecol Evol. 2006;20:464–471. doi: 10.1016/j.tree.2006.05.007. [DOI] [PubMed] [Google Scholar]
- 32.Chambers JQ, Higuchi N, Schimel J. Nature. 1998;391:135–136. [Google Scholar]
- 33.Laurance WF, Nascimento HEM, Laurance SG, Condit R, D'Angelo S, Andrade A. Forest Ecol Manage. 2004;190:131–143. [Google Scholar]
- 34.Benitez-Malvido J. Conserv Biol. 1998;12:380–389. [Google Scholar]
- 35.Patterson BD. Conserv Biol. 1987;1:323–334. [Google Scholar]
- 36.MacArthur RH, Wilson EO. The Theory of Island Biogeography. Princeton: Princeton Univ Press; 1967. [Google Scholar]
- 37.Feeley KJ, Terborgh JW. Ecology. 2005;86:116–124. [Google Scholar]
- 38.Terborgh JW, Feeley KJ, Silman M, Nuñez P, Balukjian B. J Ecol. 2006;94:253–263. [Google Scholar]
- 39.Laurance WF, Bierregaard RO, editors. Tropical Forest Remnants: Ecology, Management, and Conservation of Fragmented Communities. Chicago: Univ Chicago Press; 1997. [Google Scholar]
- 40.Gascon C, Williamson GB, Fonseca GAB. Science. 2000;288:1356–1358. doi: 10.1126/science.288.5470.1356. [DOI] [PubMed] [Google Scholar]
- 41.Cochrane MA, Laurance WF. J Trop Ecol. 2002;18:311–325. [Google Scholar]
- 42.Laurance WF, Peres CA, editors. Emerging Threats to Tropical Forests. Chicago: Univ Chicago Press; 2006. [Google Scholar]
- 43.Klein BC. Ecology. 1989;70:1715–1725. [Google Scholar]
- 44.Dirzo R, Miranda A. In: Plant–Animal Interactions: Evolutionary Ecology in Tropical and Temperate Regions. Price PW, Lewinsohn P, Fernandes G, Benson W, editors. New York: Wiley; 1991. pp. 273–287. [Google Scholar]
- 45.Hubbell SP, Foster RB. In: Conservation Biology: The Science of Scarcity and Diversity. Soulé M, editor. Sunderland, MA: Sinauer; 1986. pp. 205–231. [Google Scholar]
- 46.Casper BB, Heard SB, Apanius V. Oecologia. 1992;90:212–217. doi: 10.1007/BF00317178. [DOI] [PubMed] [Google Scholar]
- 47.Webb CO. Am Nat. 2000;156:145–155. doi: 10.1086/303378. [DOI] [PubMed] [Google Scholar]
- 48.Ter Steege H, Hammond DS. Ecology. 2001;82:3197–3212. [Google Scholar]
- 49.Moles AT, Ackerly DD, Webb CO, Tweddle JC, Dickie JB, Westoby M. Science. 2005;307:576–580. doi: 10.1126/science.1104863. [DOI] [PubMed] [Google Scholar]
- 50.Chave J, Muller-Landau H, Baker T, Easdale T, ter Steege H. Ecol Applic. 2006 doi: 10.1890/1051-0761(2006)016[2356:rapvow]2.0.co;2. in press. [DOI] [PubMed] [Google Scholar]
Associated Data
This section collects any data citations, data availability statements, or supplementary materials included in this article.


