

Abstract
Regulation of eukaryotic gene expression depends on groups of related proteins acting at the levels of chromatin organization, transcriptional initiation, RNA processing, and nuclear transport. However, a unified understanding of how these different levels of transcriptional control interact has been lacking. Here, we combine genome-wide protein–DNA binding data from multiple sources to infer the connections between functional groups of regulators in Saccharomyces cerevisiae. Our resulting transcriptional network uncovers novel biological relationships; supporting experiments confirm new associations between actively transcribed genes and Sir2 and Esc1, two proteins normally linked to silencing chromatin. Analysis of the regulatory network also reveals an elegant architecture for transcriptional control. Using communication theory, we show that most protein regulators prefer to form modules within their functional class, whereas essential proteins maintain the sparse connections between different classes. Moreover, we provide evidence that communication between different regulatory groups improves the robustness and adaptivity of the cell.
Keywords: ChIP-chip, network adaptivity, network robustness, nuclear organization, transcriptional network
Introduction
The nucleus provides several mechanisms for regulating gene expression at the levels of chromatin organization, transcriptional initiation, RNA processing, and selective export via the nuclear pore complex. Groups of proteins that mediate these processes have been extensively characterized to provide insight into their mode of action within a living cell. For example, chromatin-immunoprecipitation experiments in combination with microarrays (termed ChIP-chip) have mapped the genomic occupancy of several protein classes in living cells. Genome-wide identification of binding sites has allowed for the inference of which genes are regulated by such factors. A number of previous studies have used genomic localization data from transcription factors (TFs) in order to build transcriptional regulatory networks in Saccharomyces cerevisiae (Lee et al, 2002; Bar-Joseph et al, 2003; Garten et al, 2005; Balaji et al, 2006a, 2006b). Other work has implicated histone modifying proteins and nucleosome remodelers (NRs) in regulating different gene expression programs (Ng et al, 2002; Robyr et al, 2002; Robert et al, 2004). However, a unified model that integrates the genome-wide interplay of all of these different protein regulators remains undefined.
Achieving such a model is hindered by several technical difficulties. For example, different labs devoted to the study of particular classes of proteins often use disparate microarray technologies and statistical approaches to decide what constitutes a bona fide binding site. Ideally, combining genome-wide binding data from different labs would not only uncover new connections within specific fields of study, such as cooperativity among TFs, but also between diverse fields, such as the effect of NRs on TF recruitment. Moreover, a unified model could allow for a global, systems-level description of the eukaryotic transcriptional architecture.
Here, we combine and normalize ChIP-chip data from multiple sources to gain a unified view of the interplay between functional groups of proteins in the budding yeast S. cerevisiae. We propose that these functional groups define discrete levels of the eukaryotic transcriptional architecture (Figure 1A). These levels include TFs, RNA processing and nuclear proteins (RPs), nuclear transport (import/export) proteins (NTs), NRs, histone modification (e.g., acetylation) states (HSs), and histone modifying proteins (HMs). Using communication theory, we identified biologically meaningful relationships within and between all the aforementioned regulatory groups. Our resulting transcriptional network uncovers novel connections in gene activation pathways, including associations between actively transcribed genes and silencing proteins Sir2 and Esc1. We also analyzed the topology of the network in order to quantify the interplay between different regulatory groups. Our results demonstrate that most protein regulators prefer to form modules within their functional class, whereas essential proteins maintain the sparse connections between different classes. Moreover, we provide evidence that communication between different regulatory groups improves the robustness and adaptivity of the cell.
Figure 1.

Building a network. (A) Levels of the eukaryotic transcriptional architecture integrated in our analysis. (B–D) TF X's and NR Y's genome-wide binding data are integrated, normalized, and traced through the network algorithm (see text).
Results
Building a transcriptional network
We obtained genome-wide binding data for 317 regulators during normal, glucose-rich growth conditions. As different groups use microarrays that are comprised of open reading frames (ORFs) or intergenic regions (IGRs), we integrated the heterogeneous data by assigning each ChIP-chip measurement to its pertinent annotated gene (see Materials and methods). Further, we normalized the data to mitigate variability in statistical analyses used by different groups (Figure 1B). We developed a general method for standardizing the level of binding to P-values (see Materials and methods), consistent with the statistical model of Ren et al (2000). Our normalization method extracts 67% more information at known interactions and attenuates the ‘noise' at unlikely interactions by 12%, outperforming the percentile rank normalization technique (Supplementary Table 1).
Using the normalized data, we inferred biological connections between any two regulators by identifying significant binding relationships (e.g., TF X and HM Y bind to a significantly similar/dissimilar number of genes). Using communication theory, we developed two methods for identifying pairwise connections between regulators. First, we introduced a simple but powerful technique of filtered correlation coefficient. This analysis localizes the correlation calculation to the most relevant genes in the ChIP-chip data and detects linear binding relationships with great sensitivity (see Materials and methods). In order to uncover more general, nonlinear binding dependencies, we also measured the mutual information—the amount of information gained about the binding profile of one factor from knowledge of the binding tendency of another factor (see Materials and methods). Mutual information is a very natural and biologically meaningful measure of binding dependence that will ultimately help us decide whether two proteins participate in the same biological process. Finally, we combined the P-values from the two complementary pairwise approaches in order to increase the confidence of our overall predictions (Figure 1C; see Materials and methods).
To identify significant binding relationships between three or more regulators, we developed a semi-supervised clustering algorithm that preserves information about elements of a cluster to better capture groupwise binding dependencies between proteins (see Materials and methods). Our algorithm identified 35 highly significant clusters (P<10−60), merging factors from different levels of the transcriptional architecture. Of these clusters, 26 were confirmed by published literature (Supplementary Table 2), thereby indicating that using ChIP-chip data in this manner was a viable way to infer biological relationships between different proteins.
Based on our pairwise and groupwise statistical methodologies, we created a network algorithm (Figure 1C and D) that identified connections within and between regulatory groups. In the first pass of the algorithm, we assigned a link between two factors if their combined analysis P-value (PVT) was less than 10−40. This conservative threshold was chosen to minimize false-positive predictions in our data, while still capturing known biological relationships (Supplementary Table 3). We next clustered the factors to identify probable DNA-binding complexes. In the algorithm's second pass, we checked for communication between regulator X and the DNA-binding complex of regulator Y (and vice versa); if the accumulated evidence of interaction between X and the members of Y's complex (or vice versa) was significant, we defined a link in the network between X and Y at a less stringent pairwise threshold of 10−30. The purpose of the second pass was to uncover probable false-negative interactions omitted by the first pass (Supplementary Table 3). The resulting network is displayed in Figure 2.
Figure 2.

Resulting network. (A) Each circle (node) represents a regulator from a color-coded group and each link (edge) represents a significant synergistic (positive) binding relationship between two factors (see Supplementary Figure 1 for opposing (negative) links). Each node is labeled by the regulator's common name followed by an ‘i' or ‘o' if its genomic occupancy was measured at intergenic or ORF regions, respectively. The dotted box shows factors that have a preference for binding active genes. (B–G) Zoom in on several known interactions highlighted in solid boxes (see text). Network visualization was performed using Pajek (http://vlado.fmf.uni-lj.si/pub/networks/pajek/doc/pajekman.htm).
Validation of network
Many of our predicted binding relationships that occur near DNA represent previously reported protein–protein associations. We compared our network predictions to protein–protein interactions from several high-throughput and small-scale studies (Yu et al, 2004a). Yu et al reported a compendium of physical interactions between all yeast proteins, including 309 interactions between proteins considered in our work. Although protein–protein associations may form anywhere within a cell, our predicted binding relationships occur only near DNA; hence, we did not expect full overlap with the data set of Yu et al (2004a). Despite the noise in protein–protein experiments, 100 out of the 309 pertinent connections detected by previous studies were also found to be significant by our method (P<10−60; Figure 3A). As connections in our network do not necessarily imply that proteins are resident at gene targets simultaneously, this result suggests that many of our interacting regulators are in fact part of protein–protein complexes.
Figure 3.

Network validation. (A) Protein–protein associations from previous studies overlap significantly with DNA-binding relationships predicted by the network. (B, C) Experiments support our network's prediction that Sir2 associates with actively transcribed genes in both (B) normal and (C) alpha-factor growth environments. (D) Esc1, another silencing protein, also associates with actively transcribed genes. See Supplementary Table 4 for a list of the gene sets in each Venn diagram.
Our network algorithm also identified over 340 biological relationships confirmed by published literature (Supplementary Table 3). For example, Figure 2 highlights the known associations within the SIR silencing complex, nuclear pore, RSC NR, and MCM–ORC DNA replication complex (Lieb et al, 2001; Wyrick et al, 2001; Ng et al, 2002; Casolari et al, 2004). Additionally, our analysis captured known interactions between protein complexes studied by different groups using varying microarray technologies, including NR Isw2, TATA box protein, and Pol3 transcriptional machinery (Kim and Iyer, 2004; Moqtaderi and Struhl, 2004; Gelbart et al, 2005). The network also confirmed the previously published dependencies between histone deacetylases Hst1 and Rpd3, and their corresponding recruitment factors Sum1 and Ume6, respectively (Robyr et al, 2002; Robert et al, 2004). Finally, groups of TFs that regulate common biological processes were identified and are highlighted in Figure 2, including the Swi cell cycle and Ste12 development clusters (Lee et al, 2002; Bar-Joseph et al, 2003; Zeitlinger et al, 2003).
New biological predictions
Our resulting network uncovered a novel connection between proteins implicated in active gene expression and silent information regulator Sir2 (Figure 2B). We experimentally confirmed by ChIP-chip (Supplementary Table 4) that Sir2 associates with a significant number of active genes in both normal and stimulus-induced growth environments. In standard, glucose-rich medium, Sir2 was bound to 244 of the 1013 (P<10−10; Figure 3B) most frequently transcribed genes (Holstege et al, 1998). Upon exposure to the mating pheromone alpha-factor, Sir2 was bound to 15 of the 50 (P<10−7; Figure 3C) most highly induced genes (Spellman et al, 1998). This process may involve TF Rap1, which binds numerous active genes and helps recruit Sir2 to its genomic targets (Lieb et al, 2001).
Our observations of Sir2's occupancy at active genes suggest a coupling between nuclear transport factors and silencing proteins such as Sir2, which colocalizes with Rap1 to the nuclear periphery (Gotta et al, 1997). To explore this connection further, we experimentally measured the genome-wide binding of Esc1, another silencing protein known to localize to the nuclear periphery (Supplementary Table 4). The genomic occupancy of Esc1 closely resembles that of Sir2, including binding at subtelomeric regions and a significant number of active genes (Figure 3D and Supplementary Figure 2). We reason that coupling may occur between silencing and nuclear transport factors at the nuclear periphery, which may facilitate the unloading of imported TFs, transcriptional initiation, or mRNA export. These experimental results demonstrate the ability of our integrative, network-based analysis to predict new biological phenomena (enumerated in Supplementary Table 5).
We validated our genome-wide localization experiments using previous literature and new experiments. Lieb et al (2001) previously performed genome-wide localization analysis for Sir2 in glucose medium. Figure 4A shows that over 75% of the previously reported Sir2 targets were confirmed by our study (P=10−46). We also validated several novel Sir2 and Esc1 ChIP-chip binding sites at actively transcribed genes by performing quantitative PCR on Sir2 and Esc1 chromatin immunoprecipitations (Figure 4). Two genes chosen for validation, PGK1 and ILV5, were present in both ChIP-chip data sets. RPA34 and TEF2 were also targeted for validation from the Sir2 and Esc1 data sets, respectively. As shown in Figure 4B, primers were designed to amplify selected regions from these genes. All of the tested actively transcribed genes considered bound by Sir2 and Esc1 were confirmed as targets by quantitative PCR as they were present at a higher level in our directed chromatin immunoprecipitations compared to our control, an intergenic region not known to be bound by either (Figure 4C and D). Finally, we tested CHA1, an active gene that was bound in our Sir2 data set and was also identified as a Sir2 target by Lieb et al (2001), and found that it too was significantly enriched (data not shown). These results validate the genome-wide observations from our ChIP-chip data that both Sir2 and Esc1, proteins believed to be solely involved in silencing, are associated with actively transcribed genes.
Figure 4.

Validation of novel Sir2- and Esc1-bound genes predicted by ChIP-chip experiments. (A) Venn diagram displaying the significant overlap of Sir2 binding sites between this study and the study by Lieb et al (2001). (B) A schematic representation of novel Sir2 and Esc1 targets with primer sets used in quantitative PCR. The transcriptional frequency of each gene is shown in mRNAs/hr (Holstege et al, 1998). (C, D) Quantitative PCR validation of Sir2 (C) and Esc1 (D) binding at actively transcribed genes. The binding enrichments are shown using bar graphs.
Network analysis
We next analyzed the topology of the network to quantify the interplay between different regulatory levels as defined in Figure 1A. We determined each node's degree, or number of interacting neighbors. Figure 5A shows that NTs were most promiscuous in their association with other factors, with an average degree of two times higher than the pathway-specific class of TFs. For each regulatory level, we also measured the characteristic path length (average shortest-edge distance between similarly categorized pairs of regulators, allowing for transitions through proteins in other levels) and class diameter (the maximum path length within a class). Short characteristic path lengths and small diameters between proteins allow for rapid propagation of information and quicker response to dynamic conditions (Barabasi and Oltvai, 2004; Luscombe et al, 2004). We found that NTs had a characteristic path length and class diameter two times smaller than that of TFs, indicative of their highly responsive regulatory topology. Based on these measures, RNA processing proteins (RPs) and NRs also shared a highly responsive topology and affected transcription in a more global manner similar to NTs, whereas HMs regulated more localized transcriptional programs similar to TFs (Figure 5A).
Figure 5.

Network analysis. (A) Topology measures (first column, see text for definitions) for each color-coded level, active, and inactive regulators (first row). (B, C) Network robustness. Sequential attacks against TFs cause the characteristic path length to rise (B) as connectivity decreases (C) until the network reaches a breakdown point (peaks in panel B). TF attacks cause the connectivity of the TF subnetwork to disintegrate more rapidly than the overall transcriptional network, without affecting communication within other regulatory levels (flat lines). (D) Network adaptivity. In contrast to inactive genes, increased communication between regulators at active genes expedites the propagation of information (compare average neighboring levels and characteristic path length of last 2 columns in panel A) and may improve the speed and redundancy of the cell's response to dynamic environmental conditions. Our unified model connects several factors individually implicated in active gene expression (Lieb et al, 2001; Casolari et al, 2004; Robert et al, 2004).
Network robustness
Communication between regulatory levels improved the robustness of the eukaryotic transcriptional network. For comparison to the overall network, we synthesized six subnetworks composed solely of interactions between nodes from a single level. In each subnetwork, one largest connected component (the largest set of nodes that are interconnected through some path) emerged; however, the overall network connected 33 more regulators than the sum of the individual subnetwork LCs (Figure 5A). A disconnected node cannot exchange information with the rest of the network, which may lead to a cellular malfunction (Barabasi and Oltvai, 2004); hence, communication between levels improved the resilience of the overall network. In silico removals of network nodes, analogous to in vivo biological deletions (Barabasi and Oltvai, 2004), further supported these results. Single in silico deletion of each regulator led to 51 disconnected nodes in the subnetworks, but only 25 in the overall network. Moreover, sequential attacks against TF nodes broke down the connectivity between TFs in the overall network more slowly than in the TF subnetwork (Figure 5B). Hence, communication between levels made the overall network more robust to sequential deletions, keeping many more TFs connected than the TF subnetwork (Figure 5C).
In our overall transcriptional network, proteins preferred to form modular subunits within their own level and communicate with other regulatory groups in a more selective manner. We defined inter- and intra-class affinity as the percentage of interactions realized between regulators from the same and from different classes, respectively. Each regulatory group exhibited a much higher intra- than inter-class affinity, indicative of each group's inherent modularity (Figure 5A). To further quantify the modularity within each regulatory level, we calculated the clustering coefficient (fraction of interactions realized between a node's nearest neighbors) for proteins in each subnetwork. NTs, RPs, and NRs had greater intra-class modularity than TFs and HMs, as indicated by their higher average clustering coefficient, intra-class affinity, and propensity to stay connected within their subnetwork LC (Figure 5A). Taken together, our network analysis formally shows that NTs, RPs, and NRs act as modular units that mediate general functions for large numbers of transcripts, whereas TFs and HMs are the specialists that provide gene target specificity.
Modularity within levels helps localize the deleterious effect of a dysfunctional regulator to its level. The flat lines in Figure 5B and C show that sequential removal of over 70 TFs had negligible effects on the connectivity within other levels. Moreover, single in silico deletions in the overall network led to 25 disconnected factors, 23 of which were from the same level as the removed node.
Essential proteins comprised a significant proportion of the hubs that link levels of the transcriptional architecture. Excluding histone modifications, the network consisted of 56 essential and 230 non-essential proteins (Winzeler et al, 1999). Essential proteins were more highly connected than non-essential nodes, with an average degree of 16 versus 11, respectively. We determined the number of regulatory groups each node linked, or its neighboring levels. We found that 73% of the essential proteins linked two or more levels and 50% connected four or more levels, compared to 42 and 14% of non-essential nodes, respectively (P<3 × 10⁻⁵, P<4 × 10⁻⁸). For example, the essential TF Rap1 has been implicated in the recruitment of regulators from several levels to active genes (Lieb et al, 2001; Bernstein et al, 2004; Casolari et al, 2004).
Network adaptivity
Regulators that preferentially bound to either active or inactive genes had opposing topological characteristics that significantly differed from the rest of the nodes in our network. We defined a factor as active/inactive if it was bound to a significant fraction (P<10−10) of the 20% most/least frequently transcribed genes (Holstege et al, 1998). The 31 active factors in our network displayed a high average degree (P<10−5) and low characteristic path length and diameter (P<10−5), indicative of fast propagation of information between regulators of a highly responsive, global process (Figure 5A). The modular structure of active factors also emerged in the large intra-class affinity (P<10−5), subnetwork LC size, and clustering coefficient (P<10−5). Interestingly, active regulators showed a high preference for associating with nodes from other levels, with near maximal average neighboring levels of 5.5 (P<10−5) and a high inter-class affinity (P<10−5). In contrast, the 16 inactive factors shared a significant topology with completely opposite properties, including low intra- and inter-class connectivity (P<10−5), reluctance for neighboring levels (P<10−5), slower propagation of information, and a more disjointed, non-modular subnetwork.
These results suggest a model whereby increased communication between levels at active genes may improve the adaptivity and redundancy of the cell's response to changing conditions (Figure 5D). We observed that control of inactive genes depends on disconnected, level-specific regulators. Upon induction, proteins from all six levels converge onto genes that require activation.
Discussion
By combining genome-wide binding data, we have defined a transcriptional architecture for S. cerevisiae. Our normalization of ChIP-chip data extracted more information at known interactions while attenuating the noise at unlikely interactions. Moreover, we applied aspects of communication theory to identify the connections between different regulatory levels of the transcriptional network. In the process, we introduced mutual information, filtered correlation, and semi-supervised clustering approaches for analyzing genome-wide binding data. Previous literature confirmed the validity of our method. Further, our integrative network approach accurately predicted novel biological phenomena, including unexpected connections between actively transcribed genes and silencing proteins Sir2 and Esc1. We validated these associations using ChIP-chip and quantitative PCR experiments. Hence, our network predictions represent an in silico screen for discovering new biological processes.
We analyzed the topology of the network to quantify the communication between levels of the transcriptional architecture. Our work formally showed that TFs and HMs associated in more localized, pathway-specific regulation, whereas NTs, RPs, and NRs controlled more responsive, global processes. We also found that the overall network had higher connectivity than level subnetworks, making it more robust to single and sequential in silico deletions. Further, regulatory levels exhibited high intra-class modularity, which localizes the effect of deletions to each level. Essential proteins often form the connections between the highly clustered levels. Moreover, increased communication between levels expedites the propagation of information at active genes and may improve the speed and redundancy of the cell's response to dynamic environmental conditions. Taken together, communication between levels of transcriptional control improves the robustness and adaptivity of the eukaryotic cell.
Several recent papers have focused on characterizing the regulatory effect of a single class of protein regulators, TFs. Combining ChIP-chip and other data for TFs, the authors discovered combinatorial relationships that control specific gene expression programs in S. cerevisiae. For example, co-occurrence of TF DNA-binding motifs and the distance between motifs at bound promoter sequences was used to predict interacting TF pairs. Presence of DNA-binding motifs, coexpression, and TF partnerships were also used to reduce false binding sites in ChIP-chip experiments and to predict TF occupancy in untested environmental conditions (Garten et al, 2005; Beyer et al, 2006). In two separate studies, Hwang et al (2005a, 2005b) developed a general method for integrating numerous types of data that provide evidence for TF regulation and used it to accurately reconstruct the regulatory network for galactose utilization in yeast. Finally, Balaji et al (2006a, 2006b) combined genomic localization data from over a hundred TFs and revealed an ‘over-engineered' distributed network architecture for TF co-regulation in yeast.
In this work, we found interactions not only between TFs but also between all the proposed levels of transcriptional control. Hence, unlike previous studies, we unified ChIP-chip data from several different laboratories that use varying microarray technologies and statistical platforms for measuring protein–DNA binding. Our integrative method standardized all ChIP-chip data to P-values that measure confidence of protein–DNA interactions in a uniform manner.
We next developed a method for comparing the normalized data in a biologically meaningful manner by combining P-values from two complementary techniques—filtered correlation and mutual information. Mutual information makes a hard decision on classifying the data as 0's and 1's before the analysis, filtering out likely false positives. In contrast, the filtered correlation cost function considers a soft and continuous version of the data, capturing many likely false negatives omitted by the mutual information analysis. Combining P-values integrates evidence from both analyses, thereby causing fewer errors in deciding whether two factors have a significant binding dependence.
Our work shows that integrating ChIP-chip data can provide new insight into the eukaryotic transcriptional architecture as a whole while also predicting novel interactions between individual components. As more genome-wide localization data sets become available, we believe that the statistical methodology presented here can be extended to mammalian cells. Moreover, we expect that future time-dependent ChIP-chip experiments from different developmental stages will allow for a dynamic description of the transcriptional architecture in complex organisms.
Materials and methods
Data integration
We obtained published genome-wide binding (ChIP-chip) data for TFs (Lieb et al, 2001; Wyrick et al, 2001; Lee et al, 2002; Bar-Joseph et al, 2003; Harbison et al, 2004; Kurdistani et al, 2004), NTs (Casolari et al, 2004; Hieronymus et al, 2004; Yu et al, 2004b), RPs (Geisberg and Struhl, 2004; Hieronymus et al, 2004; Kim and Iyer, 2004; Moqtaderi and Struhl, 2004; Yu et al, 2004b), NRs (Damelin et al, 2002; Ng et al, 2002; Santos-Rosa et al, 2003; Gelbart et al, 2005), HMs (Lieb et al, 2001; Robyr et al, 2002; Wang et al, 2002; Ng et al, 2003; Robert et al, 2004), and HSs (Bernstein et al, 2002, 2004; Kurdistani et al, 2004). Factors were placed into groups according to each protein's primary annotated function.
For ORF microarray data, we mapped the ChIP-chip information at each ORF to its corresponding annotated gene. For intergenic microarray data, where each intergenic region can control zero, one, or two genes, we assigned each DNA probe to the gene that it most likely regulates using a many-to-many mapping. This algorithm uses the union of intergenic probe–gene assignment pairs from several different groups (Ren et al, 2000; Lieb et al, 2001; Simon et al, 2001; Wyrick et al, 2001; Damelin et al, 2002; Ng et al, 2003; Bernstein et al, 2004; Geisberg and Struhl, 2004; Harbison et al, 2004; Moqtaderi and Struhl, 2004). Moreover, when two or more intergenic fragments mapped to the same gene, the probe that contains the most amount of information was chosen. As ChIP-chip experiments contain more information at the tails of the binding distribution, we chose the most-bound fragment for multiple probes that were consistently bound and the least-bound fragment for multiple probes that were consistently not bound.
Data normalization
To normalize the ChIP-chip data sets, we used P-values as a source of binding information (Supplementary Table 1). Most data sets calculated P-values based on the single array error model (Ren et al, 2000). To make data sets from our group consistent, we converted the P-values from two-sided to one-sided. To find the missing P-values for the remaining quarter of the data sets, we estimated the mean and variance of the log binding ratio distribution of the unbound population of genes using the left side of the overall log binding ratio distribution. Based on the estimate of the unbound distribution, we assigned a P-value for each observed binding ratio (see Supplementary information). To facilitate dissemination of our results and to stimulate further research, we have included our unified data sets and our Matlab code used for the analysis (Supplementary Table 6, Supplementary file MatlabCode.zip).
Filtered correlation and mutual information
To calculate the filtered correlation coefficient between normalized data vectors x and y for two proteins, ρ(x,y), we used maximum likelihood estimators to find the means of x and y across all genes, and the filtered variance and covariance for x and y across only genes bound by either protein. We found ρ(x,y) using these quantities and used the Student's t-test statistic to assign P-values for ρ(x,y) (see Supplementary information).
To estimate mutual information, we discretized x and y to binary data vectors of bound (1) and unbound (0) gene–protein interactions, by choosing a threshold that maximizes the information at 356 known interactions (Supplementary Table 7). Using the discrete data, we estimated the marginal and joint distribution for the binary (Bernoulli) binding profiles X and Y of any two proteins and found their mutual information I(X;Y) as follows:
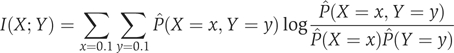
Next, we computed the P-values for I(X;Y) estimates using a hypergeometric test statistic. Finally, we used Fisher's method to combine the P-values from the two complementary pairwise approaches and obtained an overall P-value (PVT) for the pairwise dependence between two proteins (see Supplementary information).
Semi-supervised clustering
Unlike hierarchical clustering, our semi-supervised clustering algorithm maintains information about the groupwise relationship between elements in each cluster (see Supplementary information). The algorithm keeps track of two groupwise information vectors—the average binding profile xk of all joined proteins in each cluster Ck and the fraction of factors that occupy each gene fk—and uses these vectors to calculate the pairwise P-values (PVT) between partitions. At the start, the algorithm treats each of N elements (protein binding vectors) as a cluster and proceeds for N−1 iterations. At each iteration, the algorithm joins the two most similar partitions, based on the smallest pairwise P-value distance
![]()
until all N elements are unified into one partition. When merging two clusters Ck and Cl into cluster Co, the algorithm updates the groupwise information vectors
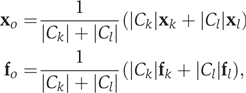
where ∣Ck∣ represents the size (cardinality) of cluster Ck. To identify only highly significant clusters, we use a P-value threshold of 10−60, more stringent than the pairwise threshold of 10−40 for connecting nodes in the network.
Hypergeometric P-values
To find the probability that k or more elements intersected subsets of n and m members at random (or the P-value for overlap of k) in a superset of size N, we summed over the right tail of a hypergeometric distribution:

We used this method to measure the significance of overlaps between essential proteins and hubs, for the network validation in Figure 3, for the overlap with the Lieb et al (2001) data set in Figure 4A, and for determining active/inactive factors (enumerated in Supplementary Table 8).
ChIP-chip and quantitative PCR
ChIP-chip experiments for Sir2 and Esc1 were performed essentially as described (Casolari et al, 2004). All the experiments were performed in biological triplicates. Immunoprecipitation was performed as described previously (Casolari et al, 2004). ChIPs were performed in biological duplicates as previously described (Lei and Silver, 2002) with the modification of using Dynal beads instead of Sepharose beads during immunoprecipitation. For immunoprecipitations, monoclonal anti-Myc (9E11, Santa Cruz) antibody was pre-coupled to pan-mouse IgG Dynal beads (Dynal Co.) followed by extensive washing. Immunoblotting was performed to confirm consistent protein levels and immunoprecipitation efficiency in each experiment. For quantitative PCR, primer sets spanning predicted novel associated genes were used. The results were compared against signals from an intergenic region to determine the magnitude of enrichment. The sequences of primers used were as follows: PGK1, GGACTTGAAGGACAAGCGTGTC and GCAATTCCTTAGCAACTGGAGCC; ILV5, AGATTGATCTGCAACTCCCGTG and ACCTTGGGAACCGTAACCGATC; RPA34, CGAGTTCAGCATACCAGATGG and CATTATCCTTGGCAGTGCTAGC; TEF2, CGGTCATGTCGATTCTGGTAAG and TCTCTGTGACCTGGAGCATC; intergenic region, GAAAAAGTGGGATTCTGCCTGTGG and GTTTGCCACAGCGACAGAAGTATAACC.
Network analysis
Single in silico deletion for each protein regulator (i.e., no deletion of HSs) involved removing the protein's node and all links connected to it in both the overall network and the pertinent subnetwork. For each in silico deletion in both perturbed networks, we calculated the number of resulting disconnected nodes from the same/different level as the removed node. Sequential attacks against TFs involved removing nodes in a sequential and cumulative manner, starting with the most highly connected TF and proceeding in a descending order (Albert et al, 2000). Choosing the order of sequential deletions at random did not affect the overall conclusions.
To find P-values for a measured topology of a class of m regulators (e.g., active factors), we repeated the network analysis for m randomly selected regulators in 105 independent trials. We counted the number of times, n, the same or more significant network topology occurred and assigned a P-value of n/105.
All the network analysis results remained consistent after incorporating corrections for level size and negative links (Supplementary Figure 3).
Supplementary Material
Supplementary Methods
Supplementary Tables and References
Supplementary Figure 1
Supplementary Figure 2
Supplementary Figure 3
Supplementary Table 4
Supplementary Table 5
Supplementary Tables 1, 2, 3, 7, and 8
MATLAB code
Supplementary Table 6
Acknowledgments
We thank David Gifford, Tommi Jaakkola, Manolis Kellis, Robin Dowell, Sourav Dey, and Obrad Scepanovic for their keen insight. We thank Jessica Hurt, Natalie Farny, and Jake Wintermute for critical reading of the manuscript. This work was supported by NDSEG and NSF fellowships to AMT, Ryan scholarship to CRB, NIH post-doctoral fellowship to MCY, Charles Stark Draper Endowment to MZW, and NIH grants to PAS.
References
- Albert R, Jeong H, Barabasi AL (2000) Error and attack tolerance of complex networks. Nature 406: 378–382 [DOI] [PubMed] [Google Scholar]
- Balaji S, Babu MM, Iyer LM, Luscombe NM, Aravind L (2006a) Comprehensive analysis of combinatorial regulation using the transcriptional regulatory network of yeast. J Mol Biol 360: 213–227 [DOI] [PubMed] [Google Scholar]
- Balaji S, Iyer LM, Aravind L, Babu MM (2006b) Uncovering a hidden distributed architecture behind scale-free transcriptional regulatory networks. J Mol Biol 360: 204–212 [DOI] [PubMed] [Google Scholar]
- Bar-Joseph Z, Gerber GK, Lee TI, Rinaldi NJ, Yoo JY, Robert F, Gordon DB, Fraenkel E, Jaakkola TS, Young RA, Gifford DK (2003) Computational discovery of gene modules and regulatory networks. Nat Biotechnol 21: 1337–1342 [DOI] [PubMed] [Google Scholar]
- Barabasi AL, Oltvai ZN (2004) Network biology: understanding the cell's functional organization. Nat Rev Genet 5: 101–113 [DOI] [PubMed] [Google Scholar]
- Bernstein BE, Humphrey EL, Erlich RL, Schneider R, Bouman P, Liu JS, Kouzarides T, Schreiber SL (2002) Methylation of histone H3 Lys 4 in coding regions of active genes. Proc Natl Acad Sci USA 99: 8695–8700 [DOI] [PMC free article] [PubMed] [Google Scholar]
- Bernstein BE, Liu CL, Humphrey EL, Perlstein EO, Schreiber SL (2004) Global nucleosome occupancy in yeast. Genome Biol 5: R62. [DOI] [PMC free article] [PubMed] [Google Scholar]
- Beyer A, Workman C, Hollunder J, Radke D, Moller U, Wilhelm T, Ideker T (2006) Integrated assessment and prediction of transcription factor binding. PLoS Comput Biol 2: e70. [DOI] [PMC free article] [PubMed] [Google Scholar]
- Casolari JM, Brown CR, Komili S, West J, Hieronymus H, Silver PA (2004) Genome-wide localization of the nuclear transport machinery couples transcriptional status and nuclear organization. Cell 117: 427–439 [DOI] [PubMed] [Google Scholar]
- Damelin M, Simon I, Moy TI, Wilson B, Komili S, Tempst P, Roth FP, Young RA, Cairns BR, Silver PA (2002) The genome-wide localization of Rsc9, a component of the RSC chromatin-remodeling complex, changes in response to stress. Mol Cell 9: 563–573 [DOI] [PubMed] [Google Scholar]
- Garten Y, Kaplan S, Pilpel Y (2005) Extraction of transcription regulatory signals from genome-wide DNA–protein interaction data. Nucleic Acids Res 33: 605–615 [DOI] [PMC free article] [PubMed] [Google Scholar]
- Geisberg JV, Struhl K (2004) Cellular stress alters the transcriptional properties of promoter-bound Mot1–TBP complexes. Mol Cell 14: 479–489 [DOI] [PubMed] [Google Scholar]
- Gelbart ME, Bachman N, Delrow J, Boeke JD, Tsukiyama T (2005) Genome-wide identification of Isw2 chromatin-remodeling targets by localization of a catalytically inactive mutant. Genes Dev 19: 942–954 [DOI] [PMC free article] [PubMed] [Google Scholar]
- Gotta M, Strahl-Bolsinger S, Renauld H, Laroche T, Kennedy BK, Grunstein M, Gasser SM (1997) Localization of Sir2p: the nucleolus as a compartment for silent information regulators. EMBO J 16: 3243–3255 [DOI] [PMC free article] [PubMed] [Google Scholar]
- Harbison CT, Gordon DB, Lee TI, Rinaldi NJ, Macisaac KD, Danford TW, Hannett NM, Tagne JB, Reynolds DB, Yoo J, Jennings EG, Zeitlinger J, Pokholok DK, Kellis M, Rolfe PA, Takusagawa KT, Lander ES, Gifford DK, Fraenkel E, Young RA (2004) Transcriptional regulatory code of a eukaryotic genome. Nature 431: 99–104 [DOI] [PMC free article] [PubMed] [Google Scholar]
- Hieronymus H, Yu MC, Silver PA (2004) Genome-wide mRNA surveillance is coupled to mRNA export. Genes Dev 18: 2652–2662 [DOI] [PMC free article] [PubMed] [Google Scholar]
- Holstege FC, Jennings EG, Wyrick JJ, Lee TI, Hengartner CJ, Green MR, Golub TR, Lander ES, Young RA (1998) Dissecting the regulatory circuitry of a eukaryotic genome. Cell 95: 717–728 [DOI] [PubMed] [Google Scholar]
- Hwang D, Rust AG, Ramsey S, Smith JJ, Leslie DM, Weston AD, de Atauri P, Aitchison JD, Hood L, Siegel AF, Bolouri H (2005a) A data integration methodology for systems biology. Proc Natl Acad Sci USA 102: 17296–17301 [DOI] [PMC free article] [PubMed] [Google Scholar]
- Hwang D, Smith JJ, Leslie DM, Weston AD, Rust AG, Ramsey S, de Atauri P, Siegel AF, Bolouri H, Aitchison JD, Hood L (2005b) A data integration methodology for systems biology: experimental verification. Proc Natl Acad Sci USA 102: 17302–17307 [DOI] [PMC free article] [PubMed] [Google Scholar]
- Kim J, Iyer VR (2004) Global role of TATA box-binding protein recruitment to promoters in mediating gene expression profiles. Mol Cell Biol 24: 8104–8112 [DOI] [PMC free article] [PubMed] [Google Scholar]
- Kurdistani SK, Tavazoie S, Grunstein M (2004) Mapping global histone acetylation patterns to gene expression. Cell 117: 721–733 [DOI] [PubMed] [Google Scholar]
- Lee TI, Rinaldi NJ, Robert F, Odom DT, Bar-Joseph Z, Gerber GK, Hannett NM, Harbison CT, Thompson CM, Simon I, Zeitlinger J, Jennings EG, Murray HL, Gordon DB, Ren B, Wyrick JJ, Tagne JB, Volkert TL, Fraenkel E, Gifford DK, Young RA (2002) Transcriptional regulatory networks in Saccharomyces cerevisiae. Science 298: 799–804 [DOI] [PubMed] [Google Scholar]
- Lei EP, Silver PA (2002) Intron status and 3′-end formation control cotranscriptional export of mRNA. Genes Dev 16: 2761–2766 [DOI] [PMC free article] [PubMed] [Google Scholar]
- Lieb JD, Liu X, Botstein D, Brown PO (2001) Promoter-specific binding of Rap1 revealed by genome-wide maps of protein–DNA association. Nat Genet 28: 327–334 [DOI] [PubMed] [Google Scholar]
- Luscombe NM, Babu MM, Yu H, Snyder M, Teichmann SA, Gerstein M (2004) Genomic analysis of regulatory network dynamics reveals large topological changes. Nature 431: 308–312 [DOI] [PubMed] [Google Scholar]
- Moqtaderi Z, Struhl K (2004) Genome-wide occupancy profile of the RNA polymerase III machinery in Saccharomyces cerevisiae reveals loci with incomplete transcription complexes. Mol Cell Biol 24: 4118–4127 [DOI] [PMC free article] [PubMed] [Google Scholar]
- Ng HH, Robert F, Young RA, Struhl K (2002) Genome-wide location and regulated recruitment of the RSC nucleosome-remodeling complex. Genes Dev 16: 806–819 [DOI] [PMC free article] [PubMed] [Google Scholar]
- Ng HH, Robert F, Young RA, Struhl K (2003) Targeted recruitment of Set1 histone methylase by elongating Pol II provides a localized mark and memory of recent transcriptional activity. Mol Cell 11: 709–719 [DOI] [PubMed] [Google Scholar]
- Ren B, Robert F, Wyrick JJ, Aparicio O, Jennings EG, Simon I, Zeitlinger J, Schreiber J, Hannett N, Kanin E, Volkert TL, Wilson CJ, Bell SP, Young RA (2000) Genome-wide location and function of DNA binding proteins. Science 290: 2306–2309 [DOI] [PubMed] [Google Scholar]
- Robert F, Pokholok DK, Hannett NM, Rinaldi NJ, Chandy M, Rolfe A, Workman JL, Gifford DK, Young RA (2004) Global position and recruitment of HATs and HDACs in the yeast genome. Mol Cell 16: 199–209 [DOI] [PMC free article] [PubMed] [Google Scholar]
- Robyr D, Suka Y, Xenarios I, Kurdistani SK, Wang A, Suka N, Grunstein M (2002) Microarray deacetylation maps determine genome-wide functions for yeast histone deacetylases. Cell 109: 437–446 [DOI] [PubMed] [Google Scholar]
- Santos-Rosa H, Schneider R, Bernstein BE, Karabetsou N, Morillon A, Weise C, Schreiber SL, Mellor J, Kouzarides T (2003) Methylation of histone H3 K4 mediates association of the Isw1p ATPase with chromatin. Mol Cell 12: 1325–1332 [DOI] [PubMed] [Google Scholar]
- Simon I, Barnett J, Hannett N, Harbison CT, Rinaldi NJ, Volkert TL, Wyrick JJ, Zeitlinger J, Gifford DK, Jaakkola TS, Young RA (2001) Serial regulation of transcriptional regulators in the yeast cell cycle. Cell 106: 697–708 [DOI] [PubMed] [Google Scholar]
- Spellman PT, Sherlock G, Zhang MQ, Iyer VR, Anders K, Eisen MB, Brown PO, Botstein D, Futcher B (1998) Comprehensive identification of cell cycle-regulated genes of the yeast Saccharomyces cerevisiae by microarray hybridization. Mol Biol Cell 9: 3273–3297 [DOI] [PMC free article] [PubMed] [Google Scholar]
- Wang A, Kurdistani SK, Grunstein M (2002) Requirement of Hos2 histone deacetylase for gene activity in yeast. Science 298: 1412–1414 [DOI] [PubMed] [Google Scholar]
- Winzeler EA, Shoemaker DD, Astromoff A, Liang H, Anderson K, Andre B, Bangham R, Benito R, Boeke JD, Bussey H, Chu AM, Connelly C, Davis K, Dietrich F, Dow SW, El Bakkoury M, Foury F, Friend SH, Gentalen E, Giaever G, Hegemann JH, Jones T, Laub M, Liao H, Liebundguth N, Lockhart DJ, Lucau-Danila A, Lussier M, M'Rabet N, Menard P, Mittmann M, Pai C, Rebischung C, Revuelta JL, Riles L, Roberts CJ, Ross-MacDonald P, Scherens B, Snyder M, Sookhai-Mahadeo S, Storms RK, Veronneau S, Voet M, Volckaert G, Ward TR, Wysocki R, Yen GS, Yu K, Zimmermann K, Philippsen P, Johnston M, Davis RW (1999) Functional characterization of the S. cerevisiae genome by gene deletion and parallel analysis. Science 285: 901–906 [DOI] [PubMed] [Google Scholar]
- Wyrick JJ, Aparicio JG, Chen T, Barnett JD, Jennings EG, Young RA, Bell SP, Aparicio OM (2001) Genome-wide distribution of ORC and MCM proteins in S. cerevisiae: high-resolution mapping of replication origins. Science 294: 2357–2360 [DOI] [PubMed] [Google Scholar]
- Yu H, Greenbaum D, Xin Lu H, Zhu X, Gerstein M (2004a) Genomic analysis of essentiality within protein networks. Trends Genet 20: 227–231 [DOI] [PubMed] [Google Scholar]
- Yu MC, Bachand F, McBride AE, Komili S, Casolari JM, Silver PA (2004b) Arginine methyltransferase affects interactions and recruitment of mRNA processing and export factors. Genes Dev 18: 2024–2035 [DOI] [PMC free article] [PubMed] [Google Scholar]
- Zeitlinger J, Simon I, Harbison CT, Hannett NM, Volkert TL, Fink GR, Young RA (2003) Program-specific distribution of a transcription factor dependent on partner transcription factor and MAPK signaling. Cell 113: 395–404 [DOI] [PubMed] [Google Scholar]
Associated Data
This section collects any data citations, data availability statements, or supplementary materials included in this article.
Supplementary Materials
Supplementary Methods
Supplementary Tables and References
Supplementary Figure 1
Supplementary Figure 2
Supplementary Figure 3
Supplementary Table 4
Supplementary Table 5
Supplementary Tables 1, 2, 3, 7, and 8
MATLAB code
Supplementary Table 6