Abstract
The electrophilic eicosanoids prostaglandins A1 or A2 impaired p53-dependent transcription of endogenous genes and exogenous p53-luciferase reporter plasmids in RKO and HCT 116 colon cancer cells. Cellular accumulation of genetically wild-type, but transcriptionally silent p53 varied as a function of exposure time and concentration of prostaglandins A1 and A2. Prostaglandins A1 and A2 induced a conformational change in wild-type p53 that corresponded with its inactivation and its aberrant redistribution from the cytosol to the nucleus. Derangement of its transcriptional activity manifested as inhibition of p53-mediated apoptosis by etoposide, a representative antineoplastic agent. We conclude that electrophilic eicosanoids impair the role of wild-type p53 as a guardian of genomic integrity by a process distinct from somatic mutation or viral oncoprotein binding. This process may pertain to malignant and premalignant conditions, such as colon carcinoma and adenoma, which often harbor a genetically wild-type, but inactive form of p53 tumor suppressor.
Inactivation of the p53 tumor suppressor usually involves somatic mutation of a p53 allele or binding of viral oncoproteins to p53 protein (1–5). However, several types of malignant and premalignant tissues (6–10) harbor a genetically wild-type, but transcriptionally inactive form of p53, often localized in their cytoplasm. Because the inactivation of wild-type p53 in these circumstances does not correspond with its mutation or viral oncoprotein binding, it must involve an unknown, epigenetic process. We noticed that investigations on agents affecting cell-cycle regulation and apoptosis seldom distinguish formally between p53 independence and p53 inactivation; p53 is transcriptionally “silent” in both contexts. We hypothesized that certain agents, nominally classified as p53-independent, might actually inactivate wild-type p53 by a mechanism different from somatic mutation or oncoprotein binding. Cyclopentenone prostaglandin (PG)A1 and PGA2, are prominent in this regard (11–14). We report that colon cancer cells exposed to PGA1 or PGA2 (i) accumulate wild-type p53 in a deranged conformation that does not translocate normally to the nucleus, (ii) lose p53-dependent transactivation of p21Waf−1/Cip−1 (p21) and p53 reporter plasmids, and (iii) lose susceptibility to apoptosis by etoposide, a representative p53-dependent antineoplastic agent. Our results suggest that inactivation of genetically wild-type p53 can occur via a process that is unrelated to its somatic mutation or sequestration by viral oncoproteins. This third mechanism of p53 inactivation may have significance as a risk factor in certain types of carcinogenesis.
Experimental Procedures
Materials.
We used DMEM and McCoy's 5A medium and supplements (GIBCO/BRL); PGA1, PGA2, and PGB1 (Cayman Chemicals, Ann Arbor, MI); etoposide (Sigma); protease inhibitor mixture and FuGene-6 transfection reagent (Roche Molecular Biochemicals); enhanced chemiluminescence reagents (Amersham Pharmacia); luciferase reporter lysis buffer and reporter detection reagents (Promega); monoclonal antibodies directed against MDM2 (SMP14) and p53 (DO-1, Pab240); polyclonal antibodies against p21 (H-164) and p53 (FL-393-G); horseradish peroxidase-conjugated secondary antibodies; protein A/G PLUS-Agarose (Santa Cruz Biotechnology); Ac-DEVD-MCA (Peptides International); a luciferase p53 cis reporter construct (p53-Luc, Stratagene); a β-galactosidase expression vector (pCMVβ; CLONTECH); and pC53-SN3 wild-type and pC53-SCX3 (V143A mutant) p53 constructs (refs. 15 and 16; a kind gift of B. Vogelstein, Johns Hopkins University, Baltimore).
Cell Culture.
We maintained HCT 116 (ATCC CCL-247) cells in McCoy's 5A medium and RKO cells (Mark Meuth, Institute for Cancer Studies, University of Sheffield, Sheffield, U.K.) in DMEM at 37°C in a humidified incubator with 5% CO2. We supplemented media with 2 mM l-glutamine, 1 mM sodium pyruvate, 50 units/ml penicillin and streptomycin, and 10% (vol/vol) FBS.
p53 Transcriptional Activity.
We transfected 105 cells per well with 1 μg of p53-Luc and 50 ng of pCMVβ in 3 μl of FuGene-6. After 48 h, we incubated cells for 6 h with vehicle (DMSO), 0–60 μM PGA1 or PGA2, or 50 μM etoposide plus 0–60 μM PGA1 or PGA2. We aspirated media, washed cells with 0.05 M PBS (pH 7.4) at 4°C, and then lysed cells at −70°C in 200 μl of reporter lysis buffer. We centrifuged the lysate at 20,000 × g for 15 min at 4°C and quantified luciferase and β-galactosidase activity in the supernatant fractions. In certain experiments, we measured the effect of PGB1 on p53-Luc reporter activity.
Immunochemical Detection of p53 and p21 Proteins.
We incubated 106 cells for 0–6 h at 37°C with 0–60 μM PGA1, PGA2, or DMSO vehicle. We removed the medium and lysed cells in 50 mM Tris, pH 7.4/100 mM NaCl/2 mM EDTA with 0.1% SDS/0.1% deoxycholate/1× complete protease inhibitor mixture. We fractionated equal portions of the total cell lysate from each sample (10 or 15 μg of protein) by SDS/PAGE. We transferred proteins to poly(vinylidene difluoride) blocked with 10% (wt/vol) nonfat dry milk in Tris-buffered saline T [20 mM Tris⋅HCl, pH 7.5/100 mM sodium chloride/0.5% (vol/vol) Tween 20]. We measured proteins immunochemically by using primary antibodies directed against MDM2 (1:200), p53 (1:10,000), and p21 (1:5,000), as well as horseradish peroxidase-conjugated secondary antibodies (1:400). We detected antigen–antibody complexes with enhanced chemiluminescence reagents. We varied the luminescent exposure times for the measurement of p53 and p21. Experiments on the kinetics and concentration dependence of p53 and p21 protein expression use exposure times to optimize the dynamic range of the signal for each protein independently. In several experiments, we fractionated cell lysates into nuclear and cytosolic portions to monitor subcellular localization of p53 (17). We quantified the total protein content of these fractions spectrophotometrically and their p53 content immunochemically. The nuclear and cytosol fractions typically contained 20% and 80% of the total protein, respectively.
Immunoprecipitation of p53.
We treated RKO and HCT 116 cells with DMSO, PGA1, PGA2, PGB1, or etoposide as described above. We lysed cells in 250 mM sucrose/50 mM Tris, pH 7.4/25 mM KCl/5 mM MgCl2/1 mM EDTA/1× complete protease inhibitor/2 μM NaF/2 μM sodium orthovanadate. We sonicated the lysate twice for 5 s at 4°C. After centrifugation at 13,000 × g, we incubated samples containing 200 μg of total cell lysate for 16 h at 4°C with 1 μg of Pab240, an antibody that specifically recognizes mutant conformations of p53 under nondenaturing conditions (18–20), and 20 μl of protein A/G PLUS-Agarose in 1 ml of PBS with 0.4% Tween 20. We centrifuged the samples at 2,500 × g to isolate the antigen–antibody immune complexes. We washed the immunoprecipitate twice with 1 ml of PBS/0.4% Tween 20. We fractionated samples by SDS/PAGE as described above and measured the amount of conformationally mutant p53 in the immunoprecipitate by hybridization with a separate anti-p53 polyclonal antibody (FL-393).
Caspase-3 Activity.
We lysed ≈106 cells in 25 mM Hepes, pH 7.5/5 mM EDTA/2 mM DTT/0.1% 3-[(3-cholamidopropyl)dimethylammonio]-1-propanesulfonate and measured caspase-3 activity fluorometrically (21).
Gene Expression Profiling.
We used TRIzol (GIBCO/BRL) and Oligotex beads to purify 1 μg of DNase-treated mRNA per sample for gene expression analysis (22). We prepared cDNA hybridization probes via reverse transcription of poly(A) RNA and labeling with dCTP conjugated to fluorescent dyes. The hybridization probes consist of control cell cDNA labeled with Cy 5-dCTP and test cell cDNA labeled with Cy 3-dCTP. We diluted the Cy 3- and Cy 5-cDNA hybridization probes in buffer containing 10% (wt/vol) dextran sulfate, 50% (vol/vol) formamide, 0.3 M NaCl, 10 mM Tris (pH 8.0), 1 mM EDTA, 1× Denhardt's solution, 10 mM DTT, and 0.5 mg/ml nonhomologous DNA. We simultaneously hybridized probes from paired samples against 4,600 separate cDNA deposited on a microarray slide under a sealed glass coverslip. After hybridization at 42°C for 36 h in a humidified chamber, we removed nonbound Cy 5- and Cy 3-labeled cDNA hybridization probes by washing with 2× SSC (20× SSC: 3 M NaCl/0.3 M sodium citrate, pH 7)/0.1% SDS at 25°C followed by washing with 0.5× SSC/0.1% SDS at 45°C. We measured fluorescence from dried microarray slides with a Molecular Dynamics Array Scanner. Differential gene expression between the two samples corresponds to relative fluorescence at the respective emission wavelengths for Cy 5 or Cy 3 at the coordinate on the microarray that contains a cDNA annotated as a particular gene. For RKO cells and HCT 116 cells, we analyzed the following pairs: (i) PGA1 versus vehicle, (ii) PGA2 versus vehicle, (iii) etoposide versus vehicle, (iv) PGA1 plus etoposide versus etoposide alone, and (v) PGA2 plus etoposide versus etoposide alone. Expression ratios were quantified by arrayvision software, normalized, and analyzed by the cluster analysis method (23) after selecting the genes that displayed a ≥2-fold change in expression in at least half of the microarrays used in the analysis.
Results
Derangement of the genome usually increases the cellular level of wild-type p53 tumor suppressor and p53-dependent transcription (1–5, 24). Consistent with this expectation, p53 protein and two of its transcriptionally regulated proteins, p21 and MDM-2, increased proportionately in RKO and HCT 116 colon cancer cells incubated for 6 h with 50 μM etoposide, a topoisomerase II inhibitor (data not shown). p53 protein also increased in RKO and HCT 116 cells incubated for 6 h with 60 μM of PGA1 or PGA2; however, in this case, p21 and MDM-2 protein levels did not increase coordinately. In RKO cells, p53 and MDM-2 rose 2-fold, but p21 levels fell to 14–38% of those of control. In HCT 116 cells, p53 rose 5-fold, but p21 rose only 2-fold, and MDM-2 did not change (data not shown). These results implied that p53 accumulation and transcription were dissociated in cells exposed to PGA1 or PGA2.
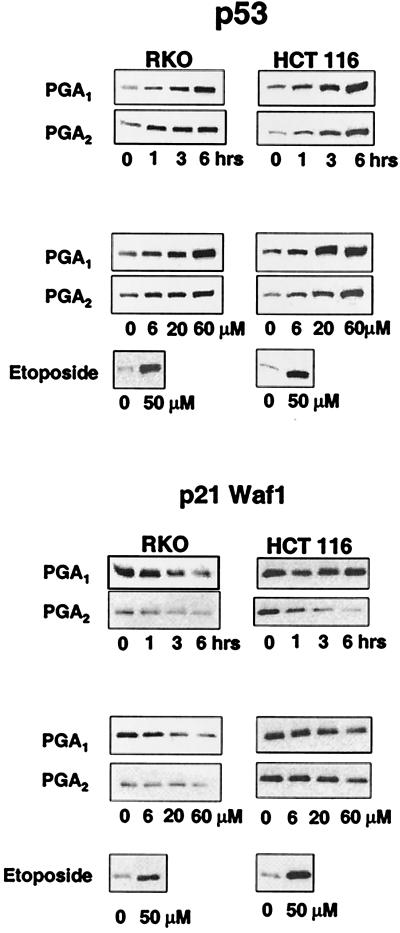
We confirmed that PGA1 and PGA2 caused disproportionate changes in the expression of p53 and p21 protein in RKO and HCT 116 cells. P53 protein levels rose as a function of time (0–6 h) and concentration of PGA1 or PGA2 (0–60 μM; Fig. 1 Upper). In contrast, p21 protein levels fell or remained unchanged as a function of time and concentration of PGA1 or PGA2 (Fig. 1 Lower).
Figure 1.
Inverse relationship between wild-type p53 and p21 expression in RKO and HCT 116 cells treated with electrophilic PG. (Upper) p53 protein expression in RKO and HCT 116 cells incubated with 60 μM PGA1 or PGA2 for 0, 1, 3, and 6 h (lanes labeled as times) or with 0, 6, 20, and 60 μM PGA1 or PGA2 for 6 h (lanes labeled as concentrations). (Lower) p21 protein expression in the same experiment. The sample labeled etoposide in each panel depicts a control response in cells incubated for 6 h with 50 μM etoposide.
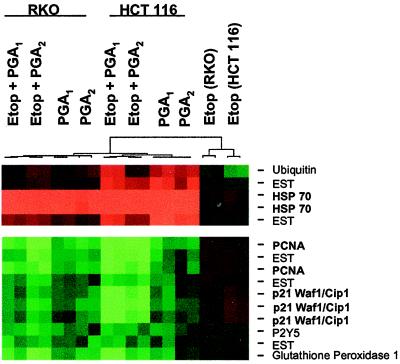
Transcription of p21 mRNA also declined in RKO and HCT 116 cells incubated with PGA1 or PGA2 alone or combined with 50 μM etoposide. Analysis of mRNA expression for 4,600 cDNA identified 11 genes expressed differentially in cells incubated with PGA1, PGA2, PGA1 plus etoposide, or PGA2 plus etoposide, compared with cells incubated with etoposide alone (Fig. 2). Cluster analysis showed that seven genes—including p21, PCNA, glutathione peroxidase, P2Y5, and three unannotated cDNA—declined by >50% in cells treated with PGA1, PGA2, PGA1 plus etoposide, or PGA2 plus etoposide, compared with the decline in cells incubated with etoposide alone (Fig. 2). Four genes—including HSP-70, ubiquitin, and two unannotated cDNA—rose by >2-fold in cells treated with PGA1, PGA2, PGA1 plus etoposide, or PGA2 plus etoposide, compared with the rise in cells incubated with etoposide alone (Fig. 2).
Figure 2.
Gene expression analysis in RKO and HCT 116 cells incubated with electrophilic PG. The horizontal segments, in duplicate, (left to right) depict the “cluster” analysis for RKO cells treated with 50 μM etoposide (Etop) plus 20 μM PGA1, 50 μM etoposide plus 20 μM PGA2, 20 μM PGA1, or 20 μM PGA2; HCT 116 cells treated with 50 μM etoposide plus 20 μM PGA1, 50 μM etoposide plus 20 μM PGA2, 20 μM PGA1, or 20 μM PGA2; RKO cells treated with 50 μM etoposide alone; and HCT 116 cells treated with 50 μM etoposide alone. Green rectangles depict seven genes [proliferating cell nuclear antigen (PCNA), p21, P2Y5, glutathione peroxidase, and three expressed sequence tags (ESTs)] whose expression fell by >2-fold in all treatment groups, compared with that in treatment with etoposide alone. Red rectangles depict four genes [heat-shock protein (HSP)-70, ubiquitin, and two expressed sequence tags] whose expression rose by >2-fold in all treatment groups, compared with that in treatment with etoposide alone. The dendrogram shows that differential gene expression in samples treated with PGA1 or PGA2 diverges from gene expression in samples treated with etoposide alone.
Other p53-responsive genes were on the array, including gadd45 and MDM-2. These genes did not demonstrate a 2-fold change in mRNA expression in the required number of experimental conditions to fit the gene selection criteria and thus are not displayed in the analysis. However, gadd45 mRNA declined by an averaged of 47%, and MDM-2 mRNA declined by an average of 45% in cells treated with PGA1, PGA2, PGA1 plus etoposide, or PGA2 plus etoposide compared with vehicle and etoposide treatments alone. This result supports the notion that p53 transcription is impaired in cells incubated with PGA series cyclopentenones.
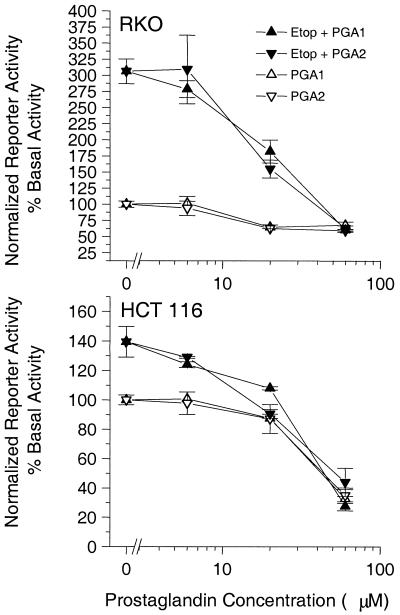
The dissociation between the p53 protein levels and p21 transcription implied that RKO and HCT 116 cells exposed to PGA1 or PGA2 accumulate wild-type p53 protein that is transcriptionally silent. We substantiated this implication in cells transfected with a p53-dependent luciferase reporter plasmid. p53 transactivation fell from its basal level (100%) to 68 ± 5% or 60 ± 3% (P < 0.05; n = 4) in RKO cells incubated for 6 h with 60 μM PGA1 or A2, respectively (Fig. 3 Upper). Likewise, basal p53 transactivation (100%) fell to 34 ± 6% or 35 ± 5% (P < 0.05; n = 4) in HCT 116 cells treated equivalently (Fig. 3 Lower). Etoposide, used as a procedural control, increased p53-dependent transactivation from basal (100%) to 310 ± 15% in RKO cells and to 140 ± 10% in HCT 116 cells (Fig. 3). Consistent with the results from Fig. 2, PGA1 and PGA2 each inhibited the etoposide-induced p53 transcription in a concentration-dependent manner with a potency (EC50) ≅ 20 μM (Fig. 3).
Figure 3.
Inactivation of wild-type p53 transcriptional activity in RKO and HCT 116 cells treated with electrophilic PG. PGA1 (▵) and PGA2 (▿) inhibited the basal transactivation of a p53-Luc reporter in RKO cells (Upper) and HCT 116 cells (Lower). PGA1 (▴) and PGA2 (▾) also inhibited etoposide (Etop)-induced transactivation of a p53-Luc reporter in RKO cells (Upper) and HCT 116 cells (Lower) with a potency ≅ 20 μM.
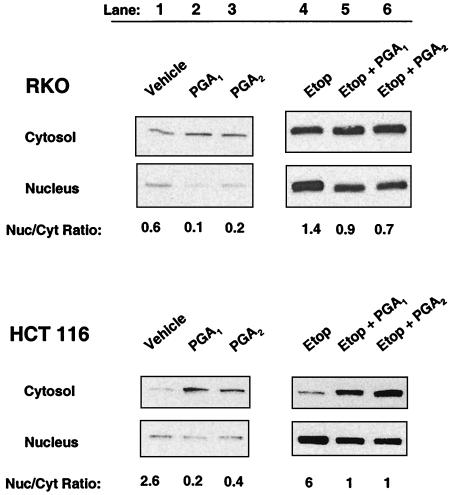
Derangement of the genome usually causes a redistribution of p53 from the cytosol to the nucleus (1–5, 25, 26). However, wild-type p53 protein accumulated preferentially in the cytosol and did not redistribute to the nucleus in RKO cells or HCT 116 cells incubated with PGA1 or PGA2 (Fig. 4, lanes 1–3). The nuclear/cytosolic p53 ratio fell from 0.6 to 0.1 or 0.2 in RKO cells incubated with 20 μM PGA1 or PGA2, respectively (Fig. 4 Upper, lanes 1–3). The nuclear/cytosolic p53 ratio fell from 2.6 to 0.2 or 0.4 in HCT 116 cells treated equivalently (Fig. 4 Lower, lanes 1–3).
Figure 4.
Subcellular distribution of wild-type p53 in RKO and HCT 116 colon cancer cells treated with electrophilic PG. Cytosolic and nuclear distribution of p53 protein in RKO cells (Upper) and HCT 116 cells (Lower) incubated with DMSO vehicle (lane 1), 20 μM PGA1 (lane 2), 20 μM PGA2 (lane 3), 50 μM etoposide (Etop; lane 4), 50 μM etoposide plus 20 μM PGA1 (lane 5), or 50 μM etoposide plus 20 μM PGA2 (lane 6). Lanes represent a constant percentage of total protein from the nuclear and cytosolic fractions of identical samples. The number below each lane is the nuclear/cytosolic (Nuc/Cyt) ratio estimated by densitometry.
RKO and HCT 116 cells both responded normally when stimulated with 50 μM etoposide. In HCT 116 cells, the nuclear content of p53 protein rose, compared with the rise observed with vehicle control, and the p53 protein redistributed preferentially into the nucleus. The nuclear/cytosolic p53 ratio was 6 in HCT 116 cells incubated for 6 h with 50 μM etoposide (Fig. 4 Lower, lane 4 versus lane 1). PGA1 and PGA2 also impaired the subcellular redistribution of p53 protein between the cytosol and nucleus in HCT 116 cells stimulated with etoposide, analogous to their direct effect on HCT 116 cells (Fig. 4 Lower, lanes 4–6). The nuclear/cytosolic ratio of p53 protein fell from 6 in HCT 116 cells treated with etoposide alone to 1 in HCT 116 cells treated with etoposide plus PGA1 or PGA2 (Fig. 4 Lower, lanes 4–6).
In RKO cells incubated with etoposide, the nuclear p53 content also rose, compared with the rise observed with the vehicle control (Fig. 4 Upper, lanes 4–6). However, the p53 protein did not accumulate preferentially in the nucleus. Instead, it redistributed equally between the nucleus and cytosol with a ratio of 1.4 in RKO cells incubated with for 2 h with 50 μM etoposide (Fig. 4 Upper, lane 4 versus lane 1). PGA1 and PGA2 had modest effects on the redistribution of p53 protein in RKO cells stimulated with etoposide (Fig. 4 Upper, lanes 4–6). The nuclear/cytosolic ratio of p53 protein fell from 1.4 in RKO cells treated with etoposide to 0.9 or 0.7 in RKO cells treated with etoposide + PGA1 or PGA2, respectively (Fig. 4 Upper, lanes 4–6).
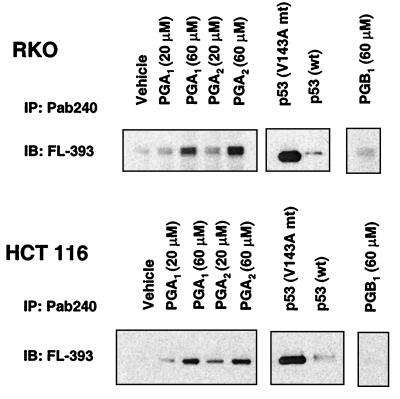
Gene expression profiling and cluster analysis showed that HSP-70 mRNA expression rose by ≥4-fold in RKO cells and ≥10-fold in HCT 116 cells treated with PGA1 or PGA2 alone or combined with etoposide (Fig. 2). The distinctive induction of HSP-70, the impaired redistribution of p53 between the nucleus and cytosol, and the impaired transcriptional activity of p53 prompted us to monitor its conformational state. In HCT 116 and RKO cells exposed to PGA1 or PGA2, genetically wild-type p53 immunoprecipitated with Pab240, an antibody that specifically recognizes mutant conformations of p53 under nondenaturing conditions (18–20). Pab240 recognizes an epitope in the central DNA-binding region that is not exposed on wild-type p53 but is exposed in class II conformational mutants of p53. In cells exposed to PGB1, a related prostanoid with a chemically more inert cyclopentenone substituent, little p53 immunoprecipitated with Pab240 (Fig. 5). We performed additional controls to verify that Pab240 specifically precipitated p53 in a mutant conformation. We transfected RKO and HCT 116 cells with 0.5 μg of pC53-SCX3 encoding mutant p53 (V143A conformational mutant) or pC53-SN3 encoding wild-type p53. After 16 to 24 h, Pab240 preferentially immunoprecipitated the mutant form of p53 from these cells (Fig. 5).
Figure 5.
Conformation of p53 in RKO and HCT 116 cells treated with electrophilic PG. Immunochemical determination of mutant conformation of p53 from RKO cells (Upper) and HCT 116 cells (Lower) incubated with DMSO (Vehicle), 20–60 μM PGA1 or PGA2, along with controls of cells transfected with mutant (mt) and wild-type (wt) p53 constructs and 60 μM PGB1. Lanes represent the relative proportions of mutant conformation p53 immunoprecipitated (IP) from the total cell lysate by using Pab240 and detected by immunoblotting (IB) with FL-393.
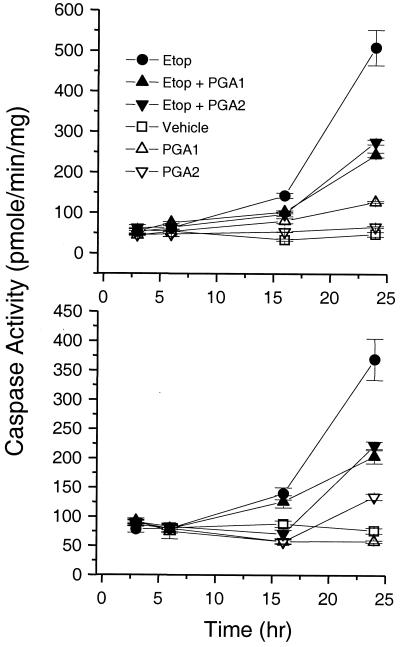
Consistent with impairment of its conformation, its nuclear localization, and its transcriptional activity, PGA1 and PGA2 also impaired p53-dependent apoptosis (ref. 24; Fig. 6). In RKO cells treated with etoposide plus PGA1 or PGA2, caspase-3 activity rose at rates of 3.5 ± 0.8 or 2.8 ± 0.5 units/h, respectively, from 0–16 h. These rates were ≈50% slower than 7.2 ± 0.1 units/h in RKO cells treated with etoposide alone (P < 0.05). Maximal caspase-3 activity (24 h) in RKO cells treated with etoposide plus PGA1 or PGA2 was 243 ± 5 or 275 ± 6 pmol/mg/min, respectively. These values were ≈50% lower than 509 ± 44 pmol/mg/min in RKO cells treated with etoposide alone (P < 0.05). In HCT 116 cells treated with etoposide plus PGA1 or PGA2, caspase-3 activity rose at initial rates of 3.3 ± 1.6 or < 0.5 units/h, respectively. These rates were 35–90% slower than 5 ± 1.1 units/h in HCT 116 cells treated with etoposide alone (P < 0.05). Maximal caspase-3 activity in HCT 116 cells treated with etoposide plus PGA1 or PGA2 was 204 ± 12 or 222 ± 7 pmol/mg/min, respectively. These values were 35–40% lower than 369 ± 35 pmol/mg/min in HCT 116 cells treated with etoposide alone (P < 0.05).
Figure 6.
Impairment of p53-mediated apoptosis in RKO and HCT 116 cells treated with electrophilic PG. Caspase-3 activity increased in RKO cells (Upper) and HCT 116 cells (Lower) incubated with 50 μM etoposide (Etop; ●) for 0–24 h. In cells treated with 50 μM etoposide plus 20 μM PGA1 (▴) or plus 20 μM PGA2 (▾), the rate and maximal extent of caspase-3 activation fell compared with etoposide alone (●). The time course for caspase-3 activity was similar among cells treated with DMSO vehicle control, 20 μM PGA1 (▵), or 20 μM PGA2 (▿) alone.
Discussion
We conclude that PGA1 and PGA2, acting as electrophiles (i) alter the conformation of wild-type p53, (ii) cause cellular accumulation of p53, (iii) derange the transcriptional function and spatial distribution of p53, and (iv) ultimately impair p53-mediated apoptosis. It is improbable that PGA1 and PGA2 alter the genotype of p53 in our experiments. Thus, they must alter the conformation of p53 by an epigenetic process. There are two plausible mechanisms. First, PGA1 and PGA2 can conjugate with glutathione (27–29). Partial depletion of cellular glutathione correlates with a rise in the steady-state levels of intermolecular or intramolecular disulfide bonds (30) and subsequent changes in the native conformation of proteins with vulnerable sulfhydryl groups. Alternatively, PGA1 and PGA2 can react directly with nucleophilic substituents on proteins (28, 31, 32). Such reactions, too, could derange the conformation of a genetically wild-type p53 protein. We note that oxidizing agents can also derange the conformation and function of p53 (33–35). It is established that HSP-70 associates readily with genetically mutant p53 proteins, precisely because these proteins have abnormal conformations (36–40). The robust induction of HSP-70 in our experiments is consistent with the accumulation of conformationally abnormal p53, as well as other proteins, in cells. Our model integrates isolated observations on PGA2 and HSP-70 induction (41, 42) into a self-consistent, biologically relevant scheme.
We propose that electrophilic eicosanoids, typified by but not restricted to PGA1 and PGA2, may contribute in part to the cytosolic segregation and inactivation of p53 reported in inflammatory breast cancer (6), neuroblastoma (7, 8), colon adenocarcinoma (9), and colon adenoma (10). It is debatable whether PGA1 or PGA2 occurs at micromolar concentration in vivo. However, colon adenocarcinoma, adenoma, and inflammatory conditions are all associated with overexpression of cyclooxygenase isoenzymes (43–45) and with conditions favoring spontaneous dehydration of PGE2 into PGA2 (46–50). Thus, cells might persistently encounter steady-state concentrations of PGA that recapitulate the processes we describe. Formation of iso-PGs from radical-catalyzed rearrangement of arachidonic acid is also favored by inflammation and cyclooxygenase overexpression. Chen et al. (51) recently detected iso-PGA2 in vivo. Even if PGA1 or PGA2 were minor participants in the epigenetic inactivation of p53 in vivo, chemical principles mandate that other compounds with electrophilic α,β-unsaturated ketone substituents should behave like the A series PGs. Accordingly, Δ12-PGJ2 also inhibited p53-dependent transactivation, induced HSP-70 expression, and sequestered p53 in the cytosol of RKO and HCT 116 cells (data not shown). Importantly, PGB1, which has a more inert α,β-unsaturated ketone, did not alter p53 protein conformation, expression, or transactivation. This result agrees with the original report showing that the chemical reactivity of the α,β-unsaturated ketone governs the antiproliferative effect of cyclopentenone PG (52).
Our model may apply to electrophiles other than eicosanoids. For example, paradoxical effects of benzo[g]chrysene 11,12-dihydrodiol 13,14-epoxide on p53 and p21 expression in MCF-7 cells (53) fit into the framework we propose. Somatic mutation of p53 is usually considered a late event in oncogenesis. Inactivation of p53 by chemically reactive electrophiles offers a basis for its involvement earlier in oncogenesis. If exposure of cells to electrophiles inactivated p53 by the process we describe, it might cause lapses in the maintenance of genomic and chromosomal integrity. These lapses could facilitate conversion of cells to a mutator phenotype (54).
Acknowledgments
Bert Vogelstein provided p53 plasmids. Edmond Massuda provided helpful comments. The Microarray Core Facility of the Huntsman Cancer Institute assisted with gene expression analysis. This work was supported by the Huntsman Cancer Foundation and United States Public Health Service Grant R01 AI 26730-10. F.A.F. holds the Dee Glenn and Ida W. Smith Chair for Cancer Research.
Abbreviations
- p21
p21Waf−1/Cip−1
- PG
prostaglandin
Footnotes
Article published online before print: Proc. Natl. Acad. Sci. USA, 10.1073/pnas.160241897.
Article and publication date are at www.pnas.org/cgi/doi/10.1073/pnas.160241897
References
- 1.Levine A J, Momand J, Finlay C A. Nature (London) 1991;351:453–456. doi: 10.1038/351453a0. [DOI] [PubMed] [Google Scholar]
- 2.Lane D P. Nature (London) 1992;358:15–16. doi: 10.1038/358015a0. [DOI] [PubMed] [Google Scholar]
- 3.Zambetti G P, Levine A J. FASEB J. 1993;7:855–865. doi: 10.1096/fasebj.7.10.8344485. [DOI] [PubMed] [Google Scholar]
- 4.Vogelstein B, Kinzler K W. Cell. 1992;70:523–526. doi: 10.1016/0092-8674(92)90421-8. [DOI] [PubMed] [Google Scholar]
- 5.Agarwal M L, Taylor W R, Chernov M V, Chernova O B, Stark G R. J Biol Chem. 1998;273:1–4. doi: 10.1074/jbc.273.1.1. [DOI] [PubMed] [Google Scholar]
- 6.Moll U M, Riou G, Levine A J. Proc Natl Acad Sci USA. 1992;89:7262–7266. doi: 10.1073/pnas.89.15.7262. [DOI] [PMC free article] [PubMed] [Google Scholar]
- 7.Moll U M, LaQuaglia M, Benard J, Riou G. Proc Natl Acad Sci USA. 1995;92:4407–4411. doi: 10.1073/pnas.92.10.4407. [DOI] [PMC free article] [PubMed] [Google Scholar]
- 8.Isaacs J S, Hardman R, Carman T A, Barrett J C, Weissman B E. Cell Growth Differ. 1998;9:545–555. [PubMed] [Google Scholar]
- 9.Bosari S, Viale G, Roncalli M, Graziani D, Borsani G, Lee A K, Coggi G. Am J Pathol. 1995;147:790–798. [PMC free article] [PubMed] [Google Scholar]
- 10.Tominaga O, Hamelin R, Trouvat V, Salmon R J, Lesec G, Thomas G, Remvikos Y. Oncogene. 1993;8:2653–2658. [PubMed] [Google Scholar]
- 11.Gorospe M, Liu Y, Xu Q, Chrest F J, Holbrook N J. Mol Cell Biol. 1996;16:762–770. doi: 10.1128/mcb.16.3.762. [DOI] [PMC free article] [PubMed] [Google Scholar]
- 12.Gorospe M, Wang X, Guyton K Z, Holbrook N J. Mol Cell Biol. 1996;16:6654–6660. doi: 10.1128/mcb.16.12.6654. [DOI] [PMC free article] [PubMed] [Google Scholar]
- 13.Hitomi M, Shu J, Strom D, Hiebert S W, Harter M L, Stacey D W. J Biol Chem. 1996;271:9376–9383. doi: 10.1074/jbc.271.16.9376. [DOI] [PubMed] [Google Scholar]
- 14.Tanikawa M, Yamada K, Tominaga K, Morisaki H, Kaneko Y, Ikeda K, Suzuki M, Kiho T, Tomokiyo K, Furuta K, et al. J Biol Chem. 1998;273:18522–18527. doi: 10.1074/jbc.273.29.18522. [DOI] [PubMed] [Google Scholar]
- 15.Baker S J, Markowitz S, Fearon E R, Willson J K, Vogelstein B. Science. 1990;249:912–915. doi: 10.1126/science.2144057. [DOI] [PubMed] [Google Scholar]
- 16.Kern S E, Pietenpol J A, Thiagalingam S, Seymour A, Kinzler K W, Vogelstein B. Science. 1992;256:827–830. doi: 10.1126/science.1589764. [DOI] [PubMed] [Google Scholar]
- 17.Wang P, Wu P, Siegel M I, Egan R W, Billah M M. J Biol Chem. 1995;270:9558–9563. doi: 10.1074/jbc.270.16.9558. [DOI] [PubMed] [Google Scholar]
- 18.Bartek J, Iggo R, Gannon J, Lane D P. Oncogene. 1990;5:893–899. [PubMed] [Google Scholar]
- 19.Bartek J, Bartkova J, Vojtesek B, Staskova Z, Lukas J, Rejthar A, Kovarik J, Midgley C A, Gannon J V, Lane D P. Oncogene. 1991;6:1699–1703. [PubMed] [Google Scholar]
- 20.Legros Y, Meyer A, Ory K, Soussi T. Oncogene. 1994;9:3689–3694. [PubMed] [Google Scholar]
- 21.Moos P J, Fitzpatrick F A. Cell Growth Differ. 1998;9:687–697. [PubMed] [Google Scholar]
- 22.Schena M, Shalon D, Heller R, Chai A, Brown P O, Davis R W. Proc Natl Acad Sci USA. 1996;93:10614–10619. doi: 10.1073/pnas.93.20.10614. [DOI] [PMC free article] [PubMed] [Google Scholar]
- 23.Eisen M B, Spellman P T, Brown P O, Botstein D. Proc Natl Acad Sci USA. 1998;95:14863–14868. doi: 10.1073/pnas.95.25.14863. [DOI] [PMC free article] [PubMed] [Google Scholar]
- 24.Lowe S W, Ruley H E, Jacks T, Housman D E. Cell. 1993;74:957–967. doi: 10.1016/0092-8674(93)90719-7. [DOI] [PubMed] [Google Scholar]
- 25.Fritsche M, Haessler C, Brandner G. Oncogene. 1993;8:307–318. [PubMed] [Google Scholar]
- 26.Shaulsky G, Goldfinger N, Tosky M S, Levine A J, Rotter V. Oncogene. 1991;6:2055–2065. [PubMed] [Google Scholar]
- 27.Cagen L M, Fales H M, Pisano J J. J Biol Chem. 1976;251:6550–6554. [PubMed] [Google Scholar]
- 28.Ohno K, Hirata M, Narumiya S, Fukushima M. Eicosanoids. 1992;5:81–85. [PubMed] [Google Scholar]
- 29.van Iersel M L, Cnubben N H, Smink N, Koeman J H, van Bladeren P J. Biochem Pharmacol. 1999;57:1383–1390. doi: 10.1016/s0006-2952(99)00048-9. [DOI] [PubMed] [Google Scholar]
- 30.Liu H, Lightfoot R, Stevens J L. J Biol Chem. 1996;271:4805–4812. [PubMed] [Google Scholar]
- 31.Parker J. Prostaglandins. 1995;50:359–375. doi: 10.1016/0090-6980(95)00136-0. [DOI] [PubMed] [Google Scholar]
- 32.Rossi A, Kapahi P, Natoli G, Takahashi T, Chen Y, Karin M, Santoro M G. Nature (London) 2000;403:103–108. doi: 10.1038/47520. [DOI] [PubMed] [Google Scholar]
- 33.Calmels S, Hainaut P, Ohshima H. Cancer Res. 1997;57:3365–3369. [PubMed] [Google Scholar]
- 34.Wu H H, Momand J. J Biol Chem. 1998;273:18898–18905. doi: 10.1074/jbc.273.30.18898. [DOI] [PubMed] [Google Scholar]
- 35.Hainaut P, Milner J. Cancer Res. 1993;53:4469–4473. [PubMed] [Google Scholar]
- 36.Pinhasi-Kimhi O, Michalovitz D, Ben-Zeev A, Oren M. Nature (London) 1986;320:182–184. doi: 10.1038/320182a0. [DOI] [PubMed] [Google Scholar]
- 37.Hinds P W, Finlay C A, Frey A B, Levine A J. Mol Cell Biol. 1987;7:2863–2869. doi: 10.1128/mcb.7.8.2863. [DOI] [PMC free article] [PubMed] [Google Scholar]
- 38.Finlay C A, Hinds P W, Tan T H, Eliyahu D, Oren M, Levine A J. Mol Cell Biol. 1988;8:531–539. doi: 10.1128/mcb.8.2.531. [DOI] [PMC free article] [PubMed] [Google Scholar]
- 39.Zerrahn J, Deppert W, Weidemann D, Patschinsky T, Richards F, Milner J. Oncogene. 1992;7:1371–1381. [PubMed] [Google Scholar]
- 40.Sepehrnia B, Paz I B, Dasgupta G, Momand J. J Biol Chem. 1996;271:15084–15090. doi: 10.1074/jbc.271.25.15084. [DOI] [PubMed] [Google Scholar]
- 41.Ohno K, Fukushima M, Fujiwara M, Narumiya S. J Biol Chem. 1988;263:19764–19770. [PubMed] [Google Scholar]
- 42.Santoro M G, Garaci E, Amici C. Proc Natl Acad Sci USA. 1989;86:8407–8411. doi: 10.1073/pnas.86.21.8407. [DOI] [PMC free article] [PubMed] [Google Scholar]
- 43.Eberhart C E, Coffey R J, Radhika A, Giardiello F M, Ferrenbach S, DuBois R N. Gastroenterology. 1994;107:1183–1188. doi: 10.1016/0016-5085(94)90246-1. [DOI] [PubMed] [Google Scholar]
- 44.Kargman S L, O'Neill G P, Vickers P J, Evans J F, Mancini J A, Jothy S. Cancer Res. 1995;55:2556–2559. [PubMed] [Google Scholar]
- 45.Kutchera W, Jones D A, Matsunami N, Groden J, McIntyre T M, Zimmerman G A, White R L, Prescott S M. Proc Natl Acad Sci USA. 1996;93:4816–4820. doi: 10.1073/pnas.93.10.4816. [DOI] [PMC free article] [PubMed] [Google Scholar]
- 46.Santoro M G, Philpott G W, Jaffe B M. Nature (London) 1976;263:777–779. doi: 10.1038/263777a0. [DOI] [PubMed] [Google Scholar]
- 47.Fitzpatrick F A, Waynalda M A. Biochemistry. 1981;20:6129–6134. doi: 10.1021/bi00524a033. [DOI] [PubMed] [Google Scholar]
- 48.Fitzpatrick F A, Wynalda M A. J Biol Chem. 1983;258:11713–11718. [PubMed] [Google Scholar]
- 49.Ohno K, Fujiwara M, Fukushima M, Narumiya S. Biochem Biophys Res Commun. 1986;139:808–815. doi: 10.1016/s0006-291x(86)80062-6. [DOI] [PubMed] [Google Scholar]
- 50.Narumiya S, Fukushima M. Biochem Biophys Res Commun. 1985;127:739–745. doi: 10.1016/s0006-291x(85)80005-x. [DOI] [PubMed] [Google Scholar]
- 51.Chen Y, Morrow J D, Roberts L J, II. J Biol Chem. 1999;274:10863–10868. doi: 10.1074/jbc.274.16.10863. [DOI] [PubMed] [Google Scholar]
- 52.Honn K V, Marnett L J. Biochem Biophys Res Commun. 1985;129:34–40. doi: 10.1016/0006-291x(85)91398-1. [DOI] [PubMed] [Google Scholar]
- 53.Khan Q A, Vousden K H, Dipple A. Carcinogenesis. 1997;18:2313–2318. doi: 10.1093/carcin/18.12.2313. [DOI] [PubMed] [Google Scholar]
- 54.Jackson A L, Loeb L A. Semin Cancer Biol. 1998;8:421–429. doi: 10.1006/scbi.1998.0113. [DOI] [PubMed] [Google Scholar]


