Abstract
Diseases are biological processes, and molecular imaging with positron emission tomography (PET) is sensitive to and informative of these processes. This is illustrated by detection of biological abnormalities in neurological disorders with no computed tomography or MRI anatomic changes, as well as even before symptoms are expressed. PET whole body imaging in cancer provides the means to (i) identify early disease, (ii) differentiate benign from malignant lesions, (iii) examine all organs for metastases, and (iv) determine therapeutic effectiveness. Diagnostic accuracy of PET is 8–43% higher than conventional procedures and changes treatment in 20–40% of the patients, depending on the clinical question, in lung and colorectal cancers, melanoma, and lymphoma, with similar findings in breast, ovarian, head and neck, and renal cancers. A microPET scanner for mice, in concert with human PET systems, provides a novel technology for molecular imaging assays of metabolism and signal transduction to gene expression, from mice to patients: e.g., PET reporter gene assays are used to trace the location and temporal level of expression of therapeutic and endogenous genes. PET probes and drugs are being developed together—in low mass amounts, as molecular imaging probes to image the function of targets without disturbing them, and in mass amounts to modify the target's function as a drug. Molecular imaging by PET, optical technologies, magnetic resonance imaging, single photon emission tomography, and other technologies are assisting in moving research findings from in vitro biology to in vivo integrative mammalian biology of disease.
Watson and Crick's elucidation of DNA in 1958 initiated a time in which biological and physical scientists would strive to unravel the genetic code and its regulated expression that is the basis of development and maintenance of phenotypic function of all cells of an organism. At this time, there is an intense exploration to determine patterns of gene expression that encode for normal biological processes such as replication, migration, signal transduction of cell communication, and many other functions cells perform. There is also a growing basis for diseases resulting from alterations in normal regulation of gene expression that transition cells to phenotypes of disease. These alterations in gene expression can result from interactions with the environment, hereditary deficits, developmental errors, and aging processes. As a result, physical, biological and medical sciences are working together to identify fundamental errors of disease and develop molecular corrections for them. The name given to this broad field of endeavor is “Molecular Medicine.”
As part of the evolving concept of molecular medicine, molecular imaging technologies are being developed to examine the integrative functions of molecules, cells, organ systems, and whole organisms. The organisms range from viruses and bacteria to higher order species, including humans, but in each case molecular imaging is used to examine the structure and regulatory mechanisms of their organized functions. The system studied may be a protein with affector sites through which functions of the protein are altered by interactions with other molecules, or an organ system such as liver or brain, in which collections of cells function as an integrated system based on molecular mechanisms through which intra- and intercellular functions are performed.
Molecular imaging technologies use molecular probes or interactions with molecules. Many different technologies have been and continue to be developed to image the structure and function of systems, such as x-ray diffraction, electron microscopy, autoradiography, optical imaging, positron emission tomography (PET), magnetic resonance imaging (MRI), x-ray computed tomography (CT), and single photon emission computed tomography, with unique applications, as well as advantages and limitations to each.
This article focuses on one of these molecular imaging technologies, PET, and its role in imaging integrative mammalian biology of organ systems and whole organisms from mouse to human in the context of living, functioning systems. Normal biological processes and their failure in disease are the targets of PET. An overview is provided with examples to illustrate specific points.
Principles of PET.
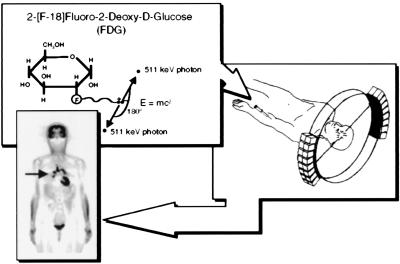
PET is an analytical imaging technology developed (1–5) to use compounds labeled with positron emitting radioisotopes as molecular probes to image and measure biochemical processes of mammalian biology in vivo (Fig. 1). The only radioisotopes of oxygen (14O, 15O), nitrogen (13N), and carbon (11C) that can be administered to a subject and detected externally are all positron emitters. There is no positron emitter of hydrogen, so fluorine-18 is used as a hydrogen substitute. Positron emitters of Cu, Zn, K, Br, Rb, I, P, Fe, Ga and others are also used.
Figure 1.
Principles of PET. A biologically active molecule is labeled with a positron emitting radioisotope as in the example FDG. FDG is injected intravenously, distributes throughout the body via bloodstream, and enters into organs, where it traces transport and phosphorylation of glucose. Positrons emitted from the nucleus of F-18 are antielectrons that travel a short distance and combine with an electron, and annihilation occurs with their masses converted into their energy equivalent (E = mc2) through emission of two 511-keV photons 180° apart. The two 511-keV photons are electronically detected as a coincidence event when they strike opposing detectors simultaneously. The figure illustrates one line of coincidence detection, but in an actual tomograph, 6–70 million detector pair combinations record events from many different angles around subject simultaneously. After correction for photon attenuation, tomographic images of tissue concentration are reconstructed. “Blocks” of detectors are arranged around the circumference, with each containing 32–64 detector elements, for a total of tens of thousands of elements. PET scanners provide hundreds of tomographic image planes of either selected organ or entire body. A single 6-mm-thick longitudinal section is shown from a woman with metastasis bilaterally to lung (arrow) from previously treated ovarian cancer. Black is highest metabolic rate in image. Human PET scanner resolution is about 5–6 mm in all three dimensions. Reprinted with permission from ref. 31.
Molecular probes for PET are developed by first identifying a target process to be studied and then synthesizing a positron labeled molecule through which an assay can be performed. Because PET cannot provide direct chemical analysis of reaction products in tissue, labeled molecules are used that trace a small number of steps (i.e., one to four) of a biochemical process so that kinetic analysis can be used to estimate the concentration of reactants and products over time and, from this, reaction rates. The fundamental principles of assays and molecular probes used in them typically originate from biochemical, biological, and pharmaceutical sciences. Biochemists develop them to isolate and accurately measure a limited number of steps in a biochemical pathway. Drugs are designed to have limited interactions because the goal is to modify the function of a key step in a biological process with minimal interaction with other processes.
In a typical molecular assay, a positron-labeled probe is injected intravenously, and PET scans provide measures of the tissue concentration of the probe and labeled products over time. These data are combined with a measure of the time course of the plasma probe concentration, representing its delivery to tissue, and processed with a compartmental model containing equations describing the transport and reaction processes the probe undergoes. The result is an image of the rate of the process under study. Probes are synthesized in very low mass amounts so as not to exert mass effects on the biological processes measured. Common tissue concentrations of PET probes are in the range of pico- to femtomoles per gram. Over 500 molecular imaging probes have been developed and consist of various labeled enzyme and transporter substrates, ligands for receptor systems, hormones, antibodies, peptides, drugs (medical and illicit), and oligonucleotides.
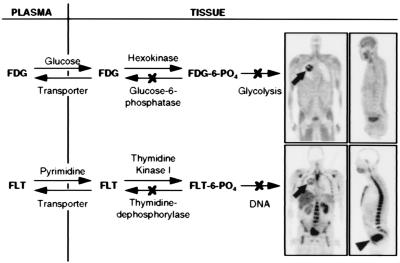
Two molecular probes will be used to illustrate PET assays. The first is a F-18-labeled glucose analog, 2-[F-18]fluoro-2-deoxy-d-glucose (FDG), to isolate facilitated transport and hexokinase mediated phosphorylation of glucose (Fig. 2). The end product FDG-6-PO4 is not a significant substrate for subsequent reactions and is retained in the cell in proportion to rate of glycolysis. The tracer kinetic model consists of an equation reflecting forward and reverse transport between plasma and tissue, and phosphorylation (6–9). The differences in transport and phosphorylation between glucose and FDG are accounted for by using the principles of competitive substrate kinetics in a term referred to as the “lumped constant” (6). This method for imaging glycolysis was originally developed by Sokoloff et al. (6) by using 2-deoxy-d-[C-14]glucose (DG) and autoradiography. FDG was first synthesized by Ido et al. (10). DG and FDG analogs of glucose are formed by replacing the OH in the 2 position of glucose with a H or F, respectively.
Figure 2.
Tracer kinetic models for FDG and FLT. Arrows show forward and reverse transport between plasma and tissue, phosphorylation and dephosphorylation. Both FDG and FLT phosphates are not significant substrates for dephosphorylation or further metabolism at normal imaging times of 40–60 min after injection. Models taking dephosphorylation reaction into account at much later imaging times have been developed (7, 9). Images are 6-mm-thick longitudinal tomographic sections of a patient with a lung tumor (arrows), with high glucose metabolism and DNA replication. The rest of the images show normal distribution of glucose utilization and DNA replication, exceptions being clearance of both tracers to bladder (arrowhead) and, in the case of FLT, the glucuronidation by hepatocytes (12) in liver.
Interestingly, DG was originally developed as a drug to block accelerated rates of glycolysis in cancer through buildup of DG-6-PO4 to inhibit phosphorylation of glucose (11). Although DG in pharmacologic doses was effective in blocking glycolysis in cancer, it was unsuccessful as a drug because it also blocked glycolysis in the brain, an organ that cannot switch to alternative substrates, at least not in adults. In imaging studies, the mass of FDG is far below levels that produce pharmacologic effects. FDG is commonly used with PET to image normal and altered metabolic states of disease processes of brain and heart, as well as cancer and other disease processes. Clinical studies employ qualitative studies based on what has been learned from quantitative investigations.
The second example is a F-18 labeled deoxy analog of thymidine, 3′-deoxy-3′-[F-18]fluorothymidine (FLT) (12). This analog behaves in a similar manner to FDG (Fig. 2), except the processes being examined are thymidine transport and phosphorylation, as an estimate of DNA replication and, from this, cell proliferation. FLT originated from pharmacological studies to develop drugs that would inhibit DNA replication, such as in the case of another thymidine analog, AZT, for treatment of AIDS.
Thus, FDG and FLT originated from pharmacologic agents that had selective biochemical interactions. These properties made them candidates as molecular imaging probes when used in nonpharmacologic amounts.
Electronic Generators of PET Probes.
Because the commonly used positron radioisotopes have short half-lives, 15O (2 min), 13N (10 min), 11C (20 min), and 18F (1.8 h), a practical solution for their production and labeling of molecular imaging probes had to be invented. This was partially accomplished by the development of miniaturized, self-shielded, low-energy (6–17 MeV) proton cyclotrons for PET. The second component was the development of automated, unit operation (solvent and reagent addition, solution transfer, column separation, etc.) chemical synthesizer technology for producing labeled imaging probes. These unit operations can be configured to meet the needs of a particular synthesis (13). This automated labeling technology is similar to that used in DNA and peptide synthesizers and combinatorial chemistry. The minicyclotron and chemical synthesizer technologies were then integrated into a single system concept under control of a PC (13). PET radiopharmacies with these “electronic generators” exist throughout America, Europe, and Asia.
PET Imaging Is Sensitive to the Biological Processes of Disease.
Because disease is a biological process, molecular imaging provides a sensitive and informative means to identify, study, and diagnose the biological nature of disease early in and throughout its evolution, as well as to provide biological information for development and assessment of therapies. The use of FDG to identify and characterize disease by alterations in glucose metabolism in Alzheimer's and cardiovascular diseases, as well as cancer, will be used to illustrate some of the clinical applications of PET.
Dementia.
In the brain, glucose metabolism provides about 95% of ATP required for the brain to function properly (14). Thus, FDG provides a good general molecular imaging probe to assess the ATP-dependent functions of the brain. Fig. 3 illustrates this for normal functions (15, 16).
Figure 3.
PET studies of glucose metabolism to map human brain's response in performing different tasks. Subjects looking at a visual scene activated visual cortex (arrow), listening to a mystery story with language and music activated left and right auditory cortices (arrows), counting backwards from 100 by sevens activated frontal cortex (arrows), recalling previously learned objects activated hippocampus bilaterally (arrows), and touching thumb to fingers of right hand activated left motor cortex and supplementary motor system (arrows). Images are cross-sections with front of brain at top. Highest metabolic rates are in red, with lower values from yellow to blue.
Early clinical diagnosis of organic dementias remains difficult, as does differentiating specific dementias from each other and from benign reductions in short-term memory and cognitive decline in the elderly. Over 4 million Americans now have Alzheimer's disease, with healthcare costs of 50–70 billion dollars per year (17). As “baby boomers” age, the incidence rate for Alzheimer's disease will rise to over 12 million. Although the molecular errors that originate Alzheimer's disease remain unknown, effective treatments are now being developed, such as cholinesterase inhibitors, that act as support therapies much like l-dopa for Parkinson's disease. These therapies are most effective early in the progressive disease course, the time at which the clinical diagnosis is least accurate.
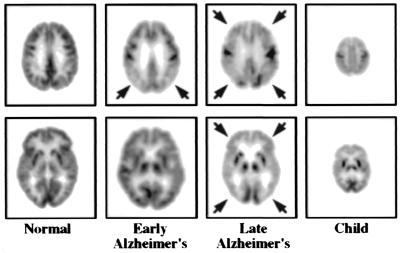
PET provides an early diagnosis of Alzheimer's (Fig. 4) and can differentiate it from other causes of dementia or benign effects of aging (18–21). In longitudinal studies (22), PET detected Alzheimer's with an accuracy of 93%, three years earlier than convention clinical diagnostic methods.
Figure 4.
PET study of glucose metabolism in Alzheimer's disease. The “early Alzheimer's” is at stage of “questionable Alzheimer's disease” and illustrates characteristic metabolic deficits in parietal cortex (arrows) of the brain. In “late Alzheimer's,” metabolic deficit has spread throughout areas of cortex (arrows), sparing subcortical (e.g., internal) structures (bottom image), and primary motor and sensory areas, such as visual (bottom image) and motor cortices (top image). At late stage disease, metabolic function in Alzheimer's is similar to that of newborn, shown to the far right, which underlies their similar behavior and functional capacity. MRI studies were normal. Reprinted with permission from ref. 31.
Detection of silent, asymptomatic disease.
Many diseases exist in silent, asymptomatic phases for considerable time. Biochemical and transport reserves, as well as redundancies and compensatory responses within biological processes of organ systems, keep errors of disease from altering organ functions, up to a certain limit. Although symptoms are not expressed, biological alterations of disease are present and can be detected with molecular imaging probes.
PET studies of two hereditary diseases, Huntington's disease and familial Alzheimer's, illustrate detection of silent, asymptomatic disease. Studying asymptomatic children of Huntington's patients, Mazziotta et al. (23) identified metabolic deficits in the caudate and putamen of the brain in the fraction of patients predicted by Mendelian genetics to carry the Huntington gene. Additionally, all patients who went on to become symptomatic had preceding metabolic abnormalities in their asymptomatic stage. The longitudinal nature of this study demonstrated these metabolic abnormalities to be detectable with PET about 7 years before clinical symptoms were expressed.
Small et al. (24) and Reiman et al. (25) compared metabolic findings with PET to the apolipoprotein E-4 (APOE-4) risk factor for Alzheimer's in asymptomatic subjects in families with familial Alzheimer's. They found metabolic deficits in the parietal cortex, characteristic of Alzheimer's, highly correlated with the presence of APOE-4. Estimates of Small et al. (24) indicate that these deficits were identified with PET about 5 years before symptoms occurred.
Metabolic viability of cardiac tissue.
Distinguishing reversible from irreversible damage to cardiac tissue in patients with coronary artery disease is a challenging biological question. Schelbert (26) developed a method with PET for detecting early coronary artery disease and determining which patients with reduced blood flow had retained glucose metabolism in affected areas of myocardium, indicating tissue was alive and recoverable through revascularization by bypass surgery or angioplasty. Patients with reduced flow and metabolism were found to have irreversible damage. In conventional assessments without PET, 25–35% of coronary artery disease patients who undergo revascularization have no improvement in cardiac function because of irreversible tissue damage. Although demonstrated in patients, this PET method was based on the biochemical principle that glucose is a protective substrate for generating ATP in oxygen limited states to maintain the viability of tissue, even though local cardiac work is limited or lost (27).
Cancer.
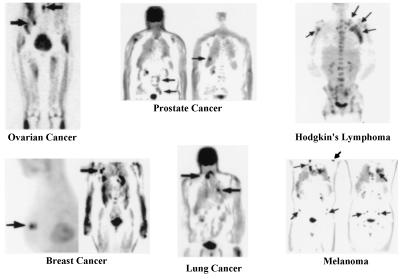
Cancer biologists have known for decades that neoplastic degeneration is associated with increases in glycolysis (Fig. 5) caused by progressive loss of the tricarboxylic acid cycle and also activation of the hexose monophosphate shunt to provide carbon backbone for synthesis of DNA and RNA required for high cell proliferation rates of tumors (28). As previously mentioned, this led to development of DG as a potential drug for cancer. A complete loss of the tricarboxylic acid cycle can amplify glucose consumption 19-fold per ATP because only two ATPs are generated by metabolism of a molecule of glucose to lactate versus 38 ATPs with its complete oxidation to CO2 and H2O (29). This, and activation of the hexose monophosphate shunt, leads to progressive increases in glucose consumption with increasing neoplastic degeneration and provides high levels of signal in FDG imaging of tumors for delineating them from surrounding tissue and detecting small lesions.
Figure 5.
PET images of glucose metabolism in various types of cancers. Study illustrates that increased glycolysis is a common property of cancer, independent of organ of origin. In breast example, a 6-mm lesion is just behind a 10-mm one. Mammogram was normal, and tumor had high expression of HER-2/neu oncogene. Arrows point to some tumors (32). Reprinted with permission from ref. 31.
Although cancer begins within an organ system, the critical factor in treatment and prognosis of patients is metastases to other organ systems. The development of PET whole body imaging (30) provided an accurate way to examine all organ systems of the body for the presence of primary and metastatic disease in a single study.
Metabolic information from PET provides advantages over anatomic information from x-ray films, ultrasound, CT, and MRI because PET can:
- 1.
Differentiate benign from malignant lesions. For example, 60–80% of breast and 20–40% of lung biopsies are benign because x-ray mammography, CT, and MRI have limited accuracy in separating benign from malignant processes.
- 2.
Identify the biological changes of cancer early in its course.
- 3.
Image all organ systems of the body to detect the primary tumor and determine whether metastases are present and, if so, their extent throughout the body. Because the whole body is imaged with PET, symptoms to direct an imaging procedure to a particular organ system are not required. Thus, asymptomatic disease is routinely detected.
- 4.
Differentiate malignant tissue from necrosis, edema (tissue swelling), and scarring, for accurate, early assessment of therapeutic response to continue, stop, or change therapy.
In multicenter trials for lung and colorectal cancers, melanoma and lymphoma, PET has been shown to have an 8–43% higher accuracy for detection of primary and metastatic disease vs. conventional workups in head-on comparisons and to change the choice of therapy selected by conventional evaluations in 20–40% of cases, depending on the specific clinical question (31). About 65% of therapy changes occur because PET showed there was more extensive disease than originally determined by conventional tests whereas, in about 35% of patients, PET showed that previously diagnosed metastases were benign lesions, resulting in changes to simpler therapies, improved prognosis, and lower costs. Similar results are reported for other cancers such as breast, ovarian, head, neck, and renal.
Creating a New Experimental Paradigm.
Biology and imaging are merging into laboratory settings familiar to biologist. Biologists have established rodent models, for studying mammalian biology of disease by “knocking in” and “knocking out” genes, transferring human cells of disease and various trophic factors to the rodent. These models are used to study the genotypic basis of normal biological processes and those of disease, as well as to develop new therapies, including gene therapies. These activities will be continually refining the genetic engineering approach to modeling human disease.
Biologists and physical scientists have established a line of investigation from the genome, gene expression, protein structure and function, cell and tissue culture, and simple animal systems to in vitro studies in rodents. In experiments involving rodents, it is important to have technologies that can perform the same types of biological assays in vivo as those used in vitro. In vivo studies allow biological investigations to assess progressive developmental and degenerative changes over time within the functioning organism, as well as assessment of therapeutic responses, all in the same animal. This produces more accurate results from fewer animals. To meet this requirement, imaging scientists using various technologies, such as PET, optical imaging, and MRI, are developing in vivo assays important and familiar to biologists, such as ones for imaging and measuring transcription and translation of gene expression from endogenous and transplanted genes, as well as transport, metabolism, and synthesis of substrates, and ligand/receptor interactions of cell communication within organ systems. Molecular imaging is providing the means to link in vitro experimental paradigms to in vivo studies.
MicroPET.
PET imaging systems designed for rodents focus on a new experimental paradigm of in vivo integrative mammalian biology. The goal is to provide a similar in vivo molecular imaging capability in mouse, rat, monkey, and human. This is a very challenging exercise, considering the 2,000-fold reduction in size from human to mouse.
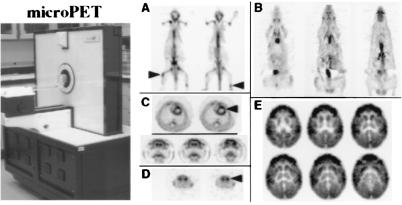
The microPET scanner will be used to illustrate the development of a system designed for small animal imaging. MicroPET I, developed by Cherry and colleagues (32, 33), has an image resolution of 1.5 mm in all three dimensions. Because the axial field of view of the scanner is only 1.8 cm, total body studies in mice and rats are performed by computer-controlled movement of the bed through the scanner gantry, as is done with patients in clinical PET scanners. Fig. 6 illustrates image quality in local organ and total body tomographic images with microPET studies in mice, rats, and monkeys. Cherry et al. (34) are building a microPET II with a volumetric resolution of about 1 μl or less (six times better than images in Fig. 6), increasing efficiency about eight times microPET I, and increasing the axial field of view to 8 cm.
Figure 6.
Image quality of microPET I. (A) Two 1.5-mm-thick longitudinal whole body sections of a 25-g mouse using [F-18]fluoride ion to image skeletal system of prostate cancer mouse model with bone metastases (arrows). (B) Longitudinal whole body FDG images of glucose metabolism in normal 250-g rat. (C Upper) Cross sections through chest of rat showing glucose metabolism in left (arrow) and right ventricles. Left ventricle is 9 mm in diameter, with 1-mm wall thickness. Right ventricle is thinner, and metabolic rate is 1/3 left. (Lower) Coronal sections of glucose metabolism in rat brain weighing 1 g, showing cortex well separated from internal structure of striatum. (D) Images of mouse brain with [C-11]WIN 35,428 that binds to dopamine reuptake transporters showing clear separation of left and right striatum (arrow) that each weigh about 12 mg. (E) FDG brain images of two-month-old Vervet monkey with good delineation of cortical and subcortical structures. Dimension across brain is 2 cm. Cortical convolutions of brain are not seen because the young monkey has few of them. Reprinted with permission from ref. 31.
Corresponding Study Paradigms in Humans and Animals.
The following studies are used to illustrate how similar types of study paradigms can be carried out in human, monkey, rat, and mouse.
Mapping of stimulation responses in the brain.
In vivo “brain mapping” studies with tomographic imaging in humans began with PET using FDG (refs. 15 and 16; Fig. 3) in a similar way to those carried out by autoradiography in animals with [C-14]DG (6). This led to the development of the field of brain mapping with PET using FDG for metabolism and O-15 labeled H2O for rapid (≈40 sec) measures of blood flow (35) and functional MRI for imaging changes related to blood flow (36).
Fig. 7 illustrates a study using microPET I and FDG to map the response to stroking a rat's whiskers with a rod (37). The images illustrate the metabolic response in the barrel regions of cortex that receive sensory inputs from the whiskers.
Figure 7.
microPET study of whisker stimulation in rat. Whiskers on right side of face were stroked after i.v. injection of FDG. Image shows increased metabolic response (arrow) in areas of cortex receiving inputs from whiskers. Modified from ref. 31.
Parkinson's disease.
Parkinson's disease and its syndromes are the largest category of movement disorders. It is estimated that 1 in 200 people over age of 50 and 1 in 50 over age of 60 have this disease or syndromes. Animal models for these disorders often employ one of two chemicals, 1-methyl-4-phenyl-1,2,3,6-tetrahydropyridine (MPTP) or 6 hydroxydopamine, to lesion the presynaptic dopaminergic system, that is known to degenerate in Parkinson's.
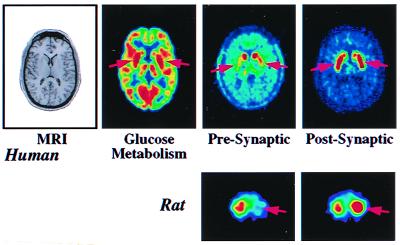
Fig. 8 illustrates multiple imaging studies of a patient with mild Parkinson's disease. MRI shows there are no structural abnormalities whereas there is a mild abnormality of increased glucose metabolism in the putamen caused by loss of regulated function in the dopaminergic neurotransmitter pathway. The change in metabolism is modest because only 15% of neurons in the putamen are dopaminergic. A more direct measure of the disease process is revealed by severe loss of presynaptic dopamine synthesis in the putamen and compensatory up-regulation of postsynaptic D2 receptors in an attempt to compensate for loss of dopamine.
Figure 8.
Images of patient with early Parkinson's disease and rat model of Parkinson's. (Upper) MRI shows there is no structural abnormality in the brain of patient. PET image of glucose metabolism shows hypermetabolic abnormality of putamen (arrows) with 10% increase over normal value. Image of presynaptic synthesis of dopamine with [F-18]fluorodopa shows a 70% reduction (arrows) whereas image of postsynaptic D2 receptors with the ligand, [F-18]fluoroethylspiperone, shows 15% elevation (up-regulation) of receptors in putamen, in an attempt to compensate for loss of presynaptic dopamine. (Lower) MicroPET images of 6-hydroxydopamine unilateral lesion in rat model of Parkinson's. Image of presynaptic dopamine transporter with [C-11]WIN 35425 shows 60% reduction on lesioned side (arrow) whereas postsynaptic D2 receptors imaged with ligand [C-11]raclopride show compensatory up-regulation of receptors (arrow) in the striatum. Opposite striatum is a control. Modified from ref. 31.
The study by Rubins et al. (38), in a rat model of Parkinson's with microPET, illustrates similar findings to those of the patient in Fig. 8. In the rat, the putamen and caudate are one structure, the striatum. Despite a striatum weight of only 25 mg, the presynaptic dopamine lesion and compensatory up-regulation of postsynaptic receptors are well visualized. The brain sizes in patients and rats are about 1,400 g and 1 g, yet the integrity of the experiment was reasonably well maintained by the use of PET systems designed for each species.
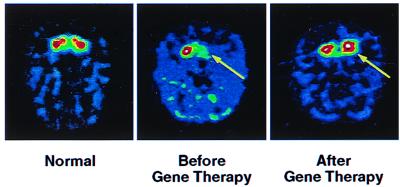
Fig. 9 illustrates PET imaging to assess viability of gene therapy for restoring dopamine synthesis in a monkey with a MPTP lesion in the striatum on one side of the brain (K. Bankiewicz, J. Eberling, J. Bringas, et al., personal communication). An adeno-associated virus containing the aromatic amino acid decarboxylase gene to produce the corresponding enzyme for synthesizing dopamine from l-dopa was stereotactically injected into MPTP-lesioned striatum. The PET study of dopamine synthesis demonstrates the virus has transferred the decarboxylase gene and that the enzyme has been transcribed and translated into an active state.
Figure 9.
Imaging gene therapy with PET in unilateral MPTP monkey model of Parkinson's. Dopamine synthesis was imaged with aromatic amino acid decarboxylase substrate, meta-[F-18]fluorotyrosine. (Left) Image of normal dopamine synthesis in caudate and putamen. (Center) Image shows unilateral dopamine MPTP-induced deficit (arrow) before gene therapy. (Right) Image shows restoration of dopamine synthesis (arrow) after gene therapy. Figure courtesy of K. Baukiewicz.
Imaging Gene Expression in Vivo.
In vivo imaging of gene expression can be directed either at genes externally transferred into cells of organ systems (transgenes) or at endogenous genes. Imaging of transgenes is used to monitor the expression of genes transferred into cells to study the normal regulation of gene expression or that of gene therapy. Imaging endogenous gene expression can be used to study the expression of genes during development, aging, responses to environmental stimuli, alterations in gene expression that transition normal phenotypes of cells to those of disease, or responses of endogenous gene expression to therapy. One approach to imaging endogenous gene expression with PET being developed (39–41) employs F-18-labeled oligodeoxynucleotides consisting of short (≤15) single stands of nucleotides. This is aimed at converting in situ hybridization to in vivo hybridization.
Imaging transgene expression.
Genes are transferred into a subject via a transfer vehicle such as an adenovirus, adeno-associated virus, retrovirus, liposome, or as naked DNA. The imaging objective is to trace the location and temporal changes in the magnitude of expression of the transferred gene. Examples to illustrate this approach employ an adenovirus as the vehicle with the objective of tracking a therapy gene. The approach involves the conversion of techniques developed in biological sciences, in the use of a “reporter gene” to a PET reporter gene (PRG) and PET reporter probe (PRP) approach (Fig. 10). The PRG is linked to a therapeutic gene by a common promoter, in the examples used, the cytomegalovirus promoter. Promoters initiate transcription of genes. Thus, when promotion of gene expression to transcription of mRNA occurs for the therapy gene, it also occurs for the PRG. The mRNA of PRG is then translated to a protein product that is the target of the PRP used to image expression of the PRG.
Figure 10.
Illustration of PRG/PRP for imaging gene expression. Viruses containing reporter and therapy genes are intravenously injected and localize gene transfer to liver. PRG is transcribed to mRNA and translated to a protein product that is the target of the PRP after injected into a tail vein.
Two PRG/PRP approaches are used to illustrate the concept. In the first, the protein product of PRG expression is an enzyme, herpes simplex virus thymidine kinase (HSV1-TK†), and PRP is a F-18-labeled analog of ganciclovir, a drug used to treat HSV, 8-[F-18]fluoroganciclovir (FGCV), or [F-18]fluoropenciclovir. In the second, the PRG protein product is a receptor, the dopamine D2 receptor, and the PRP is a F-18 ligand that binds to this receptor, [F-18]fluoroethylspiperone (FESP), previously developed by Satyamurthy et al. (42) for receptor studies in brain.
In both approaches, the PRG is incorporated into the genome of an adenovirus, which, after tail vein injection in the mouse, localizes greater than 90% to liver. Subsequently, the PRP is injected intravenously at various points in time to localize and estimate the degree of expression of the PRG (Fig. 10).
In the case in which HSV1-tk is used as the PRG, FGCV is injected intravenously, diffuses into cells, and, if there is no gene expression, diffuses out and is cleared to bladder. If HSV1-tk gene expression is present, FGCV will be phosphorylated by the HSV1-TK enzyme to the monophosphate, and then by cellular kinases to di- and triphosphates. The phosphorylated FGCV is then trapped in the cell as a record of gene expression. The same process occurs with [F-18]fluoropenciclovir (FPCV). One molecule of HSV1-TK can phosphorylate many molecules of FGCV or FPCV, so there is an amplifying effect in this enzyme mediated approach. Several different substrates for HSV1-TK have been developed, such as I-131- and I-124-labeled 2′-fluoro-2′-deoxy-1-β-d-arabinofuranosyl-5-iodouracil (44, 45), FGCV (41, 43, 46, 47), and penciclovir labeled with F-18 in the 8 position (48, 49), as well as on the side chain (50, 51).
In the D2 receptor/FESP approach (52), gene expression is assayed by a ligand/receptor interaction, with accumulation of ligand dependent on the amount of D2 receptor produced from expression of this PRG. In the D2/FESP approach, a single ligand molecule is bound to a single receptor; there is no amplifying factor, as with HSV1-TK. No significant dissociation of this ligand from the receptor occurs during the experimental period (42).
Studies in mice demonstrate location and degree of reporter gene expression can be repeatedly imaged over time. Examples alternate between HSV1-tk/FGCV or FPCV and D2/FESP, but, in each case, the same result has been obtained for both PRGs.
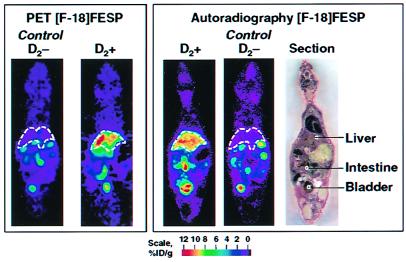
MacLaren et al. (52) performed studies in which either a control virus without the D2 PRG (D2−) or a virus containing the D2 receptor gene (D2+) was injected in the tail vein of mice. Two days later, the control animal or D2+ animal were injected with FESP to image gene expression with PET, followed by imaging with autoradiography. Excellent correspondence was found in the amount of F-18 activity in liver in comparable longitudinal sections between the two imaging techniques (Fig. 11). Some activity also appears in the gastrointestinal tract and bladder, as route of elimination of FESP, as well as diffusely throughout the body.
Figure 11.
microPET and autoradiography studies of PRG/PRP imaging of gene expression in the same mouse. PRG is D2 receptor, and PRP is FESP. (Left) MicroPET image of a single 1.5-mm-thick longitudinal section of living control mouse negative for D2 receptor (D2−) PRG, showing no significant retention of PRP in liver (dashed lines). In animal carrying dopamine receptor reporter gene (D2+), there is retention of FESP PET reporter probe in liver reflecting gene expression. Images were taken 50 min after injection of FESP and 2 days after virus administration. (Right) After microPET imaging, animals were killed, sectioned, and imaged with autoradiography. Photograph of section is at far right. Color scales represent percent injected dose of PRP per gram (% ID/g) of tissue, with red the highest value (51). Reprinted with permission from ref. 31.
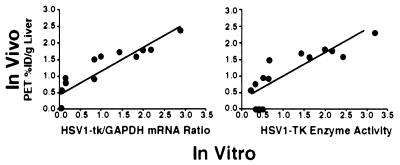
Gambhir et al. (43) compared in vivo microPET measures of gene expression in mice to in vitro measurements of reporter gene expression in the same animals, when the amount of virus was varied. The HSV1-tk/FGCV reporter system was used in these studies. In vitro measurements consisted of assays of mRNA expression by Northern blot analysis and biochemical measures of HSV1-TK enzyme activity in liver tissue. Results show a linear relationship between in vivo measure of gene expression with PET and in vitro measurements of HSV1-tk mRNA and enzyme (Fig. 12) over range investigated. The same type of result was found for the D2/FESP PRG/PRP system between in vivo PET comparisons to in vitro Scatchard analysis of D2 receptors (52). It is interesting to note that there was no correlation between amount of virus injected and amount of expression measured by any of the approaches (43), indicating that external measures of the amount of virus given are not a good measure of dosing at the tissue site within the target organ. This is a common finding in external drug delivery, caused by a plethora of systemic effects on drugs, and exemplifies another important use of PET to directly assess drug dosing at the target site within an organ system in vivo, be they conventional drugs or gene therapies.
Figure 12.
Comparison of gene expression measured in vivo with microPET to direct in vitro measures of HSV1-tk mRNA and HSV1-TK enzyme activity in liver tissue (42).
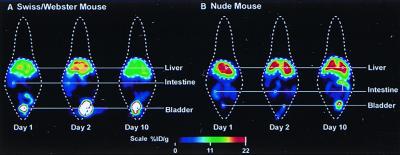
Fig. 13 illustrates monitoring gene expression in the same mouse over time in a wild type versus a nude mouse with an immature immune system. In the wild-type mouse, gene expression increases from day 1 to day 2, post-viral administration, then decreases at day 10 because of destruction of the virus and HSV-tk enzyme by the immune system. In the nude mouse, gene expression increases from day 1 to 2 and remains high because of lack of a mature immune system.
Figure 13.
Repeated imaging of gene expression in the same mouse. The PRG is a point-mutated HSV1-tk optimized for ganciclovir and penciclovir. PRG is FPCV. The combination of the point mutation and FPCV provides a signal-to-noise improvement of 6 over HSV1-tk and FGCV. The Swiss/Webster mouse is a wild type, and the nude mouse has immature immune system. % ID is percent injected dose of FPCV per gram of tissue.
The PRG approach is also used to image endogenous gene expression by transferring a PRG with the same promoter as an endogenous gene of interest into cells. This can be accomplished by incorporating a PRG into an embryonic stem cell and producing a transgenic animal in which the PRG is in all cells or by transferring the PRG selectively to cells in the animal with a virus. The use of multiple PRGs with different promoters allows the use of this approach to examine multigene interactions in vivo.
Combining the Design of Molecular Imaging Probes and Drugs.
Relationships have been built to couple diagnostic radiopharmaceuticals (i.e., molecular imaging probes) and therapeutic pharmaceuticals together by combining the goals of molecular diagnostics and molecular therapeutics. These relationships involve PET, biological and physical sciences in the academic setting, and pharmaceutical, radiopharmaceutical, and imaging industries in the commercial one. The approaches focus on development and use of common molecules or analogs of one another: molecular imaging probes in low mass to image and measure the target function, and then the mass of the molecule is increased to pharmacologic levels to modify the target function. The desired properties of molecular imaging probes and drugs common to both are: small molecule; high affinity for target and low affinity for nontargets; sufficient lipophilicity or carrier system to cross cell membranes; low peripheral metabolism. Differences are that the target to background must be greater than one for imaging probes but not drugs, and, although plasma clearance times of minutes to hours are desired for imaging, drug clearance times of hours to days are preferred.
The pharmaceutical industry is providing both conventional and automated ways to rapidly synthesize thousands of different compounds by using such approaches as combinatorial and parallel chemistry and in vitro screening to smaller numbers of different compounds with specific properties. Merging the goals of molecular imaging probes and drugs together at the beginning of this process is allowing molecules to be produced and screened for both purposes.
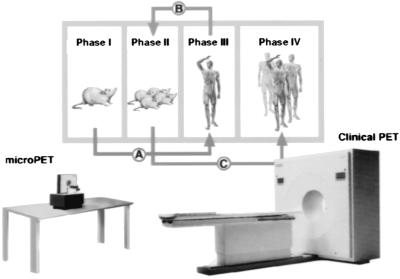
Molecular imaging probes and drugs are then further screened and evaluated with approaches, like that in Fig. 14, using mouse models of human disease evaluated with microPET, along with traditional pharmacological, biochemical, and behavioral measures. After a small number of studies in mice, initial studies in patients are performed with molecular imaging probes and labeled drugs to assess whether the findings in mice, to a first approximation, are similar to those in patients, or how they differ. When there is sufficient concordance, more detailed experiments are performed in an expanded population of mice, and then in an expanded number of patients. In this approach, PET is used in mice and patients to:
- 1.
Provide in vivo biological characterization of disease (Figs. 2, 4, 5, and 8).
- 2.
Titrate drug to disease target in tissue for accurate dosing, using a labeled form of the drug (Fig. 12).
- 3.
Provide pharmacodynamic and pharmacokinetic characterization of drugs and probes.
- 4.
Determine whether the drug properly modified the biological process of disease or restored a normal process affected by disease (Fig. 9).
Figure 14.
Model approach for discovery and evaluation process for molecular imaging probes and drugs. Modified from ref. 31.
This paradigm is benefiting from the rapid evolution of mouse models of disease by using transgenes, chimerics, and human tissue transplants. This approach enhances the manner in which biological scientists and physicians in academia and those in the pharmaceutical industry can work together in moving knowledge and applications from the basic level to patients with a better scientific foundation and to more rapidly eliminate ineffective compounds (i.e., overwhelming majority) and at a lower cost.
Merging PET and CT into a Single Device.
A new class of imaging technologies fusing two into one is now being developed. The goal is to merge anatomical and biological information into one device, procedure and image. Although PET and MRI fusion is being investigated (53), the major emphasis is on PET and x-ray CT scanners at both patient and small animal levels. Clinical PET/CT systems have been developed by Beyer et al. (54) and CTI/Siemens and by Patten et al. (55) and GE.
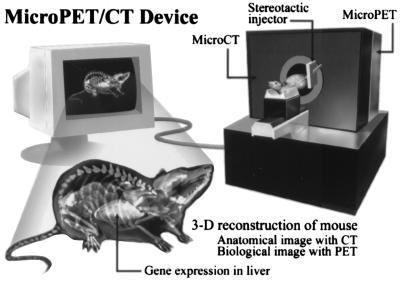
In small animal research, the goal is to provide a single device that produces a final three-dimensional image of anatomical and biological information fused together. These devices are being designed to provide high throughput in vivo differential screening of biological responses in transgenics, chimerics, cell transplants, and drug evaluations. Algorithms are being developed to analyze these three-dimensional whole animal images to automate differential screening. A system being developed by Cherry and colleagues is illustrated in Fig. 15.
Figure 15.
Design concept of small animal scanner with PET and x-ray CT combined into a single device. A stereotactic injector is attached to device for local organ injections of cells, viruses, and drugs, as well as tissue sampling for direct biochemical analysis. Reprinted with permission from ref. 31.
Conclusions
This is a time of explosive change in biology, biotechnologies, and medicine. Technology and research in biology are accelerating the emergence of molecular medicine to identify molecular errors of disease and develop novel molecular therapies.
PET is by its very nature a molecular imaging technology; it uses labeled molecules to produce images of their interactions with the molecular basis of biological processes throughout body much like pharmaceutical sciences use molecules to produce therapeutic modifications of them. Disease is a biological process in which molecular errors have occurred that cause normal well regulated function of cells to be altered or to fail. Although hereditary errors can be identified by sampling convenient cells of the body, the majority of diseases occur from alterations induced within specific organ systems. Even in hereditary diseases, although genetic errors exist in all cells, the disease-based expression is typically organ-specific.
PET, biological, and pharmaceutical sciences are joining together with common goals of building molecules that can be used to image and measure biological functions within organ systems in the living subject, and as drugs to modify the malfunction of disease. Combining these goals accelerates and improves the discovery, approval, and clinical application processes for both. In vivo microimaging laboratories for studying the integrative mammalian biology of disease are taking advantage of biology's use of genetically engineered rodents to study processes that transform cells from normal phenotypes to those of disease. Biologists benefit from this by being able to more effectively move from in vitro settings of molecules, cells, and tissue to the in vivo environment in which cellular functions are directed and constrained by requirements imposed by an organ system and whole organism. Molecular imaging provides a means to search throughout the subject in vivo to identify and study the outcomes of genetic, cell transplant, and protein manipulations by using molecular assays familiar to biologists. In patient care, great benefit is accrued from molecular imaging by providing more direct pathways from biology to the patient and by links between PET and pharmaceutical sciences in molecular diagnostics and molecular therapeutics.
Acknowledgments
Thanks are due to Diane Martin and Judy Amos in preparing the manuscript. This work was partially supported by Department of Energy Grant DE-FC03-87ER60615 and the Norton Simon Fund at the University of California, Los Angeles.
Abbreviations
- PET
positron emission tomography
- CT
computed tomography
- FDG
2-[F-18]fluoro-2-deoxy-d-glucose
- DG
2-deoxy-d-[C-14]glucose
- FLT
3′-deoxy-3′fluorothymidine
- PRG
PET reporter gene
- PRP
PET reporter probe
- HSV1-TK
herpes simplex virus thymidine kinase
- MPTP
1-methyl-4-phenyl-1,2,3,6-tetrahydropyridine
- FGCV
8-[F-18]fluoroganciclovir
- FESP
[F-18]fluoroethylspiperone
- FPCV
[F-18]fluoropenciclovir
Footnotes
This contribution is part of the special series of Inaugural Articles by members of the National Academy of Sciences elected on April 27, 1999.
By convention, tk and TK refer to the thymidine gene and enzyme, respectively.
References
- 1.Phelps M, Hoffman E, Mullani N, TerPogossian M. J Nucl Med. 1975;16:210–224. [PubMed] [Google Scholar]
- 2.Phelps M, Hoffman E, Mullani N, Higgins C, TerPogossian M. IEEE Trans Biomed Eng. 1976;NS-23:516–522. [Google Scholar]
- 3.Hoffman E, Phelps M, Mullani N, Higgins C, TerPogossian M. J Nucl Med. 1976;17:493–502. [PubMed] [Google Scholar]
- 4.Cho Z, Chan J, Eriksson L. IEEE Trans Nucl Sci. 1976;NS-23:613–622. [Google Scholar]
- 5.Derenzo S, Budinger T, Cahoon J. IEEE Nucl Sci. 1977;NS-24:544–558. [Google Scholar]
- 6.Sokoloff L, Reivich M, Kennedy C, et al. J Neurochem. 1977;28:897–916. doi: 10.1111/j.1471-4159.1977.tb10649.x. [DOI] [PubMed] [Google Scholar]
- 7.Phelps M, Huang S C, Hoffman E J, Selin C, Sokoloff L, Kuhl D E. Ann Neurol. 1979;6:371–388. doi: 10.1002/ana.410060502. [DOI] [PubMed] [Google Scholar]
- 8.Reivich M, Kuhl D, Wolf A, et al. Circ Res. 1979;44:117–127. doi: 10.1161/01.res.44.1.127. [DOI] [PubMed] [Google Scholar]
- 9.Huang S C, Phelps M, Hoffman E J, Sideris K, Selin C, Kuhl D E. Am J Physiol. 1980;238:E69–E82. doi: 10.1152/ajpendo.1980.238.1.E69. [DOI] [PubMed] [Google Scholar]
- 10.Ido T, Wan C-N, Casella J S, et al. J Labelled Compd Radiopharmac. 1978;14:175–183. [Google Scholar]
- 11.Woodward G E, Hudson M T. Cancer Res. 1954;14:599–605. [PubMed] [Google Scholar]
- 12.Shields S F, Griersonson J R, Dohmen, Dohmen B M, et al. Nat. Med. 1998. 1334–1336. [Google Scholar]
- 13.Satyamurthy N, Barrio J R, Phelps M E. Clin Positron Imaging. 1999;2:233–253. doi: 10.1016/s1095-0397(99)00034-5. [DOI] [PubMed] [Google Scholar]
- 14.Sokoloff L. In: Basic Neurochemistry. Siegel G, Agranoff B, Albers R W, Molinoff P, editors. New York: Raven; 1989. pp. 565–590. [Google Scholar]
- 15.Phelps M, Kuhl D E, Mazziotta J C. Science. 1981;211:1445–1448. doi: 10.1126/science.6970412. [DOI] [PubMed] [Google Scholar]
- 16.Greenberg J H, Reivick M, Alavi A, et al. Science. 1981;212:678–680. doi: 10.1126/science.6971492. [DOI] [PubMed] [Google Scholar]
- 17.National Institute on Aging. Progress Report on Alzheimer's Disease. Bethesda, MD: National Institute on Aging; 1996. , National Institutes of Health Publication No. 96-4137. [Google Scholar]
- 18.Duara R, Grady C, Haxby J, et al. Neurology. 1986;36:879–887. doi: 10.1212/wnl.36.7.879. [DOI] [PubMed] [Google Scholar]
- 19.Mazziotta J C, Frackowiak R S J, Phelps M. Semin Nucl Med. 1992;22:233–246. doi: 10.1016/s0001-2998(05)80118-7. [DOI] [PubMed] [Google Scholar]
- 20.Herholz K. Alzheimer Dis Assoc Disord. 1995;9:6–16. doi: 10.1097/00002093-199505000-00004. [DOI] [PubMed] [Google Scholar]
- 21.Silverman D H S, Small G W, Phelps M. Clin Positron Imaging. 1999;2:119–130. doi: 10.1016/s1095-0397(99)00020-5. [DOI] [PubMed] [Google Scholar]
- 22.Silverman, D. H. S., Chang, C. Y., Cummings, J., et al. (2000) Ann. Int. Med., in press.
- 23.Mazziotta J C, Phelps M, Huang S C, et al. New Engl J Med. 1987;316:357–362. doi: 10.1056/NEJM198702123160701. [DOI] [PubMed] [Google Scholar]
- 24.Small G W, Mazziotta J C, Collins M T, et al. J Am Med Assoc. 1995;273:942–947. [Google Scholar]
- 25.Reiman E M, Caselli R J, Yun L S, et al. N Engl J Med. 1996;334:752–758. doi: 10.1056/NEJM199603213341202. [DOI] [PubMed] [Google Scholar]
- 26.Schelbert H R. Curr Probl Cardiol. 1998;2:69–120. doi: 10.1016/s0146-2806(98)80011-x. [DOI] [PubMed] [Google Scholar]
- 27.Ausma J, Thonae F, Dispersyn G D, et al. Mol Cell Biochem. 1998;1–2:159–168. [PubMed] [Google Scholar]
- 28.Weber G. N Engl J Med. 1977;296:541–551. doi: 10.1056/NEJM197703102961005. [DOI] [PubMed] [Google Scholar]
- 29.White A, Handler P, Smith E. Principles of Biochemistry. New York: McGraw–Hill; 1973. p. 441. [Google Scholar]
- 30.Dahlbom M, Hoffman E, Hoh C, et al. J Nucl Med. 1992;33:1191–1199. [PubMed] [Google Scholar]
- 31.Phelps M E. J Nucl Med. 2000;41:661–681. [PubMed] [Google Scholar]
- 32.Cherry S R, Shao Y, Silverman R W, et al. IEEE Trans Nucl Sci. 1997;44:1109–1113. [Google Scholar]
- 33.Chatziioannou A F, Cherry S R, Shao Y, et al. J Nucl Med. 1999;40:1164–1175. [PMC free article] [PubMed] [Google Scholar]
- 34.Cherry S R, Shao Y, Slates R B, Wilcut E, Chatziioannou A F, Dahlbom M. J Nucl Med. 1999;40:75. [Google Scholar]
- 35.Fox P T, Mintun M, Raichle M, et al. Nature (London) 1986;323:806–809. doi: 10.1038/323806a0. [DOI] [PubMed] [Google Scholar]
- 36.Ogawa S, Tank D W, Menon R, et al. Proc Natl Acad Sci USA. 1992;89:5951–5955. doi: 10.1073/pnas.89.13.5951. [DOI] [PMC free article] [PubMed] [Google Scholar]
- 37.Kornblum, H. I., Arau, O. D. M., Annala, A. J., Tatsukawa, K. J., Phelps, M. E. & Cherry, S. R. (2000) Nature (London), in press. [DOI] [PubMed]
- 38.Rubins D J, Melega W P, Cherry S R, Lacan G. J Nucl Med Suppl. 1999;40:261. [Google Scholar]
- 39.Tavitian B, Terrazzino S, Kuhnast B, et al. Nat Med. 1998;4:467–471. doi: 10.1038/nm0498-467. [DOI] [PubMed] [Google Scholar]
- 40.Pan D, Gambhir S S, Toyokuni T, et al. Bioorg Med Chem Lett. 1998;8:1317–1320. doi: 10.1016/s0960-894x(98)00239-x. [DOI] [PubMed] [Google Scholar]
- 41.Gambhir S S, Barrio J R, Herschman H R, Phelps M E. J Nucl Cardiol. 1999;6:219–233. doi: 10.1016/s1071-3581(99)90083-1. [DOI] [PubMed] [Google Scholar]
- 42.Satyamurthy N, Barrio J R, Bida G T, Huang S C, Mazziotta J C, Phelps M E. J Appl Radiat Isot. 1990;41:113–129. doi: 10.1016/0883-2889(90)90096-y. [DOI] [PubMed] [Google Scholar]
- 43.Gambhir S S, Barrio J R, Phelps M E, et al. Proc Natl Acad Sci USA. 1999;96:2333–2338. doi: 10.1073/pnas.96.5.2333. [DOI] [PMC free article] [PubMed] [Google Scholar]
- 44.Tjuvajev J G, Finn R, Watanabe K, et al. Cancer Res. 1996;56:4087–4095. [PubMed] [Google Scholar]
- 45.Tjuvajev J G, Avril N, Oku T, et al. Cancer Res. 1998;58:4333–4341. [PubMed] [Google Scholar]
- 46.Barrio J R, Namavari M, Phelps M E, et al. J Org Chem. 1996;61:6084–6085. doi: 10.1021/jo960761d. [DOI] [PubMed] [Google Scholar]
- 47.Gambhir S S, Barrio J R, Wu L, et al. J Nucl Med. 1998;39:2003–2011. [PubMed] [Google Scholar]
- 48.Namavari M, Barrio J R, Gambhir S S, et al. Nucl Med Biol. 2000;27:157–162. doi: 10.1016/s0969-8051(99)00095-5. [DOI] [PubMed] [Google Scholar]
- 49.Gambhir S S, Barrio J R, Herschman H R, Phelps M E. Nucl Med Biol. 1999;26:481–490. doi: 10.1016/s0969-8051(99)00021-9. [DOI] [PubMed] [Google Scholar]
- 50.Alauddin M M, Conti P S. Nucl Med Biol. 1998;25:175–180. doi: 10.1016/s0969-8051(97)00160-1. [DOI] [PubMed] [Google Scholar]
- 51.Gambhir S S, Bauer E, Black M E, et al. Proc Natl Acad Sci (USA) 2000;97:2785–2790. doi: 10.1073/pnas.97.6.2785. [DOI] [PMC free article] [PubMed] [Google Scholar]
- 52.MacLaren D C, Gambhir S S, Satyamurthy N, et al. Gene Ther. 1999;6:785–791. doi: 10.1038/sj.gt.3300877. [DOI] [PubMed] [Google Scholar]
- 53.Shao Y, Cherry S R, Farahani K, et al. IEEE Trans Nucl Sci. 1997;44:1167–1171. [Google Scholar]
- 54.Beyer, T., Townsend, D. T., Brun, T., et al. (2000) J. Nucl. Med., in press. [PubMed]
- 55.Patten, J. A., Delbehe, D. & Sandler, M. P. (2000) J. Nucl. Med., in press.


