

Abstract
An optical ruler based on ultrahigh-resolution colocalization of single fluorescent probes is described in this paper. It relies on the use of two unique families of fluorophores, namely energy-transfer fluorescent beads (TransFluoSpheres) and semiconductor nanocrystal quantum dots, that can be excited by a single laser wavelength but emit at different wavelengths. A multicolor sample-scanning confocal microscope was constructed that allows one to image each fluorescent light emitter, free of chromatic aberrations, by scanning the sample with nanometer scale steps with a piezo-scanner. The resulting spots are accurately localized by fitting them to the known shape of the excitation point-spread function of the microscope. We present results of two-dimensional colocalization of TransFluoSpheres (40 nm in diameter) and of nanocrystals (3–10 nm in diameter) and demonstrate distance-measurement accuracy of better than 10 nm using conventional far-field optics. This ruler bridges the gap between fluorescence resonance energy transfer, near- and far-field imaging, spanning a range of a few nanometers to tens of micrometers.
After the completion of the human genome project, the cataloging of all gene sequences, and the acquisition of high-resolution structures of proteins and RNAs, future biological investigations will focus on how the fundamental cellular building blocks interact with each other. Another important issue will be to determine their precise locations in space and time in an attempt to decode and lay out the cell machinery and circuitry. Indeed, many vital functions of the cell are performed by highly organized structures, modular cellular machines that are self-assembled from a large number of interacting macromolecules and translocated from one cell compartment to another. To unravel the organization and dynamics of these molecular machines in the cell, a tool is needed that can provide dynamic, in vivo, three-dimensional (3D) microscopic pictures with nanometer resolution of individual molecules interacting with each other.
Fluorescence microscopy can provide exquisite sensitivity down to the single molecule level for in vitro experiments (1–3). Moreover, it recently has been shown that single fluorophores can be detected in the membrane of living cells with good signal-to-noise ratio (S/N) (4–6). What is not clear yet is whether single molecule fluorescence microscopy can provide the required spatial and temporal resolution. Technical challenges still to be met are (i) the synthesis of spectrally resolvable, bright, and stable fluorophores that can be coupled in vivo to macromolecules, (ii) the development of an easy-to-use and affordable instrument that permits high-resolution localization of individual point-like sources in 3D, and (iii) the ability to perform such measurements at a rate that is compatible with that of biological events.
Recently, significant advances have been made in improving the spatial resolution of optical microscopy beyond the classical diffraction limit of light. These include (i) wide-field image restoration by computational methods (deconvolution) (7); (ii) wide-field single-molecule localization and tracking (8–10); (iii) aperture (11) and apertureless type (12) near-field scanning optical microscopy (NSOM); (iv) 4PI (13) and I5M (14) microscopies; and (v) point-spread-function (PSF) engineering by stimulated emission depletion (STED) (15, 16). Although opening new frontiers in microscopy, each of these methods has particular limitations. For example, deconvolution algorithms do not have unique solutions, require subsequent signal processing, and have limited ability to compensate for aberrations. NSOM is limited to surfaces (such as cell membranes) (17). Moreover, NSOM is very demanding to operate and difficult to implement for hydrated samples. 4PI and I5M microscopies require accurate alignment of two objectives, phase control of counterpropagating beams, signal postprocessing, and put constraints on sample size. PSF engineering by STED requires an ultrafast oscillator and amplifier system and is not easily expandable to multicolor probes. More generally, aside from NSOM, these superresolution approaches still suffer from basic limitations of far-field optics, i.e., spherical and chromatic aberrations that can never be fully corrected for all wavelengths, and all have to tackle with the registration of separately acquired color planes.
Several attempts to correct or circumvent these difficulties have been reported. For confocal microscopy, Patwardhan and Manders (18) and Manders (19) addressed chromatic aberrations in the excitation arm. Manders (19) also addressed chromatic aberrations in the detection arm by using multilabeled (“white”) microbeads to measure the positional shifts between three different detection channels generated by chromatic aberrations. Scalettar et al. (20) took a similar approach to improve resolution in wide-field microscopy by using measured wavelength-dependent spherical aberrations as constraints for a deconvolution algorithm. However, none of these approaches perfectly corrects these imperfections.
In this paper, we present a technique that tackles these important problems, an imaging and ultrahigh-resolution colocalization technique that can pinpoint the location of multiple distinguishable probes with nanometer accuracy and perfect registry. First, this method is based on sample-scanning confocal microscopy using a single laser excitation wavelength and a closed-loop piezo-scanner (CLPS) that allows nanometer-accuracy steps. In this design, each fluorescent probe is moved through the fixed electromagnetic field at the focal point of the objective lens, which is a diffraction-limited intensity distribution known as the PSF. A pixel-by-pixel map (image) of the excitation PSF then is built from the recorded fluorescence intensity of this probe. Second, the method takes advantage of point-like fluorescent probes (i.e., much smaller than their emission wavelength) that can all be excited by the same laser wavelength but differ in their emission properties (21, 22). The fluorescence of the different emitters needs to be separable or recorded independently in “orthogonal” channels. This separation can be based on differences in emission color, fluorescence lifetime, or any other photophysical characteristics. Examples of such point-like probes that were used in this study are small TransFluoSpheres (TFS) beads (40 nm in diameter; Molecular Probes) or semiconductor nanocrystal (NC) quantum dots (less than 10 nm in diameter) (23, 24). Because all probes are excited by the same laser, aligned on the optical axis, the effects of chromatic aberrations in the excitation path are eliminated altogether. This fixed-excitation scheme also ensures the equivalence of each channel in the detection path. As the sample consisting of these distinguishable probes is scanned through the excitation PSF, images are constructed pixel-by-pixel from the recorded signal of each channel. In these images, all pixels corresponding to a given nanometer-accurate scanner position are in perfect registry. Each individual point-like source will appear in one channel only as a diffraction-limited shape, identical to that of the excitation PSF.
The resulting PSF images are fitted to a two-dimensional (2D) Gaussian function, a good approximation of the theoretical shape of the PSF. This method allows one to localize their centers with a precision of a few nanometers, limited only by shot noise, photophysical noise of the fluorescence signal (triplet states, blinking, photobleaching), and electronic and mechanical noise of the piezo-scanning device. The distance of fluorescent emitters recorded in orthogonal channels thus can be determined with nanometer accuracy, a result we call ultrahigh-resolution colocalization (UHRC). The physical size of the probes is the lower boundary of the distance measurement; the upper boundary is given by the scan range of the piezo-scanner (in this case, 100 μm).
A related technique using a single excitation beam (22) was demonstrated recently by van Oijen et al. (25) for pentacene molecules embedded in a p-terphenyl host crystal at cryogenic temperature relying on differences in absorption peaks among molecules and using wide-field imaging. Previously, we reported a related colocalization scheme of two different-color dyes using NSOM that forced two different-wavelength excitation lasers through the same near-field aperture (thus ensuring overlapping excitation volumes). This scheme was used to colocalize malaria parasite proteins in the membrane of infected red blood cells (17, 26, 27).
The new approach, which utilizes far-field optical components only and a single laser wavelength, dramatically extends the application range of UHRC. In particular, it allows 3D scanning and multicolor imaging, opening the way to in vivo nanometer-resolution mapping and tracking of multiple cellular components.
Materials and Methods
Sample Preparation.
Coverslips were treated with 1 M KOH in a sonicator for 30 min, rinsed in deionized water, and dried under nitrogen flow. TSFs 40 nm in diameter (excitation/emission peaks: 488/560 and 488/685 nm; Molecular Probes) were diluted in deionized water to 10−3 to 10−4 the stock concentration. A 10-μl drop containing a mixture of the two beads was left to dry on a coverslip in a desiccator and used immediately. Different NC batches (ensemble peak emissions: 540, 575, 588, and 620 nm) were prepared as previously described (28, 29), mixed, and diluted in butanol before use. We routinely synthesized NCs with full-width half-maximum (FWHM) ensemble spectrum of 30–40 nm. Each batch typically had ≈5% variations in size as measured by transmission electron microscopy (28, 29). Sample preparation was identical to that of TSFs.
Optical Excitation and Scanning-Stage Setups.
Two custom confocal setups (Fig. 1a) using Argon laser sources (Melles Griot, Carlsbad, CA) and optical microscopes equipped with oil immersion Plan-Apochromat ×100 (numerical aperture 1.4) objectives were used. Laser intensity (488 nm, linearly polarized) was recorded and feedback-controlled, ranging from 50 nW to 1 μW as measured in front of the dichroic beam splitter (505DRLP, Omega Optical, Brattleboro, VT), or equivalently 35 W/cm2 to 700 W/cm2 within the first Airy disk. The first setup comprised an Axiovert S100TV inverted microscope (Zeiss, Jeno, Germany) and an open-loop flat piezo-scanner (NIS-30; Nanonics Imaging, Jerusalem, Israel). The second consisted of an Axioskop 50 upright microscope (Zeiss) and a closed-loop, three-axis, piezo-scanning flexure stage equipped with capacitive sensors for position measurement (P-517.3CL; Physik Instruments, Waldbronn, Germany). The scanners were controlled by analog output boards (ATAO6, 12 bits, and PCI 6111E, 16 bits; National Instruments, Austin, TX) and homemade software written in c++ and labview (National Instruments), respectively. Scanned areas ranged from 1 × 1 μm2 to 10 × 10 μm2, in steps of 25 nm to 100 nm, with integration times of 5 to 200 ms, depending on the detector used. The CLPS was calibrated at the factory (1-nm accuracy); scanner positions were recorded during each acquisition by using a 12-bit analog input board (PCI 6111E).
Figure 1.
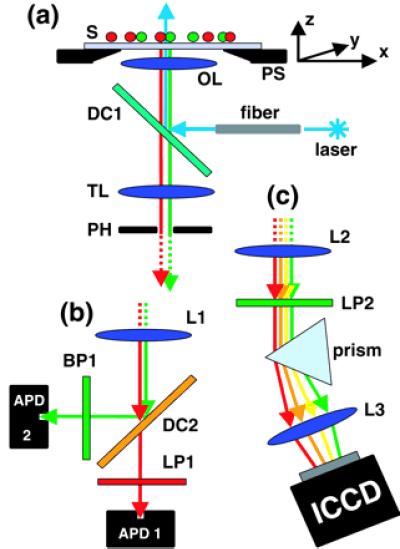
Optical setup of the multicolor sample-scanning confocal microscope. (a) Excitation arm. Laser excitation guided through a single-mode fiber is reflected by a dichroic mirror (DC1) and focused through an infinity-corrected objective lens (OL) onto the sample (S), which is mounted on a 3D piezo-scanner (PS). A real image of the fluorescence response of this focal spot is formed in the plane of an adjustable pinhole (PH, 630 μm in diameter) used for background rejection. (b) Detection arm of the Axioskop (dual-color). Fluorescence light originating from PH is split by a dichroic mirror (DC2), filtered by a bandpass (BP) or a longpass (LP1), also rejecting the excitation wavelength. A lens (L1) in a 2f-2f configuration is used to focus the light onto two independently adjustable APDs. Their small sensitive areas (200 μm in diameter) function as confocal pinholes. (c) Detection arm of the Axiovert (multicolor). The fluorescence light originating from the pinhole plane is collimated by a lens (L2), long-pass filtered (LP2), dispersed by a prism, and imaged through another lens (L3) onto an ICCD camera. A full emission spectrum is acquired for each scanned pixel.
Fluorescence Detection.
Dual-color colocalization measurements (NCs and TFSs) were performed on the Axioskop (Fig. 1b). A dichroic mirror (565DRLP for NCs and 610DRLP for beads; Omega Optical) separated green and red wavelengths onto two avalanche photodiodes (APD) (SPCM AQ141; Perkin–Elmer), which simultaneously counted the photons on both channels. Band-pass filters in front of each APD minimized crosstalk of both channels (535DF35 and 625DF25 for NCs and 555DF25 and LP695 for TFSs; Omega Optical). Individual photon's arrival times were recorded with a time-counting board (PCI 6602; National Instruments) and were attributed online to each pixel of the dual-color image.
For multicolor colocalization work with more NCs, one costly option is to successively split the different colors by optical filters and use a large number of APDs. Instead, we designed a new apparatus (Fig. 1c) incorporating a custom single-prism spectrometer (fused silica isosceles Brewster prism with AR coating; CVI Laser Corporation, Albuquerque, NM) in the detection arm of the Axiovert. The dispersed photons were projected onto a Peltier-cooled intensified charged-coupled device (ICCD) camera (PentaMax; Princeton Instruments, Trenton, NJ). A full spectrum was recorded for each image pixel in synchronization with the piezo-scanner movements. Calibration done with known laser lines showed a spectral resolution of 2 nm. Data acquisition was performed by using winview software (Princeton Instruments), with integration times ranging from 20 to 100 ms per pixel.
Data Analysis.
Data analysis was performed with a set of custom software tools written in labview. For the Axioskop (Fig. 1b), two-color APD images were constructed by overlaying the two independent channels (17, 27). On the Axiovert (Fig. 1c), individual spectra of many single NCs were recorded as follows. In the first step, spectral bands (25 nm in width) determined from ensemble emission spectra were used to generate images for each NC batch. From these images, the spectra of apparently colocalized NCs were determined (Fig. 2a) by integrating the ICCD data of a number of image pixels sufficient to cover the PSF area (e.g., 3 × 3 pixels for a 10 × 10 μm2 scanning area). It was found that the FWHM of the emission spectrum of a single NC was only 15–25 nm. In the second step, narrower spectral bands (5–20 nm) were chosen to define new color channels (Fig. 2b) with reduced spectral overlaps (i.e., as orthogonal as possible). This procedure also allows one to examine the spectral inhomogeneities of NCs within a single batch.
Figure 2.
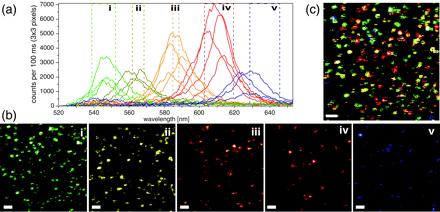
NC multicolor imaging. Scans of a mixture of four NC samples (ensemble peak emissions: 540, 575, 588, and 620 nm). (a–c) 10 × 10 μm2 scan (pixel size, 78 nm; scale bar, 1 μm). (a) A representative collection of individual NC spectra (≈20 nm FWHM) obtained from the integrated data of 3 × 3 pixels. Despite their overlap, five orthogonal spectral bands (i to v) could be defined. (b) Five false-color images corresponding to the spectral bands defined in a. (c) Overlay of the five perfectly registered images of b.
In the third step, the above images were combined into a composite false-color image with perfect registry between each color plane (Fig. 2c). These composite images obtained on the Axiovert setup (ICCD detection) are the multicolor equivalent of the dual-color images obtained on the Axioskop setup (APD detection). The final steps of the UHRC analysis were performed on dual-color images obtained with the Axioskop only, for it was the only one equipped with a CLPS.
Regions of interest (ROI) then were selected for further analysis. For each color plane of the ROI, a nonlinear Levenberg–Marquard fit of the PSF to a 2D elliptical Gaussian (a good approximation of the theoretical pattern) was performed by using χ2 minimization (30). Error bars on the coordinates of each PSF center were estimated with a bootstrap-simulation method. Briefly, for each image plane, 1,000 modified data sets were constructed from the original image. Each modified data set consisted of 70% of the original pixel values, plus 30% of randomly picked values from the original data set (31). Each bootstrap-simulated data set then was fitted to a 2D Gaussian by using the χ2-minimization approach, leading to a slightly different fitted center for the PSF. As a result, we obtained a probability distribution (PD) for the position of each PSF's center, which was fitted by an elliptical 2D Gaussian. For each pair of colocalized centers, a distance PD then was computed analytically from these fitted center's coordinates' PDs. The final step of the analysis consisted in extracting an error bar on the distance from this distance PD. We emphasize here that we report the 95% confidence limit (CL) error bar, whereas the literature more commonly reports the less stringent 68% CL error bar (which is typically twice smaller).
Because the χ2-minimization procedure is strictly valid only for functions with Gaussian distributed values, we numerically estimated the theoretical precision accessible by this approach, using simulated data both for bead and for blinking NCs' PSF. Indeed, in the case of the shot-noise-limited signal of beads (Poisson distributed values), the χ2-minimization approach still is justified for high count-per-pixel (cpp) values. It is less so for the non-Poisson distributed data of blinking NCs (32–35). Simulations of NC blinking relied on a separate photophysical study in which time-trace measurements were performed and analyzed. We checked by simulations that the bootstrap estimation of the position PD of each PSF's center gave a correct estimation of the uncertainty of the PSF's center position. In addition, simulations incorporated the recorded CLPS position files to take into account the uncertainty coming from mechanical ringing and residual ground-loop noise.
Results and Discussion
Our approach requires the use of different fluorophores that can be excited with one source but emit at different, nonoverlapping wavelengths. This requirement comes from the difficulty to obtain precise parfocality for two different wavelengths. That is a tough constraint if one wants to simultaneously colocalize more than two colors while maintaining comparable signals for all of them. Moreover, for high-accuracy fitting, a significant number of pixels per PSF area is required, i.e., the fluorophores should not fade too quickly. To our knowledge, energy transfer dyes (36), TFSs, and NCs are the only available probes to fulfill the first requirement for one-photon excitation. Because of photobleaching and crosstalk considerations, we chose to work with TFSs and NCs. Both have advantages and disadvantages for colocalization studies as discussed below.
TFSs are carboxylate-modified polystyrene beads loaded with a series of two or more dyes. Energy transfer between these dyes accomplishes large Stokes shifts so that only the longest-wavelength dye exhibits significant fluorescence. We tested four types of TFSs (40 nm in diameter) excited at 488 nm with emission peaks centered at 560, 605, 645, and 685 nm respectively (47 nm FWHM). In our dual-color analysis, we used the two extreme colors to minimize spectral overlap, i.e., the 560- and 685-nm beads. Although containing hundreds of dye molecules per bead, noticeable photobleaching was still observed for the 685-nm TFSs, although only after several minutes of continuous excitation. Incident laser excitation power was kept at 50 nW (35 W/cm2), maintaining acceptable S/N and reasonable photostability during the acquisition of the image.
Fig. 3 gives an example of colocalization data obtained with TFSs for 50-nm pixels. The two separate color planes (Fig. 3 a and b) show very similar position for the slightly elliptical PSFs, but the composite image (Fig. 3c) exhibits a shift between the two: The measured distance between the two beads' centers is 75 ± 9 nm. Fig. 3d shows the PD for each PSF coordinates as derived from the bootstrap calculations. Distance and error bar were extracted from the distance PD. The known asymmetry of the confocal excitation spot for high-numerical-aperture objectives and linear-polarized illumination (37) as well as imperfections of the optical components result in an elliptical cross-section for the PSF. However, because all objects are illuminated with the same PSF, potential elliptical deformations or slight out-of-focus positions of the sample have no influence on the precision of the 2D distance measurement.
Figure 3.
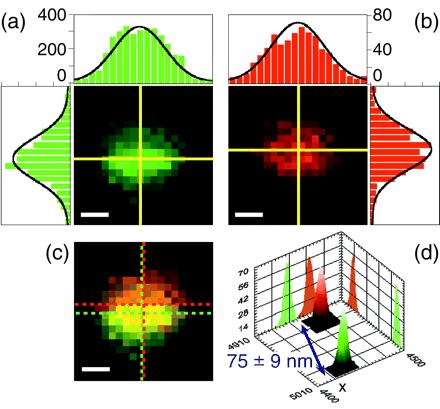
TFS colocalization. Mixture of green (emission: 560 nm) and red (emission: 685 nm) TFSs excited at 488 nm (excitation power, 50 nW or 35 W/cm2; integration time, 10 ms). (a and b) Green and red channel images of a 1 × 1 μm2 scan (pixel size, 50 nm; scale bar, 200 nm). The yellow crosses indicate the fitted PSF centers. The intensity profiles along the two lines are represented as bar graphs; the black curve corresponds to the 2D elliptical Gaussian fit. Counts are higher in the green channel than in the red, but S/N ratios are comparable. (c) Overlay of the two channels. The green and red dashed crosses indicate the centers of the green and red PSFs, respectively. It is clear from the apparent width of the PSF (990 nm) that the beads are slightly out of focus. (d) Histograms of the fitted centers of 1,000 bootstrap simulations of each channel. Each PD has a width of a few nanometers, corresponding to the uncertainty of the beads positions. Coordinates indicate absolute position (in nm) of the CLPS. These PDs are well fitted by 2D tilted Gaussians. The calculated distance is 75 ± 9 nm (95% CL).
This result is typical of what we obtained with the TFSs at this excitation power and with this pixel size. The uncertainty is essentially attributable to the shot-noise emission of the beads and to the background noise level, as checked by numerical simulations. The green beads gave a maximum signal on the order of 400 cpp (integration time, 10 ms), whereas the red signal was lower than 100 cpp. However, the background signal was larger in the green channel (20 cpp) than in the red (5 cpp), resulting in similar S/N and, hence, similar uncertainties in the fit. In a few occasions, because of spectral inhomogeneity among beads (as was checked on green-only samples), leakage of the green signal into the red channel was observed. To handle these cases, we implemented a two-step fitting procedure. The first step consisted in the green PSF fit, and the second one in the simultaneous red PSF fit plus residual green PSF fit, using the results of the first fit as a constraint for the position and width of this residual. Simulations showed that in these cases, the precision of the fitting procedure was identical to that of the more favorable and common cases where no leakage was observed.
NCs are small semiconductor nanocrystalline objects with diameters that can be fine-tuned from 2 to 10 nm. Their absorption edge and emission peak scale with size because of quantum confinement. The emission wavelength can be tuned by means of material composition and NC size anywhere from the UV to the infrared (28). For the experiments described here, we used CdSe/ZnS NCs with emission peaks between 540 and 620 nm and typical ensemble solution FWHM of 30 nm. NCs are brighter (depending on excitation conditions) than are their organic dye counterparts; they live longer but suffer from intermittent fluorescence emission (resulting in “blinking”) (31, 32, 34, 35). They exhibit dark states that can span any duration from microseconds to seconds, sometimes accompanied by intermittent spectral jumps. This photophysical behavior can result in a strong nonlinear relationship between the laser excitation power and the fluorescence emission.
When trying to map the excitation PSF with an NC, the outcome can be, in the worst cases, a patchy PSF image with no obvious relation between the excitation intensity and the integrated-emission intensity. As a result, some PSFs appear as if the source bleached during the scanning, reducing the number of pixels for the fit, and more generally have an irregular shape that significantly reduces the precision of localization. However, because NCs can be synthesized in a larger number of well separated colors, they are extremely attractive for applications that need multicolor detection, as illustrated in Fig. 2. In this work, we present the limitations and optimal conditions for best colocalization work with the current generation of NCs. An example of data obtained with a mixture of four different NC colors using the multicolor scanning-stage confocal setup (Fig. 1 a and c) is shown in Fig. 2. Although only four NC batches were used, spectral analysis of the sample revealed five distinct spectral peaks (the batch with nominal 620-nm peak showed a bimodal distribution) as indicated by different colors in Fig. 2a. Accordingly, five bands were defined (marked i through v) and five different false-color images were generated (Fig. 2b). Their overlay is shown in Fig. 2c.
Fig. 4 illustrates a simpler case of two different NC batches observed with the APD detection and closed-loop scanner setup. Fig. 4a shows an ROI of 1 × 1 μm2 (50-nm pixel size; 200 nW or 140 W/cm2; 50-ms integration time), containing two NCs (540 and 620 nm) used for ultrahigh-resolution measurements. Because of minimal blinking during this scan, the distance measurement (25 ± 13 nm; 95% CL) exhibits a precision similar to that of the TFSs.
Figure 4.

Nonblinking NC colocalization. Mixture of green (emission: 540 nm) and red (emission: 620 nm) NCs excited at 488 nm (excitation power, 200 nW or 140 W/cm2; integration time, 50 ms). (a and b) Green and red channel images of a 1 × 1 μm2 scan (pixel size, 50 nm; scale bar, 200 nm). See Fig. 3 legend for a general description. In this case, the count rates are similar in both channels. (c) Overlay of the two channels. (d) Histograms of the fitted-centers distribution. The measured distance is 25 ± 13 nm (95% CL). The precision of the measurement is comparable to that obtained for beads (Fig. 3) because of negligible blinking.
Fig. 5 shows a more typical case, where the two NCs under study show different blinking pattern during successive scans of the same area. The indicated uncertainty is obtained by the bootstrap analysis for each individual image: (a) d = 69 ± 20 nm; (b) d = 59 ± 13 nm; and (c) d = 50 ± 15 nm. All are compatible with an averaged distance of 59 ± 28 nm. Because we can exclude individual motion of the adsorbed NCs on the dry surface, the discrepancies between the different estimations of the distance are an additional illustration of the larger uncertainty coming from blinking.
Figure 5.
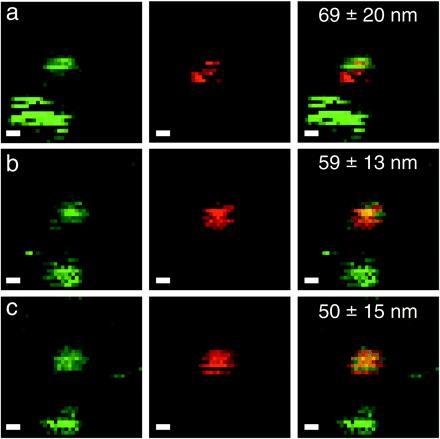
Blinking NC colocalization. Same mixture and parameters as in Fig. 4 (2 × 2 μm2 field of view; scale bar, 200 nm). The same field of view was acquired repeatedly, with a 2-min interval corresponding to the duration of the scan. A slight drift can be observed between the first and second image. Measured distance ± error bar (95% CL) are indicated on the dual-color images. One of the two green NCs in the lower left corner goes into a prolonged dark state in b and c.
We tested the effect of NC intermittency on the precision of the PSF fit by numerical simulations. NCs were simulated assuming either an exponential or a power-law distribution of dark (off) and emitting (on) intervals, because both are experimentally observed (ref. 35 and our unpublished observations). As it is obvious from the distribution of distances obtained for a single pair of fixed NCs (Fig. 5), blinking notably degrades the reliability of distance measurements as compared with TFSs. Attempting to impose a threshold to eliminate “almost off” pixels did not significantly improve the precision of the fit. Other maximum-likelihood fitting methods might slightly improve the results, but in many cases of observed blinking patterns, they will also face similar limitations as does the χ2-minimization method.
The data in Figs. 3 and 5 illustrate advantages and limitations of TFSs vs. NCs. As discussed (38) and as verified by our numerical simulations, the precision in both cases is affected by three factors: shot noise (related to the cpp level), S/N, and the number of pixels containing information on the PSF. The number of pixels is easily increased by reducing the piezo-scanner step size. We arbitrarily limited pixel size to 50 nm, resulting in 95% CL error bars of approximately 10 nm. Smaller step sizes could, of course, be used to attain higher resolution. However, it is of doubtful utility to increase the localization accuracy of objects having diameters much larger than 10 nm, like beads, which will be used to report the presence of nonfluorescent molecules (e.g., proteins). Indeed, distance is extracted from the positions of the beads themselves, not from the unknown position of the molecules of interest attached to the beads' surface. Hence, in this approach, resolution is limited by the size of the reporter and not by the pixel size.
Concerning the shot noise and S/N, in the case of beads, high cpp and large S/N can easily be obtained with a relatively limited excitation power while keeping integration time reasonably short. In the case of single NCs, longer integration times do not suppress the nonlinearity coming from blinking, and increased excitation power leads to saturation. As discussed, different maximum-likelihood fitting algorithms might reduce uncertainties, but suppression of blinking (e.g., by using few NCs clustered in polystyrene beads) would be preferable.
Conclusions
Our results demonstrate that UHRC of fluorophores is possible from the fluorescence resonance energy transfer distance range (a few nanometers) to arbitrarily large distances (many microns) provided that the following four criteria are fulfilled. (i) The fluorophores can be excited with a single wavelength. (ii) Their emission properties allow an unambiguous distinction between the different types. Here, we used differences in the emission spectra, but other parameters like fluorescence lifetime also could be used. (iii) They are bright enough and provide a reasonable S/N over a sufficient number of pixels of the PSF; and (iv) a CLPS is used. To extend the range of applications of this approach, we are investigating the use of two-photon excitation to access a larger variety of fluorescent probes like single-dye molecules or smaller beads loaded with single-fluorescent species. Our results call for improvements in at least two directions, (i) faster data acquisition requires higher quantum yield of the fluorophores or, equivalently, (ii) higher sensitivity of the detector.
Theoretical studies of NC photophysics predict reduced intermittency for various engineered band gaps (A. L. Efros, personal communication); future investigations will focus on such improvements. On the detector side, use of an array of APDs instead of an ICCD camera should reduce the integration time to the millisecond range. If TFSs or nanobeads containing several NCs were used, the acquisition of a multicolor image of a 10 × 10 μm2 area with 10-nm localization resolution would be feasible in about 2 min. We point out that the use of a CLPS allows one to first acquire a low-resolution multicolor imaging of the sample before zooming in on an ROI for UHRC measurements. Improvements in speed and feedback-loop control of the mechanical and thermal drift of the sample stage will allow the extension of this work to three dimensions. 3D multicolor colocalization also will require a detailed characterization of the volume shape of the PSF, which is very sensitive to the thickness and index of refraction of the coverslip, as well as to the indices of the physiological buffer/embedding matrix and the immersion oil (39, 40).
Despite current limitations, immediate applications to biology can be envisioned. Functionalized TFSs and NCs will allow ultrahigh-resolution mapping of genes and DNA-binding proteins. In conjunction with time-gated detection of NCs that drastically reduces autofluorescence (M. Dahan, T. Laurence, F.P., D. P. Herten, A. Schumacher, D.S.C., A.P.A., M. Sauer, and S.W., unpublished results), one can envision a dynamic, multicolor, 3D, nanometer-accuracy colocalization methodology used to follow proteins, nucleic acids, molecular machines and assemblies, and organelles within the living cell.
Acknowledgments
X.M. is a Human Frontier Science Program postdoctoral fellow. We thank T. Laurence and T.-H. Her for their assistance. This article owes a lot to the careful reading and comments of A. Deniz, T.-H. Her, T. Huser, A. Kapanidis, C. Larabell, and T. Laurence. Financial support for this work was provided by the Laboratory Directed Research and Development Program of Lawrence Berkeley National Laboratory under U.S. Department of Energy Contract DE-AC03–76SF00098.
Abbreviations
- APD
avalanche photodiode
- CL
confidence limit
- CLPS
closed-loop piezo-scanner
- cpp
count-per-pixel
- ICCD
intensified charge-coupled device
- NC
nanocrystal
- PD
probability distribution
- PSF
point-spread-function
- S/N
signal-to-noise ratio
- UHRC
ultrahigh-resolution colocalization
- TFS
TransFluoSphere
- 2D
two-dimensional
- 3D
three-dimensional
- NSOM
near-field scanning optical microscopy
- FWHM
full-width half-maximum
Footnotes
Article published online before print: Proc. Natl. Acad. Sci. USA, 10.1073/pnas.170286097.
Article and publication date are at www.pnas.org/cgi/doi/10.1073/pnas.170286097
References
- 1.Xie X S, Trautman J K. Ann Rev Phys Chem. 1998;49:441–480. doi: 10.1146/annurev.physchem.49.1.441. [DOI] [PubMed] [Google Scholar]
- 2.Moerner W E, Orrit M. Science. 1999;283:1670–1676. doi: 10.1126/science.283.5408.1670. [DOI] [PubMed] [Google Scholar]
- 3.Weiss S. Science. 1999;283:1676–1683. doi: 10.1126/science.283.5408.1676. [DOI] [PubMed] [Google Scholar]
- 4.Schütz G J, Pastushenko V P, Gruber H J, Knaus H-G, Pragl B, Schindler H. Single Mol. 2000;1:25–31. [Google Scholar]
- 5.Schütz G J, Kada G, Pastushenko V P, Schindler H. EMBO J. 2000;19:892–901. doi: 10.1093/emboj/19.5.892. [DOI] [PMC free article] [PubMed] [Google Scholar]
- 6.Sako Y, Minoguchi S, Yanagida T. Nat Cell Biol. 2000;2:168–172. doi: 10.1038/35004044. [DOI] [PubMed] [Google Scholar]
- 7.Carrington W A, Lynch R M, Moore E D W, Isenberg G, Fogarty K E, Fay F S. Science. 1995;268:1483–1487. doi: 10.1126/science.7770772. [DOI] [PubMed] [Google Scholar]
- 8.Schmidt T, Schütz G J, Baumgartner W, Gruber H J, Schindler H. Proc Natl Acad Sci USA. 1996;93:2926–2929. doi: 10.1073/pnas.93.7.2926. [DOI] [PMC free article] [PubMed] [Google Scholar]
- 9.Schütz G J, Schindler H, Schmidt T. Biophys J. 1997;73:1073–1080. doi: 10.1016/S0006-3495(97)78139-6. [DOI] [PMC free article] [PubMed] [Google Scholar]
- 10.Dickson R M, Norris D J, Tzeng Y L, Moerner W E. Science. 1996;274:966–969. doi: 10.1126/science.274.5289.966. [DOI] [PubMed] [Google Scholar]
- 11.Dunn R C. Chem Rev. 1999;99:2891–2927. doi: 10.1021/cr980130e. [DOI] [PubMed] [Google Scholar]
- 12.Sanchez E J, Novotny L, Sunney Xie X. Phys Rev Lett. 1999;82:4014–4017. [Google Scholar]
- 13.Hell S, Stelzer E H K. J Opt Soc Am A. 1992;9:2159–2166. [Google Scholar]
- 14.Gustafsson M G L, Agard D A, Sedat J W. J Microsc (Oxford) 1999;195:10–16. doi: 10.1046/j.1365-2818.1999.00576.x. [DOI] [PubMed] [Google Scholar]
- 15.Klar T A, Hell S W. Opt Lett. 1999;24:954–956. doi: 10.1364/ol.24.000954. [DOI] [PubMed] [Google Scholar]
- 16.Klar T A, Jakobs S, Dyba M, Enger A, Hell S W. Proc Natl Acad Sci USA. 2000;97:8206–8210. doi: 10.1073/pnas.97.15.8206. [DOI] [PMC free article] [PubMed] [Google Scholar]
- 17.Enderle T, Ha T, Ogletree D F, Chemla D S, Magowan C, Weiss S. Proc Natl Acad Sci USA. 1997;94:520–525. doi: 10.1073/pnas.94.2.520. [DOI] [PMC free article] [PubMed] [Google Scholar]
- 18.Patwardhan A, Manders E M M. BioImaging. 1996;4:17–24. [Google Scholar]
- 19.Manders E M M. J Microsc (Oxford) 1997;185:321–328. [Google Scholar]
- 20.Scalettar B A, Swedlow J R, Sedat J W, Agard D A. J Microsc (Oxford) 1996;182:50–60. doi: 10.1046/j.1365-2818.1996.122402.x. [DOI] [PubMed] [Google Scholar]
- 21.Burns D H, Callis J B, Christian G D, Davidson E R. Appl Opt. 1985;24:154–161. doi: 10.1364/ao.24.000154. [DOI] [PubMed] [Google Scholar]
- 22.Betzig E. Opt Lett. 1995;20:237–239. doi: 10.1364/ol.20.000237. [DOI] [PubMed] [Google Scholar]
- 23.Bruchez M J, Moronne M M, Gin P, Weiss S, Alivisatos P A. Science. 1998;281:2013–2016. doi: 10.1126/science.281.5385.2013. [DOI] [PubMed] [Google Scholar]
- 24.Chan W C W, Nie S. Science. 1998;281:2016–2018. doi: 10.1126/science.281.5385.2016. [DOI] [PubMed] [Google Scholar]
- 25.van Oijen A M, Köhler J, Schmidt J, Müller M, Brakenhoff G J. Chem Phys Lett. 1998;292:183–187. [Google Scholar]
- 26.Enderle T, Ha T, Chemla D S, Weiss S. Ultramicroscopy. 1998;71:303–309. doi: 10.1016/s0304-3991(97)00075-2. [DOI] [PubMed] [Google Scholar]
- 27.Ha T, Enderle T, Chemla D S, Weiss S. IEEE J Quantum Electron. 1996;2:1115–1128. [Google Scholar]
- 28.Alivisatos A P. Science. 1996;271:933–937. [Google Scholar]
- 29.Peng X G, Schlamp M C, Kadavanich A V, Alivisatos A P. J Am Chem Soc. 1997;119:7019–7029. [Google Scholar]
- 30.Press W H, Teukolsky S A, Vetterling W T, Flannery B P. Numerical Recipes inc: The Art of Scientific Computing. Cambridge, U.K.: Cambridge Univ. Press; 1996. [Google Scholar]
- 31.Efron B, Tibshirani R J, Efron B. An Introduction to the Bootstrap. Boca Raton, FL: CRC; 1994. [Google Scholar]
- 32.Nirmal M, Dabbousi B O, Bawendi M G, Macklin J J, Trautman J K, Harris T D, Brus L E. Nature (London) 1996;383:802–804. [Google Scholar]
- 33.Efros A L, Rosen M. Phys Rev Lett. 1997;78:1110–1113. [Google Scholar]
- 34.Banin U, Bruchez M, Alivisatos A P, Ha T, Weiss S, Chemla D S. J Chem Phys. 1999;10:1–7. [Google Scholar]
- 35.Kuno M, Fromm D P, Hamann H F, Gallagher A, Nesbitt D J. J Chem Phys. 2000;112:3117–3120. [Google Scholar]
- 36.Ju J, Ruan C, Fuller C W, Glazer A N, Mathies R A. Proc Natl Acad Sci USA. 1995;92:4347–4351. doi: 10.1073/pnas.92.10.4347. [DOI] [PMC free article] [PubMed] [Google Scholar]
- 37.Cogswell C J, Larkin K G. In: Handbook of Biological Confocal Microscopy. Pawley J B, editor. New York: Plenum; 1995. pp. 127–137. [Google Scholar]
- 38.Bobroff N. Rev Sci Instrum. 1986;57:1152–1157. [Google Scholar]
- 39.Shaw P J, Rawlins D J. J Microsc (Oxford) 1991;163:151–165. [Google Scholar]
- 40.Gibson S F, Lanni F. J Opt Soc Am A. 1989;6:1357–1367. doi: 10.1364/josaa.6.001357. [DOI] [PubMed] [Google Scholar]