Abstract
Visualizing RNA pseudoknot structures is computationally more difficult than depicting RNA secondary structures, because a drawing of a pseudoknot structure is a graph (and possibly a nonplanar graph) with inner cycles within the pseudoknot, and possibly outer cycles formed between the pseudoknot and other structural elements. We previously developed PseudoViewer for visualizing H-type pseudoknots. PseudoViewer2 improves on the first version in many ways: (i) PseudoViewer2 is more general because it can visualize a pseudoknot of any type, including H-type pseudoknots, as a planar graph; (ii) PseudoViewer2 computes a drawing of RNA structures much more efficiently and is an order of magnitude faster in actual running time; and (iii) PseudoViewer2 is a web-based application program. Experimental results demonstrate that PseudoViewer2 generates an aesthetically pleasing drawing of pseudoknots of any type and that the new representation offered by PseudoViewer2 ensures uniform and clear drawings, with no edge crossing, for all types of pseudoknots. The PseudoViewer2 algorithm is the first developed for the automatic drawing of RNA secondary structures, including pseudoknots of any type. PseudoViewer2 is accessible at http://wilab.inha.ac.kr/pseudoviewer2/.
INTRODUCTION
The visualization of a complex molecular structure helps the observer to understand the structure and is a key component among the support tools available in the biosciences. This paper describes a new algorithm and its implementation for automatically producing a clear and aesthetically appealing drawing of RNA pseudoknot structures. An RNA pseudoknot is a tertiary structural element formed when bases of a single-stranded loop pair interact with complementary bases outside the loop. Pseudoknots are not only widely occurring structural motifs in many kinds of RNA molecules, but are also responsible for several important RNA functions. For example, pseudoknot structures present in coding regions can stimulate ribosomal frameshifting and translational read-through during elongation. In addition, pseudoknots in noncoding regions can initiate translation either by being part of the so-called internal ribosomal entry site (IRES) in the 5′ noncoding region or by forming translational enhancers in the 3′ noncoding region (1).
Several computer programs are available for drawing RNA secondary structures (2–7), but none of these has the capacity to draw RNA pseudoknots. From the standpoint of graph theory, a drawing of RNA secondary structure is a tree, whereas a drawing of an RNA pseudoknot is a graph (and possibly a nonplanar graph) with inner cycles within the pseudoknot, and possibly outer cycles formed between the pseudoknot and other structural elements. Thus, drawing RNA pseudoknot structures is computationally more difficult than depicting RNA secondary structures.
Because no automatic method for drawing RNA pseudoknots exists, visualizing RNA pseudoknots relies on a significant amount of manual work, which does not always produce satisfactory results. RNA pseudoknots are often represented by adding line segments to RNA secondary structure drawings to indicate base pairs formed by the RNA pseudoknots. Alternatively, RNA pseudoknots are drawn either manually, by modifying RNA secondary structure drawings, or from scratch. In either case, drawing RNA pseudoknots manually is difficult and the results obtained become rapidly more unsatisfactory as the size and complexity of the drawings increase. One of the difficulties in visualizing RNA structures is caused by the overlapping and crossing of structural elements, which reduce the readability of the drawing. In most drawing programs of RNA secondary structures, computational load is increased by the work associated with removing the overlaps and crossings of structural elements, which is performed either by an iterative process or by user intervention.
One year ago we developed the first version of PseudoViewer (8) for automatically drawing RNA secondary structures with H-type pseudoknots. PseudoViewer2 improves on this first version in many ways: (i) PseudoViewer2 is more general; it can visualize a pseudoknot of any type, including H-type pseudoknots, as a planar graph; (ii) PseudoViewer2 computes the RNA structural drawings much more efficiently, in fact it is an order of magnitude faster in terms of actual running times; and (iii) PseudoViewer2 is easier to use since it is executable within a web browser. Experimental results demonstrate that PseudoViewer2 is capable of automatically producing a clear and aesthetically appealing drawing of RNA structures. The rest of this paper describes the algorithm and our experimental results.
REPRESENTATION OF PSEUDOKNOTS
H-type pseudoknots
In the case of pseudoknots of the classic or H-type, bases in a hairpin loop pair with complementary bases outside the loop (Fig. 1). According to the broad definition of pseudoknots (9), 14 topologically distinct types are possible in principle. However, the most commonly occurring pseudoknots are of the H-type, where H stands for a hairpin loop.
Figure 1.
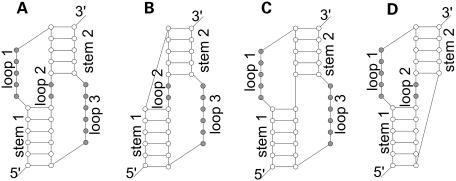
Schematic representation of H-type pseudoknots, adapted from (10). (A) General configuration; (B) loop 1 is eliminated; (C) loop 2 is eliminated; (D) loop 3 is eliminated. The pseudoknot in (C) is the most abundant in natural RNA.
Figure 1 shows typical representations of H-type pseudoknots (10). All H-type pseudoknots are drawn with edge crossings. These edge crossings reduce the readability of the drawings and make it difficult to follow the RNA sequence from end to end. Edge crossings are inevitable in these drawings in order to stack the two stems coaxially. The coaxial stacking of the stems has a biological meaning for the stems of a pseudoknot mimic a single stem, which was confirmed by NMR study (10). However, the drawing of pseudoknots with secondary structure represents a topological structure rather than a geometric structure. In other words, a drawing of this type is intended to represent the connectivity of bases, and therefore the drawing should focus on making connectivity relations clear.
We propose a new method for representing all H-type pseudoknots uniformly and without edge crossings. The drawings shown in Figure 2A–D represent the pseudoknots shown in Figure 1A–D. The drawing in Figure 2B was obtained by flipping stem 2 (enclosed in a box) with respect to the horizontal axis, and translating it horizontally by the stem width. The drawing shown in Figure 2C was obtained by flipping stem 2 with respect to the vertical axis, and the drawing in Figure 2D was obtained by flipping stem 2 with respect to the horizontal axis and translating stem 2 horizontally. The resulting drawings contain no edge crossings and have similar shapes with exactly two inner cycles regardless of their types. Furthermore, it is much easier to follow the RNA sequence direction from the 5′ end to 3′ end. In the new representation, the two stems of a pseudoknot are not stacked coaxially, but are presented in parallel, adjacent to each other.
Figure 2.
New representation of H-type pseudoknots.
Pseudoknots of other types
Although the most commonly occurring pseudoknots are of the H-type, other types of pseudoknots exist. Base pairing between a hairpin loop and a single stranded part outside the loop forms an H-type pseudoknot, which has been discussed in the previous subsection. Base pairing of a hairpin loop with another hairpin loop forms an HH-type pseudoknot, while base pairing of a hairpin loop with a single stranded part of a bulge, or of an internal or multiple loop, forms an HL type (Fig. 3). After we had analysed all the pseudoknots in PseudoBase (11), for the purpose of drawing them in combination of basic pseudoknot types, we concluded that there are six basic pseudoknot types: the H-type and five other types, as displayed in Figure 3 (see Table 1 for the classification of 236 pseudoknots). Most known pseudoknots can be represented as planar graphs as combinations of these basic pseudoknot types.
Figure 3.
Pseudoknots of other types: (A) LL type; (B) HLOUT type; (C) HLIN type; (D) HH type; (E) HHH type. H: hairpin loop, L: bulge loop, internal loop, or multiple loop.
Table 1. Classification of 236 pseudoknots in PseudoBase. Pseudoknots marked with * contain more than one basic type.
| Type | Pseudoknots | No. of occurrences | Ratio of occurrences (%) |
|---|---|---|---|
| H | All others | 180 | 76.3 |
| LL | RSV, CGMMV_PKbulge, ORSV-S1-PKbulge1∼3, PMMV-S_PKbulge, STMV_PKbulge, TMGMV_PKbulge, TMV_PKbulge, TMV-L_Pkbulge, Ec_RNaseP-P6*, HDV-It_ag* | 12 | 5.1 |
| HLOUT | AMV3, BBMV3*, BMV3*, BSMVbeta*, CCMV3*, CMV3*, LRSVbeta*, PSLVbeta*, satRPV*, BVDV_IRES, CSFV_IRES, BQCV_IRES-PKIII, CrPV_IRES-PKIII, DCV_IRES-PKIII, HiPV_IRES-PKIII, HDV-It_ag*, PSIV_IRES-PKIII, RhPV_IRES-PKIII, TrV_IRES-PKIII, Ec_23S-PKG12, Ec_RNaseP-P4, NGF-H1, NGF-L2, NGF-L6 | 24 | 10.2 |
| HLIN | BBMV3*, BMV3*, BSMVbeta*, CCMV3*, CMV3*, LRSVbeta*, Vp_PK2, PSLVbeta*, Pp_18S-PKE23-9/12, Ec_16S-PK570/866, Bp_PK2 | 11 | 4.7 |
| HH | HCV_IRES | 1 | 0.4 |
| HHH | HCV_229E, CoxB3, Ni_VS, satRPV*, Ec_RNaseP-P6*, Hs_SRP-pkn | 6 | 2.5 |
| Unclassified | Ec_alpha, HDV-It_g | 2 | 0.8 |
| Total | 236 | 100.0 |
ALGORITHM
Preliminaries
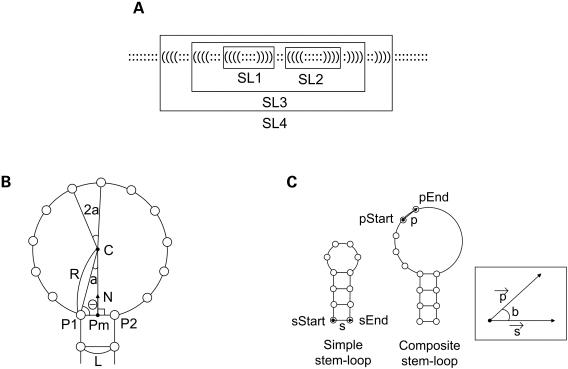
In the structure data, a pair of parentheses represents a base pair. The parenthesis pairs used in PseudoViewer2 are ‘( )’ and ‘[ ]’. In the RNA structure, we call a structure element enclosed by parentheses a stem-loop (Fig. 4A). A simple stem-loop corresponds to a single hairpin loop-stem and a composite stem-loop contains one or more other stem-loops. A composite stem-loop corresponds to an internal loop, a bulge loop, a multiple loop or a loop enclosing a pseudoknot. Unlike the first version of PseudoViewer, a simple stem-loop is always computed before its enclosing composite stem-loop.
Figure 4.
(A) Example of a structure with two simple stem-loops (SL1 and SL2) and two composite stem-loops (SL3 and SL4). (B) The radius, angle and center of a loop in a simple stem-loop. (C) The start and end vectors of a simple stem-loop and of a composite stem-loop.
The algorithm of PseudoViewer2 is outlined as follows: (i) stem-loops and pseudoknots are identified from the input structure data; (ii) the position and shape of a stem-loop enclosed in a pseudoknot is computed; (iii) the position and shape of a pseudoknot is computed; and (iv) the position and shape of a stem-loop outside a pseudoknot is computed. This section describes each step of the algorithm in detail.
Simple stem-loops
Base pairs of a stem in a simple stem-loop are stacked on the y-axis. In Figure 4B, L represents the distance between adjacent bases of a loop. The distance between a pair of bases of a stem is also L. If n represents the number of bases in the loop region plus 2 (corresponding to the base pair at the end of a stem), the angle a and the radius R of the loop can be computed using equations 1 and 2, respectively.
To determine the loop center, we first compute the midpoint Pm of point P1 and P2 using:
If N is used to represent the unit vector directed toward the loop center C from a point Pm, the vector N can be obtained by rotating the vector P2−P1 90° counterclockwise with respect to Pm and then by normalizing the vector. The distance d between C and Pm is determined by
From distance d, vector N, and the position vector Pm, we can compute the position vector C representing the loop center.
Using the radius R, the angle a and the loop center C, bases on the loop are located by simple trigonometric functions.
Composite stem-loops
Consider a composite stem-loop pSL containing a simple stem-loop sSL. In Figure 4C, we use sStart to represent the position of the first base of sSL before being enclosed in pSL; sEnd to represent the position of the last base of sSL before being enclosed in pSL; pStart to represent the position at which the first base of sSL is to be located in pSL; and pEnd to represent the position at which the last base of sSL is to be located in pSL. Let s be the unit vector in the direction of sEnd−sStart, and p the unit vector in the direction of pEnd−pStart. Then,
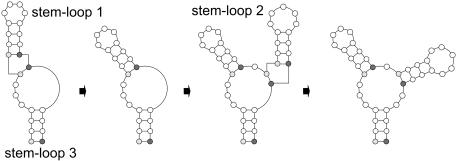
Therefore, the simple stem-loop sSL can be inserted into the composite stem-loop pSL by rotating sSL by angle b with respect to sStart and then translating it using the vector move. Figure 5 shows an example of enclosing two simple stem-loops in a composite stem-loop. Other base pairs of a stem in the loop region of a composite stem-loop are located in the same way as a simple stem-loop.The following algorithm summarizes the procedure of drawing a stem-loop.
Figure 5.
Example of inserting two simple stem-loops into a composite stem-loop by rotating and translating the simple stem-loops.
for each stem-loop do {start with the innermost stem-loop}
Compute the position of the stem in the stem-loop.
Compute the radius and center of the loop in the stem-loop.
Compute the position of each base of the loop.
If the stem-loop has an enclosed stem-loop or a pseudoknot
Insert it by rotating it and moving it.
end for
Pseudoknots
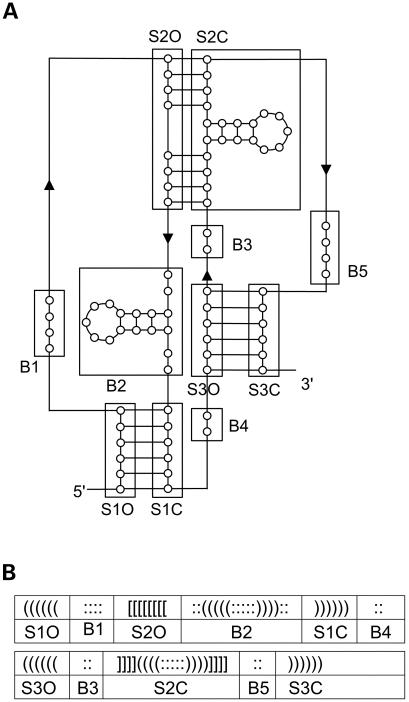
To simplify the process of drawing a pseudoknot, a pseudoknot is divided into several parts. Figure 6A displays a hypothetical pseudoknot, whose structure data are shown in Figure 6B. The structure contains all the structure elements of the six basic pseudoknot types described earlier. Among the three pseudoknotted stems, S1, S2 and S3, S2 has an internal structrure within it. The structure elements B1, B2, B3, B4, and B5 are either stem-loops or unpaired bases between pseudoknotted stems, and are defined as follows:
B1: structure element between the opening part of the first stem (S1O) and the opening part of the second stem (S2O) of a pseudoknot.
B2: structure element between the opening part of the second stem (S2O) and the closing part of the first stem (S1C) of a pseudoknot.
B3: structure element between the closing part of the second stem (S2C) and the opening part of the third stem (S3O) of a pseudoknot.
B4: structure element between the closing part of the first stem (S1C) and the opening part of the third stem (S3O) of a pseudoknot.
B5: structure element between the closing part of the second stem (S2C) and the closing part of the third stem (S3C) of a pseudoknot.
Figure 6.
(A) Hypothetical pseudoknot with all structure elements of the basic pseudoknot types. (B) Structure data of the pseudoknot in (A).
Depending on the type of a pseudoknot, it may or may not contain any one or more parts of B1, B2, B3, B4 or B5. For example, parts B3, S3O, S3C and B5 are missing in a non-HHH type pseudoknot. Base pairs of a stem are located along the y-axis and each pair of bases has the same y coordinates in the local coordinate system of the stem. Each part of a pseudoknot is located by the following algorithm.
Put S1O upright.
Put B1 above S1O with the following adjustments.
If B2 or S2O contains a stem-loop
Shift B1 left by the size of the stem-loop.
Else
Shift B1 left by L (the basic distance between a pair of bases).
Put S1C to the right of S1O.
Put B2 above S1C, and S2O above B2.
Put S2C to the right of S2O.
Put B3 below S2C.
If the pseudoknot is not of HHH type
Shift B3 right by L.
Else
If S1C or S3O contains a stem-loop
Shift B3 right by the size of the stem-loop.
Put S3O below B3.
Put B4 below S3O.
Put S3C to the right of S3O.
Put B5 above S3C with the following adjustments.
If S2C or B3 contains a stem-loop
Shift B5 right by the size of the stem-loop.
Else
Shift B5 right by L.
In the above algorithm, a stem-loop is inserted into a pseudoknot with the following adjustments.
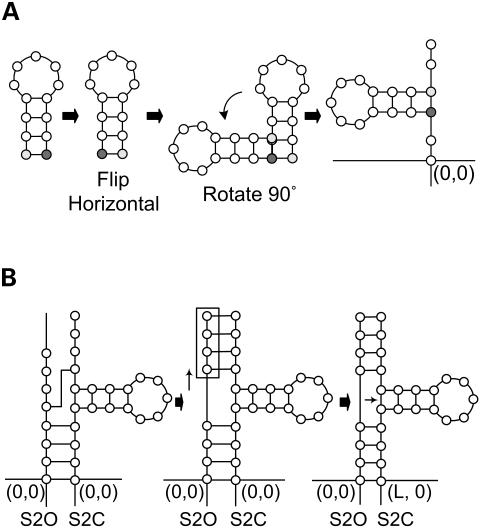
Stem-loops in parts S1O, B1 and S3O are rotated 90° counterclockwise.
Stem-loops in parts S2O and B2 are flipped horizontally and then rotated 90° counterclockwise (Fig. 7A).
Stem-loops in parts S1C, B5 and S3C are rotated 90° clockwise.
Stem-loops in parts B3, B4 and S2C are flipped horizontally and rotated 90° clockwise.
Figure 7.
(A) Example of inserting a simple stem-loop into a pseudoknot by flipping and rotating the simple stem-loop. (B) Example of adjusting the base position in a stem after inserting a stem-loop into a pseudoknot.
When a stem-loop is inserted into the stem part (such as S10, S1C, S2O, S2C, S3O and S3C), the positions of the bases in either the opening part or closing part of the stem are adjusted so that the two bases of each base pair have the same y-coordinate (Fig. 7B).
RESULTS
PseudoViewer2 is written in Microsoft Visual C#, and is executable within a Web browser on any PC with Windows 2000/XP/Me/98/NT 4.0 as its operating system. PseudoViewer2 takes as input an RNA sequence with its structure data in bracket view, which is widely used for representing pseudoknots (11). The bracket view describes pseudoknots and secondary structures in one of the following styles.
-
Bracket view I
# <RNA name> //optional; this line may be omitted.
<base sequence>
<matching parentheses and brackets>
<starting base number> //optional; if this is omitted, the starting number is 1 by default.
# TYMV
CGGGUGCAACUCCCGCCCCUU
UUCCGAGGGUCAUCGGAACCA
((((:::::::))))(((:::
[[[[[[))):::]]]]]]:::
1
-
Bracket view II
# <RNA name> //optional; this line may be omitted.
<base sequence> alternates with
<matching parentheses and brackets>
<starting base number> //optional; if this is omitted, the starting number is 1 by default.
# TYMV
CGGGUGCAACUCCCGCCCCUU
((((:::::::))))(((:::
UUCCGAGGGUCAUCGGAACCA
[[[[[[))):::]]]]]]:::
1
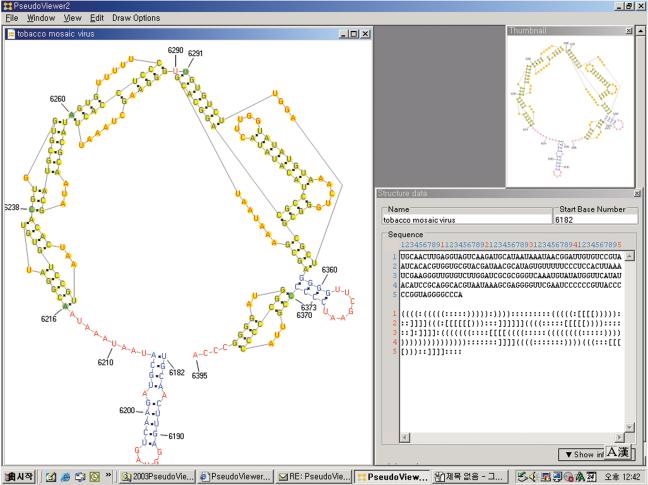
As output, PseudoViewer2 produces two kinds of structure drawings. In the standard view, RNA pseudoknots and secondary structures are displayed in the form where bases and symbols between paired bases are specified (Fig. 8). The outline view displays the structure in the form of a backbone in which loops are replaced by polygons and helices by line segments.
Figure 8.
Interface of PseudoViewer2 With three windows: structure image window, thumbnail window, and structure data window (clockwise from the top left).
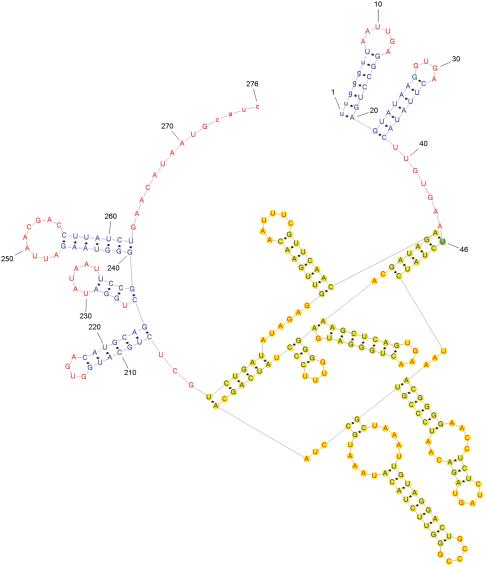
Figure 9 shows the structure of the td group I intron of bacteriophage T4. It is a very complex structure with a non-H type pseudoknot, typically represented as a nonplanar graph in other studies (12). However, PseudoViewer2 represents the structure as a planar graph with no edge crossing. The starting base of each pseudoknot is shown in green background color with its base number. In addition to this, pseudoknots are shown in yellow background color, and thus are easily distinguished from other structural elements. Unlike manual drawings of pseudoknots, the drawings generated by PseudoViewer2 are aesthetically pleasing and clear.
Figure 9.
Structure of the td group I intron of bacteriophage T4.
For the purpose of comparison of actual running times, we tested both PseudoViewer1 and PseudoViewer2 on RNAs with H-type pseudoknots: on tobacco mosaic, satellite tobacco necrosis virus 1, Escherichia coli tmRNA, satellite tobacco mosaic virus, Odontoglossum ringspot virus, and Cyanophora paradoxa cyanelle tmRNA. The running times of PseudoViewer1 to compute the drawings of these test cases (displaying time is not included) on a Pentium IV 1.5 GHz processor are 15 ms, 31 ms, 31 ms, 93 ms, 109 ms and 146 ms, respectively, while PseudoViewer2 took less than 1 ms for all these test cases (Table 2). It follows from this result that PseudoViewer2 is at least an order of magnitude faster than PseudoViewer1.
Table 2. Execution times of PseudoViewer1 and PseudoViewer2 on Pentium IV 1.5 GHz processor.
| RNA | No. of bases | No. of pseudoknots | Time of PseudoViewer1 (ms) | Time of PseudoViewer2 (ms) |
|---|---|---|---|---|
| Tobacco mosaic virus | 214 | 4 | 15 | <1 |
| Satellite tobacco necrosis virus 1 | 252 | 4 | 31 | <1 |
| E.coli tmRNA | 363 | 4 | 31 | <1 |
| Satellite tobacco mosaic virus | 421 | 7 | 93 | <1 |
| Odontoglossum ringspot virus | 419 | 8 | 109 | <1 |
| Cyanophora paradoxa cyanelle tmRNA | 291 | 1 | 146 | <1 |
PseudoViewer2 provides an editing facility for interactively changing both the structure data and the structure drawing. The user can rotate or scale a loop or the entire drawing. It also provides several drawing options, which we found useful for visualizing RNA structures. The detailed methods for using PseudoViewer2 are described at http://wilab.inha.ac.kr/pseudoviewer2/. PseudoViewer2 can also run in a stand-alone application mode and is available at the web page.
CONCLUSION
A drawing of RNA pseudoknots is a graph with inner cycles within a pseudoknot and may also contain outer cycles formed between a pseudoknot and other structural elements. Therefore, visualizing RNA pseudoknots is computationally more difficult than RNA secondary structures. We have developed a new representation method and an algorithm for visualizing RNA pseudoknots as a two-dimensional drawing and have implemented the algorithm in a Web-based program called PseudoViewer2. The new representation produces uniform, clear drawings with no edge crossing for any type of pseudoknot, including the H-type pseudoknot.
For given RNA pseudoknots and secondary structures, PseudoViewer2 identifies all simple stem-loops and composite stem-loops enclosing other stem-loops. Simple stem-loops are inserted into their enclosing composite stem-loops by flip, rotation and/or translation operations. The PseudoViewer2 algorithm is the first capable of automatically drawing RNA structures containing pseudoknots of any type as planar drawings with no edge crossings.
Acknowledgments
ACKNOWLEDGEMENTS
This work was supported by the Korea Science and Engineering Foundation under grant R05-2001-000-01037-0.
REFERENCES
- 1.Deiman B.A.L.M. and Pleij,C.W.A. (1997) Pseudoknots: A vital feature in viral RNA. Semin. Virol., 8, 166–175. [Google Scholar]
- 2.Bruccoleri R.E. and Heinrich,G. (1988) An improved algorithm for nucleic acid secondary structure display. Comput. Appl. Biosci., 4, 167–173. [DOI] [PubMed] [Google Scholar]
- 3.De Rijk P., Wuyts,J. and De Wachter,R. (2003) RnaViz 2: an improved representation of RNA secondary structure. Bioinformatics, 19, 299–300. [DOI] [PubMed] [Google Scholar]
- 4.Evers D. and Giegerich,R. (1999) RNA movies: visualizing RNA secondary structure spaces. Bioinformatics, 15, 32–37. [DOI] [PubMed] [Google Scholar]
- 5.Han K., Kim,D. and Kim,H.-J. (1999) A vector-based method for drawing RNA secondary structure. Bioinformatics, 15, 286–297. [DOI] [PubMed] [Google Scholar]
- 6.Matzura O. and Wennborg,A. (1996) RNAdraw: an integrated program for RNA secondary structure calculation and analysis under 32-bit Microsoft Windows. Comput. Appl. Biosci., 12, 247–249. [DOI] [PubMed] [Google Scholar]
- 7.Felciano R.M., Chen,R.O. and Altman,R.B. (1990) RNA secondary structure as a reusable interface to biological information resources. Gene, 190, GC59–GC70. [DOI] [PubMed] [Google Scholar]
- 8.Han K., Lee,Y. and Kim,W. (2002) PseudoViewer: automatic visualization of RNA pseudoknots. Bioinformatics, 18, S321–S328. [DOI] [PubMed] [Google Scholar]
- 9.Pleij C.W.A. (1990) Pseudoknots: a new motif in the RNA game. Trends Biochem. Sci., 15, 143–147. [DOI] [PubMed] [Google Scholar]
- 10.Hilbers C.W., Michiels,P.J.A. and Heus,H.A. (1998) New developments in structure determination of pseudoknots. Biopolymers, 48, 137–153. [DOI] [PubMed] [Google Scholar]
- 11.van Batenburg F.H.D., Gultyaev,A.P. and Pleij,C.W.A. (2001) PseudoBase: structural information on RNA pseudoknots. Nucleic Acids Res., 29, 194–195. [DOI] [PMC free article] [PubMed] [Google Scholar]
- 12.Brion P., Michel,F., Schroeder,R. and Westhof,E. (1999) Analysis of the cooperative thermal unfolding of the td intron of bacteriophage T4. Nucleic Acids Res., 27, 2494–2502. [DOI] [PMC free article] [PubMed] [Google Scholar]


