Abstract
The signals that determine activation and repression of specific genes in response to appropriate stimuli are one of the most important, but least understood, types of information encoded in genomic DNA. The nucleotide sequence patterns, or motifs, preferentially bound by various transcription factors have been collected in databases. However, these motifs appear to be individually too short and degenerate to enable detection of functional enhancer and silencer elements within a large genome. Several groups have proposed that dense clusters of motifs may diagnose regulatory regions more accurately. Cluster-Buster is the third incarnation of our software for finding clusters of pre-specified motifs in DNA sequences. We offer a Cluster-Buster web server at http://zlab.bu.edu/cluster-buster/.
INTRODUCTION
Enhancers and silencers of transcription consist of clusters of transcription factor binding sites (1,2). A number of publications have proposed to detect transcription regulatory regions by searching for clusters of the sequence motifs preferentially bound by a set of transcription factors (2–14). It remains to be seen whether this approach will be generally successful for large eukaryotic genomes. Most recent methods for finding motif clusters fall into two categories: those that count motif ‘hits’ occurring within a sequence window of some size (2,12,13), and those that employ probabilistic models (5,10,11,14). The advantage of the former methods is the intuitive clarity of what they do. Advantages of the latter are avoidance of arbitrary thresholds and the ability to integrate contributions from indefinitely many indefinitely weak motif hits. By using log likelihood ratios, model-based approaches can also claim to discriminate motif clusters from background DNA in a mathematically optimal way (the Neyman–Pearson Lemma).
We have taken the modeling approach, searching for regions of the sequence that resemble a statistical model of a motif cluster more than they resemble a model of ‘background DNA’. Our motif cluster model is for motifs to occur randomly with a uniform distribution across the region and the background model consists of independent, random nucleotides with probabilities estimated from their local abundances in the query sequence. We wish to identify subsequences whose log likelihood ratios, In [Prob (subsequence∣cluster model)/Prob (subsequence∣background model)], are maximal (i.e. they do not overlap subsequences with higher log likelihood ratios). Unfortunately, the algorithm for finding these subsequences requires time proportional to the sequence length squared and is not feasible for sequences longer than a few kb (15).
We have developed three ways of circumventing this problem. Our first program, Cister, does not directly predict motif clusters, but returns a probability curve indicating the probability that each basepair in the sequence lies within a cluster, using the linear-time Forward–Backward algorithm (10). Cister pays the price of using a slightly more complex probabilistic model with more nuisance parameters. Comet finds motif clusters in linear time with the Viterbi algorithm, but it does not calculate the full log likelihood ratio, considering only the most likely arrangement of motifs within the subsequence (11). An advantage of Comet is that it calculates E-values to indicate the statistical significance of its predictions. Cluster-Buster tackles the problem head-on, employing a linear-time heuristic which attempts to return the same cluster predictions as the full quadratic-time algorithm. As a test we applied Cluster-Buster and an implementation of the quadratic-time algorithm to a set of 27 short sequences. The two programs returned the exact same 19 clusters. So Cluster-Buster appears to be extremely successful at emulating the exact algorithm.
In constructing the Cluster-Buster web server, we have gone to unusual lengths to make it convenient to use. For example, every option on the input form is linked to a pop-up help box which describes its purpose. The output provides an overview figure depicting the locations of motif clusters and annotated protein-coding regions in the sequence, followed by graphics and tables that detail the motifs within each cluster. We also provide a Linux executable of Cluster-Buster for download, which would be necessary for large-scale or highly customized use. Cluster-Buster is extremely fast, requiring ∼5 s to analyze a megabase of sequence with five motifs on a 1.6 GHz Athlon processor. That extrapolates to about 4 h for the whole human genome.
INPUT
Cluster-Buster takes two required items of input: a DNA sequence and a selection of motifs, and optionally a small number of parameters may be varied to tune its behavior. The sequence may be in raw, Fasta or GenBank format. If GenBank format is used, any annotated protein-coding regions (CDS) will be drawn in the results overview figure along with the motif clusters. Alternatively, if the user simply enters a GenBank identifier, the web server will automatically fetch the sequence. The web server, but not the downloadable program, limits the sequence length to 100 kb. Motifs are entered as 4×N matrices, where rows correspond to sequential positions in the motif and columns indicate abundances of A, C, G and T at each position. A limited number of built-in motifs are provided as checkboxes and matrices can be copied and pasted directly from the TRANSFAC website (16). A user of Cluster-Buster must begin with a hypothesis that a particular set of motifs may occur in clusters.
The tunable parameters include a gap parameter, residue abundance range and pseudocount. The gap parameter indicates the average distance between motifs within a cluster in Cluster-Buster's internal model of motif clusters. Low values enhance the program's sensitivity for tight clusters of weak motifs and high values enhance its sensitivity for loose clusters of strong motifs. Cluster-Buster's model of background DNA varies across the sequence to take account of fluctuations in nucleotide abundances. The residue abundance range specifies how far either side of each point in the sequence to count residue frequencies. The pseudocount is added to all entries in all motif matrices. Pseudocounts are a widely used technique, with a theoretical underpinning in Bayesian statistics, for estimating underlying frequencies from a limited number of counts. The web server also allows low-complexity regions, such as microsatellites or poly(A) tracts, to be filtered from the sequence using the program dust (R. Tatusov and D. Lipman, unpublished). Another option is to filter sequence regions written with lowercase letters, which is becoming a standard way of indicating repetitive elements. The repetitive nature of such regions may lead to artefactually strong motif clusters, but in some cases they may contain genuine regulatory elements.
OUTPUT
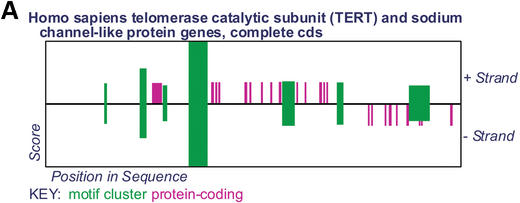
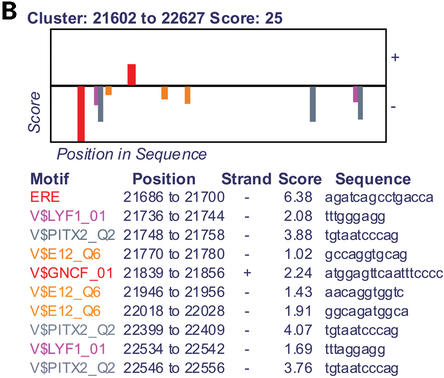
Cluster-Buster produces an overview diagram indicating the locations of motif clusters with score higher than a user-specified threshold and any annotated coding regions (Fig. 1A), followed by details of the motifs within each cluster (Fig. 1B). The overview represents motif clusters as green rectangles whose horizontal position indicates their position in the sequence and whose height is proportional to their log likelihood ratio score. Protein-coding regions on the forward strand are drawn as purple rectangles above the central line and those on the reverse strand are drawn below the line.
Figure 1.
(A) Overview of motif clusters and protein-coding regions in GenBank sequence AY007685. (B) Detailed view of the second strongest motif cluster.
In the details figure, motifs are drawn as color-coded rectangles above or below the line according to the strand they are on (relative to the motif matrix; the ERE appears on only one strand in Fig. 1B because we used a slightly non-palindromic matrix to represent this motif ). The heights of the motif rectangles represent their log likelihood ratio scores using the standard weight matrix technique (17). A table below this figure lists the position, strand, score and sequence of each motif.
METHOD
The Cluster-Buster algorithm, in outline, consists of three steps:
Perform one pass of the Forward algorithm to obtain the log likelihood score s[i] for each subsequence beginning at nucleotide 1 and ending at nucleotide i. Keep track of the subsequences (a,b) where the score increase s[b]−s[a] is maximal (i.e. they do not overlap another subsequence with a larger score increase).
For each of these subsequences, we consider the end-point b to be reliable, but the start-point a to be unreliable. Perform the Backward algorithm beginning at b and continuing until slightly before a, to refine the optimal start-point.
Remove subsequences that overlap higher scoring subsequences with a greedy algorithm.
This method bears some resemblance to one that has been used earlier for protein fold recognition (18).
Acknowledgments
ACKNOWLEDGEMENTS
M.F. is a Howard Hughes Medical Institute Predoctoral Fellow. This project was partially funded by NSF grants DBI-0078194 and DBI-0116574 and NIH grant 1P20GM066401-01.
REFERENCES
- 1.Arnone M.I. and Davidson,E.H. (1997) The hardwiring of development: organization and function of genomic regulatory systems. Development, 124, 1851–1864. [DOI] [PubMed] [Google Scholar]
- 2.Berman B.P., Nibu,Y., Pfeiffer,B.D., Tomancak,P., Celniker,S.E., Levine,M., Rubin,G.M. and Eisen,M.B. (2002) Exploiting transcription factor binding site clustering to identify cis-regulatory modules involved in pattern formation in the Drosophila genome. Proc. Natl Acad. Sci. USA, 99, 757–762. [DOI] [PMC free article] [PubMed] [Google Scholar]
- 3.Prestridge D.S. (1995) Predicting Pol II promoter sequences using transcription factor binding sites. J. Mol. Biol., 249, 923–932. [DOI] [PubMed] [Google Scholar]
- 4.Kondrakhin Y.V., Kel,A.E., Kolchanov,N.A., Romashchenko,A.G. and Milanesi,L. (1995) Eukaryotic promoter recognition by binding sites for transcription factors. Comput. Appl. Biosci., 11, 477–488. [DOI] [PubMed] [Google Scholar]
- 5.Crowley E.M., Roeder,K. and Bina,M. (1997) A statistical model for locating regulatory regions in genomic DNA. J. Mol. Biol., 268, 8–14. [DOI] [PubMed] [Google Scholar]
- 6.Frech K., Danescu-Mayer,J. and Werner,T. (1997) A novel method to develop highly specific models for regulatory units detects a new LTR in GenBank which contains a functional promoter. J. Mol. Biol., 270, 674–687. [DOI] [PubMed] [Google Scholar]
- 7.Wasserman W.W. and Fickett,J.W. (1998) Identification of regulatory regions which confer muscle-specific gene expression. J. Mol. Biol., 278, 167–181. [DOI] [PubMed] [Google Scholar]
- 8.Krivan W. and Wasserman,W.W. (2001) A predictive model for regulatory sequences directing liver-specific transcription. Genome Res., 11, 1559–1566. [DOI] [PMC free article] [PubMed] [Google Scholar]
- 9.Wagner A. (1999) Genes regulated cooperatively by one or more transcription factors and their identification in whole eukaryotic genomes. Bioinformatics, 15, 776–784. [DOI] [PubMed] [Google Scholar]
- 10.Frith M.C., Hansen,U. and Weng,Z. (2001) Detection of cis-element clusters in higher eukaryotic DNA. Bioinformatics, 17, 878–889. [DOI] [PubMed] [Google Scholar]
- 11.Frith M.C., Spouge,J.L., Hansen,U. and Weng,Z. (2002) Statistical significance of clusters of motifs represented by position specific scoring matrices in nucleotide sequences. Nucleic Acids Res., 30, 3214–3224. [DOI] [PMC free article] [PubMed] [Google Scholar]
- 12.Markstein M., Markstein,P., Markstein,V. and Levine,M.S. (2002) Genome-wide analysis of clustered dorsal binding sites identifies putative target genes in the Drosophila embryo. Proc. Natl Acad. Sci. USA, 99, 763–768. [DOI] [PMC free article] [PubMed] [Google Scholar]
- 13.Rebeiz M., Reeves,N.L. and Posakony,J.W. (2002) SCORE: a computational approach to the identification of cis-regulatory modules and target genes in whole-genome sequence data. Site clustering over random expectation. Proc. Natl Acad. Sci. USA, 99, 9888–9893. [DOI] [PMC free article] [PubMed] [Google Scholar]
- 14.Rajewsky N., Vergassola,M., Gaul,U. and Siggia,E.D. (2002) Computational detection of genomic cis-regulatory modules applied to body patterning in the early Drosophila embryo. BMC Bioinformatics, 3, 30. [DOI] [PMC free article] [PubMed] [Google Scholar]
- 15.Rivas E. and Eddy,S.R. (2001) Noncoding RNA gene detection using comparative sequence analysis. BMC Bioinformatics, 2, 8. [DOI] [PMC free article] [PubMed] [Google Scholar]
- 16.Wingender E., Chen,X., Hehl,R., Karas,H., Liebich,I., Matys,V., Meinhardt,T., Pruss,M., Reuter,I. and Schacherer,F. (2000) TRANSFAC: an integrated system for gene expression regulation. Nucleic Acids Res., 28, 316–319. [DOI] [PMC free article] [PubMed] [Google Scholar]
- 17.Stormo G.D. (2000) DNA binding sites: representation and discovery. Bioinformatics, 16, 16–23. [DOI] [PubMed] [Google Scholar]
- 18.He H. (2002) Protein domain dissection using stochastic modeling. PhD Thesis, Boston University, Boston, USA.


