Abstract
WebFEATURE (http://feature.stanford.edu/webfeature/) is a web-accessible structural analysis tool that allows users to scan query structures for functional sites in both proteins and nucleic acids. WebFEATURE is the public interface to the scanning algorithm of the FEATURE package, a supervised learning algorithm for creating and identifying 3D, physicochemical motifs in molecular structures. Given an input structure or Protein Data Bank identifier (PDB ID), and a statistical model of a functional site, WebFEATURE will return rank-scored ‘hits’ in 3D space that identify regions in the structure where similar distributions of physicochemical properties occur relative to the site model. Users can visualize and interactively manipulate scored hits and the query structure in web browsers that support the Chime plug-in. Alternatively, results can be downloaded and visualized through other freely available molecular modeling tools, like RasMol, PyMOL and Chimera. A major application of WebFEATURE is in rapid annotation of function to structures in the context of structural genomics.
INTRODUCTION
With the emergence of structural genomics projects worldwide, experimentally and computationally derived structural models are quickly filling up databases (1). Yet, understanding how structure relates to function has come piecemeal, from work on single structures or family of structures. Biologists face the dilemma of understanding large, rapidly growing, structural data sets. Thus there is an increasing need for automated tools to assist them in the analysis of structure and annotation of function.
Structure-based approaches for assigning function to a molecule are similar to sequence-based methods in that they look at conserved properties of related sites of interest. However, structure-based methods can look beyond the local sequence and identify conservation of properties in 3D space. Methods such as PROCAT (2) and Fuzzy Functional Forms (3) build models of the sites from the conserved geometry of carefully identified conserved residues. Another method, FEATURE (4), can look beyond residue identity and include additional biophysical and biochemical properties related to function in 3D space. The FEATURE system automatically builds statistical models using a supervised learning algorithm to discover the conserved properties from a training set. The models represent the statistical distribution of physicochemical properties at radial distances from the site of interest. By using properties at the atomic versus residue level, FEATURE can better describe the chemical patterns behind functional sites. In addition, FEATURE supports analysis of proteins, nucleic acids, and their complexes. Details on the FEATURE system and its applications have been published previously (5–7).
MATERIALS AND METHOD
FEATURE system
FEATURE uses a supervised learning algorithm for automated discovery of physical and chemical descriptions of protein microenvironments. The scanning algorithm and scoring function provides predictive capabilities to the FEATURE system (8,9). A user provides examples of sites and non-sites as input to the training portion of FEATURE. Sites are locations with a common structural or functional role, such as calcium binding. Non-sites are locations where that function does not occur or a different function is present. The output of the training algorithm is a model of the spatio-physicochemical properties that significantly differentiate the sites from the non-sites as determined by the Wilcoxon rank sum test on the distribution of the properties in the sites versus the non-sites.
This model is then used as part of the input to the scanning algorithm of FEATURE. The scanning portion of FEATURE uses the site model to scan grid points laid over a query structure for similar sites within a significant cut-off. The physicochemical environment around each grid point is used in a log-odds scoring function (Eq. 1) to provide a score suggesting the likelihood that a grid point is a site of interest. The higher the score, the more likely the point is a site of interest. Coordinates of likely sites and their scores are returned as output to the user. The output can then be analyzed and visualized in a number of ways. Details of the statistical model, learning method and inference method are available in previous publications (4–8).
A web interface for FEATURE
Until now, FEATURE was not accessible through the World Wide Web. The FEATURE package previously required downloading of the source code, installation and compilation on a local workstation or server. We present WebFEATURE, a web interface to FEATURE's scanning algorithm that allows the user to scan and visualize functional sites in a structure of interest. By integrating the results of a FEATURE scan with molecular visualization, via the Chime plug-in, WebFEATURE provides an intuitive and interactive interface for rapid analysis of functional sites without the need for complicated installation of software. WebFEATURE allows biologists to quickly determine whether their molecule in question possesses possible site(s) of biochemical interest. Users on platforms that do not support Chime can still use the web interface to scan structures, but visualization and interaction with the results will be done off-line.
WebFEATURE provides previously generated and tested site models for use in scanning query structures. The models include for proteins: calcium binding sites, chloride binding sites and ATP binding sites; and for RNA: site-bound magnesium sites and diffusely bound magnesium sites. Details on the generation and performance of these models have been presented elsewhere (Banatao, D.R., Altman, R.B. and Klein, T.E., submitted) (9). Background information regarding the physicochemical properties, score cutoffs and general performance of the site models are available as links from the main page of the WebFEATURE website.
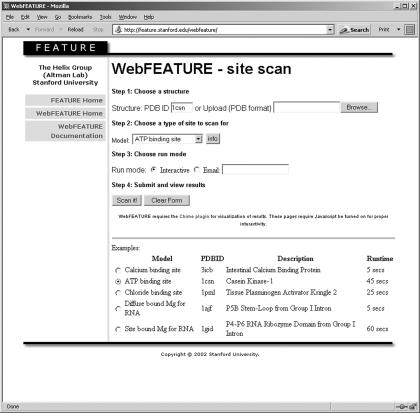
The WebFEATURE interface is simple and intuitive, as seen in Figure 1. The main web page provides links to background information about WebFEATURE and the FEATURE system in general. Scanning a structure consists of a few simple steps. First, the user can upload a structure from their local machine (in PDB format) or if the structure is publicly available, enter the PDB identifier (http://www.rcsb.org/) (10). Next, the user chooses a site model to use for scanning and submits the job to the WebFEATURE server. WebFEATURE can provide its results in a web page in real time (for smaller structures) or by sending an email to the user with a URL pointing to a web page hosting the results of the scan. It is recommended to use the notification by email option for large structures as it takes 14 min for WebFEATURE to return scan results on the large subunit of the ribosome (PDB ID: 1jj2). Results are temporarily stored for a period of 1 week and can also be downloaded for further analysis.
Figure 1.
The WebFEATURE interface allows the user to choose a structure to scan by either entering a PDB ID or uploading a structure from the local computer. The user also chooses a site model to use for scanning from the pull-down menu and has the option of receiving email notification of results. The user can retrieve more information on the selected model by clicking the info button.
RESULTS
Visualizing and interpreting results
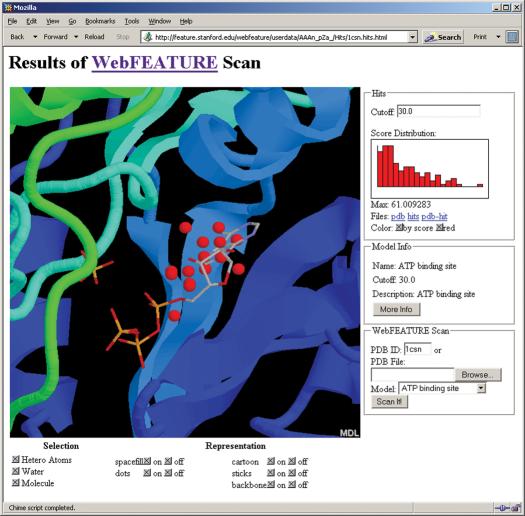
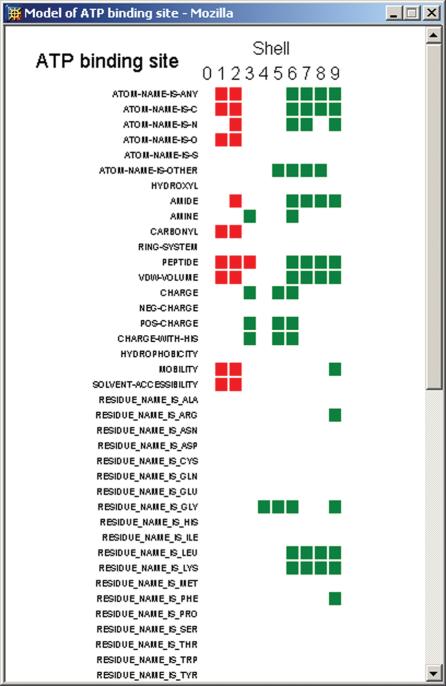
Visualization remains the best way to quickly understand the results of a WebFEATURE scan. Figure 2 shows the output of a WebFEATURE scan in a web browser using the Chime plug-in for molecular visualization. Potential sites, or hits, are superimposed on the query structure in the Chime viewer. For novice Chime users, WebFEATURE provides buttons that link to simple Chime-scripts in order to control the representation of the molecule and WebFEATURE hits. Advanced Chime users can click the right mouse-button over the molecule viewer window to access Chime's full command menu. Chime interprets hits as the residue type HIT and their scores are colored by temperature. An interactive histogram plotting the hit-score distribution allows the user to display hits only above a certain cutoff by clicking on the histogram. Alternatively, a score cutoff can be entered in the ‘Cutoff’ text field. The results page also provides information about the statistical model used for scanning the structure. The model info pane provides the name, suggested score cutoff, description and a link to display the 2D plot of the statistical model. The 2D plot shows the statistically abundant and deficient properties in the sites versus the non-sites as plotted against the radial volumes. This plot, such as in Figure 3, shows the physicochemical characteristics of the site.
Figure 2.
The output of a WebFEATURE scan for an ATP binding site in Casein Kinase-1 (PDB ID: 1csn) shows the hits, above cutoff, superimposed on the structure and crystallographically bound ATP. Hit score statistics are plotted in a histogram to the right of the Chime viewer. By entering a new cutoff in the Cutoff text field, or by clicking on the histogram, the user can change the displayed hits by score. Buttons are provided to change the representation of the molecule and hits. Details on the statistical model are also provided.
Figure 3.
WebFEATURE provides a 2D plot of the statistical model for each available functional site. In this model for ATP binding, each cell represents the significance of a property in a radial volume around the functional site. Properties that are significantly present in the sites versus the non-sites are marked in green and those that are significantly absent are marked in red.
In order to avoid the definition of new file formats, the PDB format is used for reporting output to Chime and RasMol. Hits are assigned residue type ‘HIT’ and their scores are located in the standard PDB field for B-factor/temperature.
Interactive Chime visualization works best in Internet Explorer 6.0 on platforms running Windows 2000 or better. Macintosh support is limited to Netscape Communicator 4.75 on OS 8.6 and 9. A list of hardware and software requirements for Chime is available at http://www.mdlchime.com/chime/.
Offline analysis
WebFEATURE results are also available for download as a list of 3D coordinates and scores to be used for off-line analysis in RasMol, PyMOL and Chimera. This is particularly useful for platforms that do not support Chime and for more advanced analysis. RasMol is a popular open-source software for quick visualization of molecules supported on many platforms and is available at http://www.openrasmol.org/ (11). PyMOL is an open-source molecular modeling package and is available at http://www.pymol.org/. Chimera is an extensible molecular modeling package and is available at http://www.cgl.ucsf.edu/chimera/ (12). These visualization tools provide a powerful command line for expert users, higher level modeling functions, publication quality graphics rendering, 3D visualization, and integration with results of other analyses such as sequence alignments, electrostatics, DOCKing or molecular dynamics.
From the WebFEATURE website, we provide python scripts that interact with the above programs to allow a more powerful analysis of results. The PyMOL script controls the WebFEATURE results with a few commands from the PyMOL command line interface. The extension to Chimera uses a graphical user interface to control the WebFEATURE results. RasMol is more limited in extendibility, but for users familiar with the RasMol command interface, we provide scripting commands to mimic interactivity achieved in Chime. Further details on the use of the RasMol, PyMOL and Chimera scripts are available in the WebFEATURE documentation web page.
DISCUSSION
The WebFEATURE interface to FEATURE scan allows biologists to quickly annotate functions for a molecule of interest. WebFEATURE may be useful in the context of structural genomics, where there are increasing numbers of structures and models of unknown function. WebFEATURE should be increasingly useful as structure prediction and homology modeling techniques improve. Once proteins of unknown function are modeled from sequence, the predicted structures can be fed into WebFEATURE to search for potential functional sites. WebFEATURE will also be useful in testing the performance of structure prediction tools by assessing the ability of a modeling technique to preserve a known functional site in 3D space. Future releases of WebFEATURE will include the training algorithm of the FEATURE system, which may improve its utility to biologists wishing to create site models of a particular function. We are also generating a larger public library of site models in order to offer a variety of functional site models for use in scanning.
Acknowledgments
ACKNOWLEDGEMENTS
The authors wish to thank Dr Francois Major and Dr Patrick Gendron for providing access to the MC-Annotate server. This work is supported by NIH Grants LM-05652 and LM-06422 (R.B.A.), and by NHGRI HG02518 (D.L.B.). D.R.B. is supported by NIH 2 R25 GM056847-04 and is a PhD candidate in the Graduate Program in Biological and Medical Informatics at the University of California, San Francisco. M.P.L. is supported by NIH grants LM-05652, LM-07033, GM-63495 and HG-02235 and is a PhD candidate in the Biomedical Informatics Training Program at Stanford University.
REFERENCES
- 1.Burley S.K. and Bonanno,J.B. (2002) Structuring the universe of proteins. Annu. Rev. Genom. Hum. Genet., 3, 243–262. [DOI] [PubMed] [Google Scholar]
- 2.Wallace A.C., Laskowski,R.A. and Thornton,J.M. (1996) Derivation of 3D coordinate templates for searching structural databases: application to Ser-His-Asp catalytic triads in the serine proteinases and lipases. Protein Sci., 5, 1001–1013. [DOI] [PMC free article] [PubMed] [Google Scholar]
- 3.Fetrow J.S. and Skolnick,J. (1998) Method for prediction of protein function from sequence using the sequence-to-structure-to-function paradigm with application to glutaredoxins/thioredoxins and T1 ribonucleases. J. Mol. Biol., 281, 949–968. [DOI] [PubMed] [Google Scholar]
- 4.Bagley S.C. and Altman,R.B. (1995) Characterizing the microenvironment surrounding protein sites. Protein Sci., 4, 622–635. [DOI] [PMC free article] [PubMed] [Google Scholar]
- 5.Waugh A., Williams,G.A., Wei,L. and Altman,R.B. (2001) Using meta computing tools to facilitate large-scale analyses of biological databases. Pac. Symp. Biocomput., 6, 360–371. [DOI] [PubMed] [Google Scholar]
- 6.Wei L., Altman,R.B. and Chang,J.T. (1997) Using the radial distributions of physical features to compare amino acid environments and align amino acid sequences. Pac. Symp. Biocomput., 2,465–476. [PubMed] [Google Scholar]
- 7.Wei L., Huang,E.S. and Altman,R.B. (1999) Are predicted structures good enough to preserve functional sites? Structure Fold Des., 7, 643–650. [DOI] [PubMed] [Google Scholar]
- 8.Bagley S.C. and Altman,R.B. (1996) Conserved features in the active site of nonhomologous serine proteases. Fold Des., 1, 371–379. [DOI] [PubMed] [Google Scholar]
- 9.Wei L. and Altman,R.B. (1998) Recognizing protein binding sites using statistical descriptions of their 3D environments. Pac. Symp. Biocomput., 3, 497–508. [PubMed] [Google Scholar]
- 10.Berman H.M., Westbrook,J., Feng,Z., Gilliland,G., Bhat,T.N., Weissig,H., Shindyalov,I.N. and Bourne,P.E. (2000) The Protein Data Bank. Nucleic Acids Res., 28, 235–242. [DOI] [PMC free article] [PubMed] [Google Scholar]
- 11.Sayle R.A. and Milner-White,E.J. (1995) RASMOL: biomolecular graphics for all. Trends Biochem. Sci., 20, 374. [DOI] [PubMed] [Google Scholar]
- 12.Huang C.C., Couch,G.S., Pettersen,E.F. and Ferrin,T.E. (1996) Chimera: An extensible molecular modeling application constructed using standard components. Pac. Symp. Biocomput., 1, 724. [Google Scholar]


