Abstract
Computational methods such as sequence alignment and motif construction are useful in grouping related proteins into families, as well as helping to annotate new proteins of unknown function. These methods identify conserved amino acids in protein sequences, but cannot determine the specific functional or structural roles of conserved amino acids without additional study. In this work, we present 3matrix (http://3matrix.stanford.edu) and 3motif (http://3motif.stanford.edu), a web-based sequence motif visualization system that displays sequence motif information in its appropriate three-dimensional (3D) context. This system is flexible in that users can enter sequences, keywords, structures or sequence motifs to generate visualizations. In 3motif, users can search using discrete sequence motifs such as PROSITE patterns, emotifs, or any other regular expression-like motif. Similarly, 3matrix accepts an ematrix position-specific scoring matrix, or will convert a multiple sequence alignment block into an ematrix for visualization. Each query motif is used to search the protein structure database for matches, in which the motif is then visually highlighted in three dimensions. Important properties of motifs such as sequence conservation and solvent accessible surface area are also displayed in the visualizations, using carefully chosen color shading schemes.
INTRODUCTION
The amount of sequence information associated with a given protein or protein family almost always exceeds corresponding structural information. As a result, many computational approaches have used sequence information to discern clues about the function of a new protein or group of related proteins. One such approach has been the use of multiple sequence alignment methods to create families of related proteins (1,2). The conservation information contained in a multiple sequence alignment is often condensed into a sequence motif to provide a tool for easily assigning new sequences to the family. These motifs are compact representations of alignment information and are useful both in concisely describing the homologous regions shared among proteins in a family and in providing a method for classifying new protein sequences (3,4). Often, motifs identify structurally or functionally important regions within a family of proteins, such as catalytic sites, substrate binding sites and intermolecular interaction sites.
Sequence motifs are usually either probabilistic or discrete. Probabilistic motifs are most often represented as scoring matrices, known in some implementations as position-specific scoring matrices (5), profiles (6) or weight matrices (7). These matrices contain probabilities (or scores) that express the likelihood of different amino acids occurring at each sequence position. In contrast, discrete motifs or patterns, are regular expression-like constructions that identify specific residues or groups of residues conserved in an alignment block (8,9). Instead of representing a block as a matrix of amino acid probabilities, discrete motifs are single expressions in which amino acids or groups of amino acids are either allowed or disallowed at each position.
Although an overall functional assignment can sometimes be made given the presence of one or more sequence motifs in a protein sequence, the specific functional roles of the conserved amino acids are not usually clear without additional study. However, one is often most interested in the specific mechanism of activity or functional roles of conserved amino acids in motifs. In this paper, we present 3matrix and improvements to the previously reported 3motif (10), as a unified probabilistic and discrete motif visualization system. This system is designed to bridge the gap between sequence motifs and existing structural data by providing a three-dimensional (3D) structural context for conserved amino acids. Specifically, our visualization system maps a number of sequence motif databases to protein structures in the Protein Data Bank (PDB) (11).
Although a variety of visualization approaches have been used to display sequence homology information, most have focused on one-dimensional (1D) multiple sequence alignment diagrams, such as early text-only systems (12,13), and more recent graphical systems that embed other information, such as motifs (14–18). Including 3D structure information in sequence homology visualization has been less explored, however. The JOY software (19) applies font transformations to text characters in alignment diagrams according to a number of structural properties, but includes no 3D visualization. Some newer packages include limited visualization of sequence conservation mapped onto 3D protein structures, such as PROSITE patterns in PDBSum and STRAP (20,21) and multiple sequence alignment information in COMBOSA3D (22), but either require significant user intervention or limit the types of motifs that can be visualized.
The benefits of 3matrix and 3motif are 3-fold. Firstly, the structural representation provides information about the potential functional or structural contributions of sequence motif residues. For structural examples of conserved sequence motifs to be meaningful in comparison with proteins of unknown structure, it is assumed that motifs will generally have the same local 3D structure in whatever protein they are found. We have observed this to be the case by analyzing sequence motif population of the SCOP structural hierarchy and by performing structural alignment experiments in which conserved amino acids in sequence motifs were found to align with significantly low RMSD (data not shown). Hence, by linking structural examples to sequence motifs, we are able to gather clues as to why particular residues are conserved at certain positions in protein families. Secondly, the structural environments of these conserved residues allow one to better target them for further experimentation, such as mutagenesis or drug design. Thirdly, our system is flexible in that one only needs to specify one piece of information; a keyword, protein sequence, sequence motif or structure. Many previous methods require users to look up and provide multiple pieces of information, such as both a sequence motif and an appropriate structure.
MATERIALS AND METHODS
All structures in the PDB were searched for emotifs, ematrixes, PROSITE patterns and BLOCKs. Results were organized into a database of flat files with indexes maintained in system memory for fast query lookup. The interactive graphics in 3matrix and 3motif are rendered using the Chime plugin, written by MDL Information Systems (http://www.mdl.com/chime/). For users that cannot run Chime in their browsers, each visualization web page dynamically creates RasMol scripts for download. These scripts provide the same visualization in RasMol that Chime users see in their web browsers. All solvent accessibility values were obtained using DSSP (23). 3matrix and 3motif were developed on, and served from a dual-processor AMD 1.2 GHz Athlon machine with 2 Gb of RAM, running RedHat Linux 7.1. Source code and installable packages are freely available for academic use upon request.
RESULTS
Data input and navigation
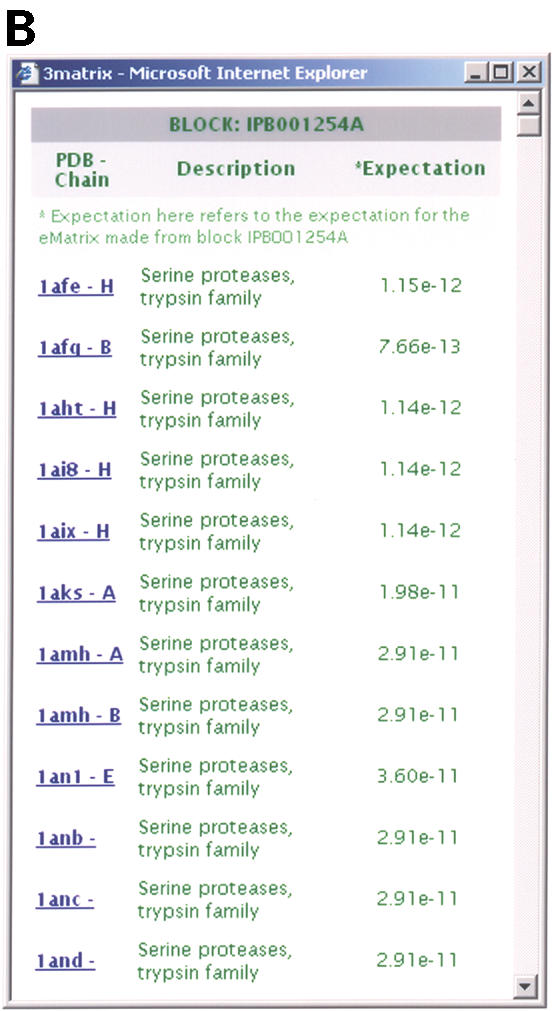
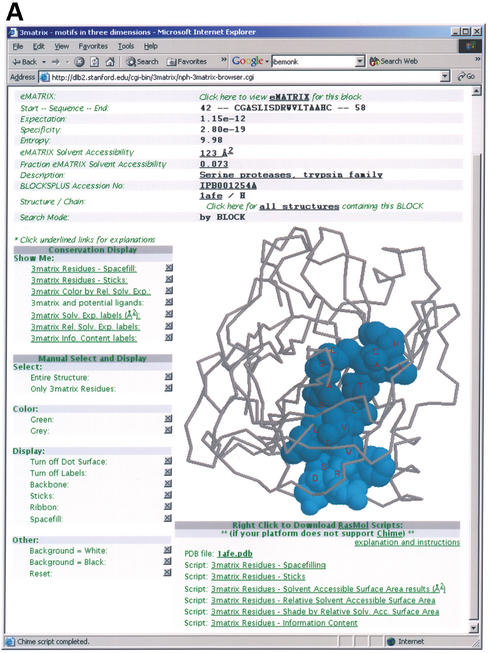
3matrix and 3motif visually highlight motifs in protein structures that contain them and accept a wide range of input. Both systems allow users to get started by entering either a protein sequence or a keyword. In the case of a submitted protein sequence, 3matrix and 3motif first search the sequence for motif hits, then provide visualizations of those motifs. In the case of a keyword search, the description fields of BLOCKS+ multiple sequence alignments from which emotifs and ematrixes are built, are searched for matches, and the appropriate motifs are then visualized. In 3motif, users can also provide a discrete sequence motif such as an emotif or PROSITE pattern, as well as any general regular expression a user may have from another motif-building method. Similarly, 3matrix accepts an ematrix position-specific scoring matrix (PSSM) or multiple sequence alignment block as input. 3matrix also allows the user to supply an expectation cutoff, providing the ability to adjust the stringency of the matrix matches in the PDB. After a sequence motif query is submitted, 3matrix and 3motif search all PDB structures for a match. A highlighted 3D representation of the motif is then rendered in the browser where the user can manipulate it. One can also supply a 4-character PDB ID, creating a visualization in which the first emotif or ematrix found in the query structure is displayed. Figure 1A illustrates a typical 3matrix visualization.
Figure 1.

3matrix visualization of the block query IPB001254A, a serine protease sequence alignment block. The ematrix built from this block is found and displayed here in PDB ID 1AFE, the crystal structure of human thrombin complexed with an inhibitor. (A) The main 3matrix visualization window. The lower right structure display window displays the 1AFE structure with the ‘spacefilling’ option selected for the conserved residues in the scoring matrix, with the blue shading determined by conservation strength. The top of the page contains summary information about the sequence motif, as well as links to the PDB and BLOCKS+ database. The panels on the left of the structure allow the user to display and manipulate the structure display in a variety of ways. (B) The control window for the IPB001254A window. Selecting the ‘all structures’ link in the main 3matrix window opens this window, which lists all PDB structures and chains containing significant matches with ematrixes built from this block. Selecting any of these structures loads it back into the main display window with the sequence motif highlighted in it.
3matrix and 3motif initially display a visualization of the first result of a query because most often, one desires only an example of a particular motif in a structure. The software provides a simple way to view all results, however, via a link near the top of each page. This link spawns a second ‘control’ window containing all results (Fig. 1B); selecting any result loads it back into the main display window. This feature allows one to easily navigate between any number of structures containing a motif of interest, or if one is searching by PDB ID, between any number of motifs within the query structure.
3matrix and 3motif are designed for interoperability with other bioinformatics resources on the internet. Linking to these tools is straightforward, with detailed instructions available on the main web pages. Examples of this are additions to the emotif-search component of the emotif software suite (http://motif.stanford.edu/emotif/) and the ematrix-search component of the ematrix software suite (http://motif.stanford.edu/ematrix/). When one submits a protein sequence to emotif-search, or ematrix-search, a hyperlink to 3motif or 3matrix appears next to each resulting motif that has a structural example in the PDB. In this way, one can seamlessly move from these sequence analysis tools to the structural information displayed in 3matrix and 3motif. Any similar resource can link to these tools in the same way, using them for structural visualization of suitable sequence conservation data.
Visualization
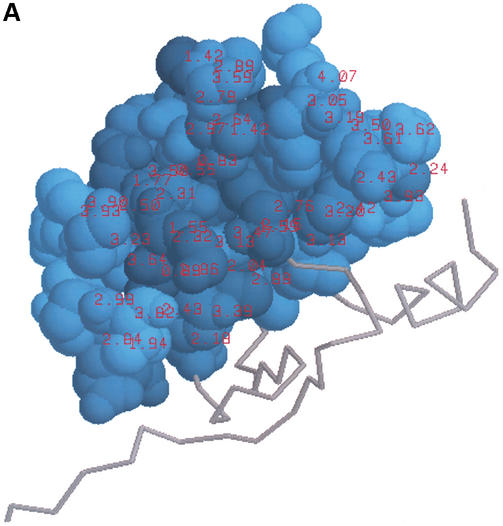
In addition to highlighting the conserved residues in a motif, 3matrix and 3motif include a significant amount of additional information in the visualization. As an illustration of these features, we chose an example sequence for analysis. To find an interesting sequence that has not been extensively studied and might closely mirror a real query, we used the eproteome database (http://eproteome.stanford.edu, publication in preparation) to retrieve all Drosophila melanogaster genomic sequences that had no significant BLAST homology with SWISS-PROT, yet had a highly significant ematrix hit. From these sequences, we selected a protein sequence of unknown function (Drosophila gene CG5603, GenPept accession number AAF52901). This sequence also had no hits in Pfam and had conflicting functional annotation in the Drosophila genome databases (http://flybase.bio.indiana.edu, http://www.fruitfly.org/annot/). The sequence was entered as a query in ematrix-search and the result indicated that an ematrix created from the InterPro block IPB000938 had a significant match with the sequence, and also had a structural example in 3matrix. The presence of an ematrix sequence motif from IPB000938 indicates with high probability that the protein contains a glycine-rich cytoskeletal associating protein (CAP-Gly) domain. Selecting the link to 3matrix brought up the structural visualization of the sequence motif in 1LPL, the only PDB structure containing this sequence motif with high probability (Fig. 2A). This structure is of a CAP-Gly domain from Caenorhabditis elegans (24), and the same visualization can also be generated by entering the InterPro block ID (IPB000938) directly into the main 3matrix search page.
Figure 2.
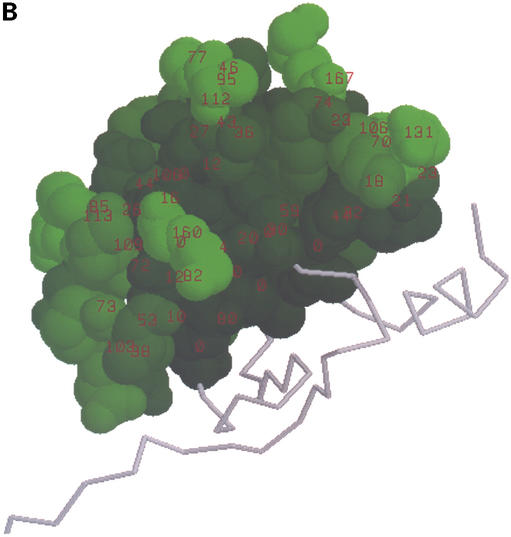
3matrix visualizations for sequence motif found in D.melanogaster gene CG5603. This motif built from block IPB000938 is found in a single PDB structure, 1LPL, displayed here with the highlighted motif. (A) Conservation-based amino acid shading. Motif amino acids are colored with a shade of blue determined by the information content of the sequence motif at that position. The shades of blue are determined in a perceptually correct way, such that perceived color differences correspond properly to differences in information content. Information content values at each position are displayed as red labels. (B) Solvent accessible surface area amino acid shading. Motif amino acids are colored with a shade of green determined by the relative solvent accessible surface area of the amino acid at each motif position. Solvent accessible surface area values (in Å2) are displayed as red labels.
In all visualizations, 3motif and 3matrix calculate and display the degree of conservation and the chemical environments of conserved amino acids. In the case of discrete sequence motifs, the degree of conservation, or sequence variability, is approximated by the number of amino acids allowed at each position in the motif expression. For probabilistic motifs, as in our Drosophila example, we express the sequence variability as the information content in each column of the matrix. 3motif and 3matrix then color the motif's conserved positions in the structure accordingly, with amino acid atoms at each position in the motif given a shade of blue determined by the sequence variability at that position. Positions of low sequence variability appear as a bright blue, whereas highly variable positions appear as a darker blue. In this way, the software creates visual cues for determining which positions in a motif are more strongly conserved, as shown in Figures 1A and 2A. In our CAP-Gly example, we see that several surface locations thought by the crystallographers to be key interaction surfaces are lined with highly conserved amino acids, as indicated by the bright blue shading (Fig. 2A). In contrast, many interior-facing amino acids are less conserved and appear to be mostly hydrophobic residues required for packing of the domain's core and, hence, are not as specifically conserved. In addition to simply shading the amino acids based on conservation, the software also provides the option to paint the actual information content values onto the conserved amino acids in the structure as labels, as shown in Figure 2A.
3matrix and 3motif encode the chemical environments of motif residues through the calculation and display of solvent accessible surface area (SASA). In any visualization, the summary information at the top of the page includes the motif's total SASA in Å2, as well as the average relative solvent accessibility of the amino acids in the motif. Here, the relative solvent accessible surface area of an amino acid is defined as its observed solvent accessibility in a protein divided by its maximum possible solvent accessibility. Analogous to the attachment of information content values as labels in the protein structure, numerical SASA values can also be use as labels as well. For a visual representation of solvent accessibility characteristics of motif amino acids, 3motif and 3matrix also provide the option to shade the amino acids in a green color gradient according to accessibility, similar in approach to the conservation strength shading scheme discussed above. Figure 2B shows the IPB000938 ematrix found in 1LPL with this shading scheme selected. Comparing the accessibility and conservation shading, we can confirm that several of the most solvent-exposed amino acids are also the most highly conserved in this motif, an expected result for a motif known to represent a protein–protein interaction domain.
DISCUSSION
3motif (http://3motif.stanford.edu/) and 3matrix (http://3matrix.stanford.edu/) are web programs that permit one to view conserved protein sequence motifs in a structural context. These tools provide a number of ways to search, such as entering protein sequences, keywords, structures or motifs directly into the main web pages, or through other bioinformatics internet resources that provide links from their results. One can then view and manipulate motifs three-dimensionally with a number of visualization options, such as shading schemes that allow users to color sequence motifs by conservation strength and solvent accessibility. In addition, 3motif and 3matrix provide several ways to select and display sequence motif atoms, and provide links to data related to query motifs. Ultimately, these tools provide a way to gather clues about the structural locations of conserved motif amino acids, and their chemical environments, affording better functional understanding and more targeted experimental design.
Acknowledgments
ACKNOWLEDGEMENTS
We thank Serge Saxonov for his help with the eproteome database. This work was supported by a predoctoral fellowship from the National Science Foundation, the NIH Cell and Molecular Biology Training Grant and a grant from the National Human Genome Research Institute (HG02235).
REFERENCES
- 1.Bateman A., Birney,E., Cerruti,L., Durbin,R., Etwiller,L., Eddy,S.R., Griffiths-Jones,S., Howe,K.L., Marshall,M. and Sonnhammer,E.L. (2002) The Pfam protein families database. Nucleic Acids Res., 30, 276–280. [DOI] [PMC free article] [PubMed] [Google Scholar]
- 2.Henikoff S., Henikoff,J.G. and Pietrokovski,S. (1999) Blocks+: a non-redundant database of protein alignment blocks derived from multiple compilations. Bioinformatics, 15, 471–479. [DOI] [PubMed] [Google Scholar]
- 3.Nevill-Manning C.G., Wu,T.D. and Brutlag,D.L. (1998) Highly specific protein sequence motifs for genome analysis. Proc. Natl Acad. Sci. USA, 95, 5865–5871. [DOI] [PMC free article] [PubMed] [Google Scholar]
- 4.Wu T.D., Nevill-Manning,C.G. and Brutlag,D.L. (2000) Fast probabilistic analysis of sequence function using scoring matrices. Bioinformatics, 16, 233–244. [DOI] [PubMed] [Google Scholar]
- 5.Henikoff S. (1996) Scores for sequence searches and alignments. Curr. Opin. Struct. Biol., 6, 353–360. [DOI] [PubMed] [Google Scholar]
- 6.Gribskov M., McLachlan,A.D. and Eisenberg,D. (1987) Profile analysis: detection of distantly related proteins. Proc. Natl Acad. Sci. USA, 84, 4355–4358. [DOI] [PMC free article] [PubMed] [Google Scholar]
- 7.Staden R. (1990) Searching for patterns in protein and nucleic acid sequences. Methods Enzymol., 183, 193–211. [DOI] [PubMed] [Google Scholar]
- 8.Nevill-Manning C.G., Sethi,K.S., Wu,T.D. and Brutlag,D.L. (1997) Enumerating and ranking discrete motifs. Proceedings of the International Conference on Intelligent Systems for Molecular Biology, 5, 202–209. [PubMed] [Google Scholar]
- 9.Falquet L., Pagni,M., Bucher,P., Hulo,N., Sigrist,C.J., Hofmann,K. and Bairoch,A. (2002) The PROSITE database, its status in 2002. Nucleic Acids Res., 30, 235–238. [DOI] [PMC free article] [PubMed] [Google Scholar]
- 10.Bennett S.P. and Brutlag,D.L. (2003) 3motif: visualizing conserved protein sequence motifs in the protein structure database. Bioinformatics, 19, 541–542. [DOI] [PubMed] [Google Scholar]
- 11.Berman H.M., Westbrook,J., Feng,Z., Gilliland,G., Bhat,T.N., Weissig,H., Shindyalov,I.N. and Bourne,P.E. (2000) The Protein Data Bank. Nucleic Acids Res., 28, 235–242. [DOI] [PMC free article] [PubMed] [Google Scholar]
- 12.Parry-Smith D.J. and Attwood,T.K. (1991) SOMAP: a novel interactive approach to multiple protein sequences alignment. Comput. Appl. Biosci., 7, 233–235. [DOI] [PubMed] [Google Scholar]
- 13.Faulkner D.V. and Jurka,J. (1988) Multiple aligned sequence editor (MASE). Trends Biochem. Sci., 13, 321–322. [DOI] [PubMed] [Google Scholar]
- 14.Galtier N., Gouy,M. and Gautier,C. (1996) SEAVIEW and PHYLO_WIN: two graphic tools for sequence alignment and molecular phylogeny. Comput. Appl. Biosci., 12, 543–548. [DOI] [PubMed] [Google Scholar]
- 15.Barton G.J. (1993) ALSCRIPT: a tool to format multiple sequence alignments. Protein Eng., 6, 37–40. [DOI] [PubMed] [Google Scholar]
- 16.Brown N.P., Leroy,C. and Sander,C. (1998) MView: a web-compatible database search or multiple alignment viewer. Bioinformatics, 14, 380–381. [DOI] [PubMed] [Google Scholar]
- 17.Goodstadt L. and Ponting,C.P. (2001) CHROMA: consensus-based colouring of multiple alignments for publication. Bioinformatics, 17, 845–846. [DOI] [PubMed] [Google Scholar]
- 18.Lord P.W., Selley,J.N. and Attwood,T.K. (2002) CINEMA-MX: a modular multiple alignment editor. Bioinformatics, 18, 1402–1403. [DOI] [PubMed] [Google Scholar]
- 19.Mizuguchi K., Deane,C.M., Blundell,T.L., Johnson,M.S. and Overington,J.P. (1998) JOY: protein sequence-structure representation and analysis. Bioinformatics, 14, 617–623. [DOI] [PubMed] [Google Scholar]
- 20.Gille C. and Frommel,C. (2001) STRAP: editor for STRuctural Alignments of Proteins. Bioinformatics, 17, 377–378. [DOI] [PubMed] [Google Scholar]
- 21.Laskowski R.A. (2001) PDBsum: summaries and analyses of PDB structures. Nucleic Acids Res., 29, 221–222. [DOI] [PMC free article] [PubMed] [Google Scholar]
- 22.Stothard P.M. (2001) COMBOSA3D: combining sequence alignments with three-dimensional structures. Bioinformatics, 17, 198–199. [DOI] [PubMed] [Google Scholar]
- 23.Kabsch W. and Sander,C. (1983) Dictionary of protein secondary structure: pattern recognition of hydrogen-bonded and geometrical features. Biopolymers, 22, 2577–2637. [DOI] [PubMed] [Google Scholar]
- 24.Li S., Finley,J., Liu,Z.J., Qiu,S.H., Chen,H., Luan,C.H., Carson,M., Tsao,J., Johnson,D., Lin,G. et al. (2002) Crystal structure of the cytoskeleton-associated protein glycine-rich (CAP-Gly) domain. J. Biol. Chem., 277, 48596–48601. [DOI] [PubMed] [Google Scholar]


