

Abstract
The primary neuroendocrine interface, hypothalamus and pituitary, together with adrenals, constitute the major axis responsible for the maintenance of homeostasis and the response to the perturbations in the environment. The gene expression profiling in the human hypothalamus-pituitary-adrenal axis was catalogued by generating a large amount of expressed sequence tags (ESTs), followed by bioinformatics analysis (http://www.chgc.sh.cn/ database). Totally, 25,973 sequences of good quality were obtained from 31,130 clones (83.4%) from cDNA libraries of the hypothalamus, pituitary, and adrenal glands. After eliminating 5,347 sequences corresponding to repetitive elements and mtDNA, 20,626 ESTs could be assembled into 9,175 clusters (3,979, 3,074, and 4,116 clusters in hypothalamus, pituitary, and adrenal glands, respectively) when overlapping ESTs were integrated. Of these clusters, 2,777 (30.3%) corresponded to known genes, 4,165 (44.8%) to dbESTs, and 2,233 (24.3%) to novel ESTs. The gene expression profiles reflected well the functional characteristics of the three levels in the hypothalamus-pituitary-adrenal axis, because most of the 20 genes with highest expression showed statistical difference in terms of tissue distribution, including a group of tissue-specific functional markers. Meanwhile, some findings were made with regard to the physiology of the axis, and 200 full-length cDNAs of novel genes were cloned and sequenced. All of these data may contribute to the understanding of the neuroendocrine regulation of human life.
The neuroendocrine system plays a primordial role in the regulation of major physiological processes such as development, growth, metabolism, reproduction, and adaptation to environment. The primary neuroendocrine interface, hypothalamus (HT) and pituitary gland (NP), together with adrenal glands (AD), constitute the major axis responsible for the maintenance of homeostasis and the response to perturbations in the environment (1). Hypothalamus-pituitary-adrenal (HPA) response to stress also serves to mobilize the defensive mechanisms of the body including those modulating the intensity of the immune response and some inflammatory components, such as changes in vascular tone and vascular permeability, etc.
The diverse functions and complex regulation of the HPA axis are largely determined by well-regulated gene expression in tissues at different levels of the axis. The use of molecular biology techniques over the last two decades has allowed molecular cloning of a number of genes encoding hormones or secretory proteins. Apart from classical endocrine hormones, new active peptides related to neuroendocrine function, such as CART (cocaine and amphetamine-regulated transcript peptide) (2), PACAP (pituitary adenylate cyclase-activating polypeptide) (3), leptin, orexin (4), neuropeptide Y (5), endothelin (6), and many others, recently were identified. However, there are still a lot of unknown functions as well as regulatory mechanisms to be explored in the HPA axis. The establishment of a detailed catalog of genes expressed in the HPA axis, and the discovery of new genes from HT, NP, and AD, will certainly help the functional characterization of this utmost important system for human life and contribute to functional genomics as a whole.
In the present work, a relatively large-scale generation of expressed sequence tags (ESTs) was conducted in combination with analysis using bioinformatics tools. A catalog of genes expressed in the human HPA axis was established, and full-length cDNA cloning was carried out based on the EST database.
Materials and Methods
RNA Extraction.
Normal human hypothalami, pituitaries, and adrenals were removed within 4 h postmortem from two adult males aged 20 and 35 years who died in traffic accidents. Total RNA was extracted from frozen tissues, and the selection of poly(A) RNA was performed by using oligo(dT) (Qiagen, Chatsworth, CA).
cDNA Library Construction.
cDNA synthesis was performed either with a CapFinder PCR cDNA library construction kit (CLONTECH) or by using conventional procedures (7).
DNA Sequencing.
Bacteria growth and plasmid extractions were performed in a 96-well format (Qiagen). Sequencing reactions were performed on a 9600 Thermal reactor (Perkin–Elmer) by using a Dye Primer Cycle Sequencing Kit (Perkin–Elmer), and partial cDNA sequencing of each clone was taken from the 5′ end. The reaction products were analyzed by using an ABI 377 DNA Sequencer (Perkin–Elmer).
Bioinformatics Analysis and Data Management.
Quality assessment and quality base trimming of ESTs were performed by using pe sequencing analysis (version 3.0) and phred. “Good” sequences referred to those sequences containing less than 3% ambiguous bases that were longer than 100 bp. ESTs were considered as part of known genes if they shared at least 95% homology over at least 100 bp of DNA sequences with a blast search. ESTs corresponding to known genes were divided into eight categories according to the gene functions as proposed in the literature (7, 8). Clustering of the ESTs generated in the work was performed by using cat3.2 from Pangea (Oakland, CA) with default parameters.
Full-Length cDNA Cloning.
The new sequences confirmed by homology comparison with GenBank and other databases were selected for full-length cDNA cloning. A Marathon Ready cDNA kit was used to facilitate full-length cDNA cloning. In silico cloning was carried out by using dbEST information started from the sequences obtained from HT, NP, and AD libraries. Overlapping EST sequences were assembled to establish contigs. Sequence ambiguity existing in these contigs was clarified by further sequencing.
Quantitative Reverse Transcriptase (RT)-PCR.
The quantitative RT-PCR for growth hormone (GH), proopiomelanocortin (POMC), and thyroid-stimulating hormone (TSH) genes was performed. Total RNA with DNase I treatment was used to synthesize first-stand cDNA with RT (GIBCO/BRL) and oligo(dT) 15 Primer (Promega). The products of the RT reactions was used to seed real-time PCR by using an ABI Prism 7700 Sequence Detector by comparing with glyceraldehyde-3-phosphate dehydrogenase (internal control) and individual standard curve with three time repeats. Probes were labeled with quencher and fluorescent dye 6-FAM by 5′ and 3′ ends, respectively.
Mapping of Full-Length cDNA Clones.
We mapped novel genes to chromosomes by two strategies: searching unigene or radiation hybrid (RH). In RH mapping, the genebridge g4 panel (Research Genetics, Huntsville, AL) was used according to previously described protocol (9).
Results
Quality Evaluation of cDNA Libraries and an Overview of ESTs from HT, NP, and AD.
A total of 31,130 clones were selected at random from cDNA libraries of HT, NP, and AD. Partial cDNA sequence of each clone was taken from the 5′ end by using appropriate primers, generating 25,973 ESTs of good quality, with an overall success rate reaching 83.4% (http://www.chgc.sh.cn/database) (Fig. 1A). Of these, 24,044 ESTs were generated from the conventional cDNA libraries whereas only 1,929 ESTs were derived from the CapFinder libraries. When ESTs corresponding to the same known genes were grouped into clusters, the percentages of clusters containing more than five clones in the HT, NP, and AD cDNA libraries were 9.1% (114 clusters), 8.0% (85 clusters), and 10.3% (158 clusters), respectively. Among those 273 clusters with high EST copy number, 67.4% were genes previously reported to be ubiquitously expressed in more than 20 tissues (8). Hence, ESTs generated from the three tissues in the HPA axis seemed to have a good representation of gene expression. Based on these data, we believe that EST copy number for a given gene could be considered as a reflection of the gene expression level.
Figure 1.
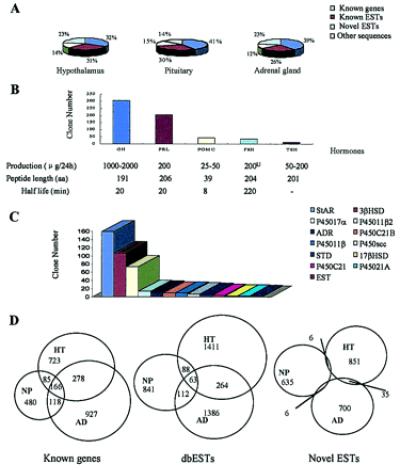
Gene expression profile in whole HT, NP, and AD. (A) Schematic chart of ESTs from HT (8,876 ESTs), NP (7,221 ESTs), and AD (9,875 ESTs) libraries. (B) The order of gene expression levels of five classical NP hormones. Corticotropin was grouped into POMC. Real-time PCR performed for GH, POMC, and TSH generated gene expression levels (32 × 105, 5.9 × 10⁵, and 2.4 × 10⁵ copies/100 ng RNA, respectively, P value all < 0.001) proportional to those estimated by EST copy number. (C) The order of steroids biosynthesis-related enzymes and proteins in AD. StAR, steroidogenic acute regulatory protein; 3βHSD, type II 3β hydroxysteroid dehydrogenase/5-δ-4-δ isomerase; P450 17α, cytochrome P450, subfamily XVII (steroid 17α-hydroxylase); P45011b2, cytochrome P450 XIB2 (aldosterone synthase); ADR, adrenodoxin; P45°C21B, 21-hydroxylase B; P45011β, cytochrome P450 11β; P450scc, cholesterol side-chain cleavage enzyme P450scc; STD, dehydroepiandrosterone sulfotransferase; 17βHSD: 17-β-hydroxysteroid dehydrogenase; P45°C21, steroid 21-hydroxylase [P450(C21)]; P45021A, 21-hydroxylase A; EST, estrogen sulfotransferase. (D) Overlapping of EST clusters corresponding to known genes, known ESTs, and novel ESTs expressed in HT, NP, and AD.
After bioinformatics analysis, 5,347 ESTs homologous to Alu, L1, and other repetitive elements and mtDNA were put aside. The remaining 20,626 ESTs were further analyzed and assembled into clusters for identical or overlapping clones. The numbers of clusters from HT, NP, and AD were 3,979, 3,075, and 4,116, respectively. If the EST clusters from the three tissues were combined and integrated to remove those appearing in more than one tissue, then a total of 9,175 clusters were identified. These clusters then were divided into three groups. The first group included sequences identical to known genes in GenBank, the second group contained clusters matching with the sequences in dbEST, and the third group comprised clusters not present in the public database and thus could be temporarily considered as novel ESTs. To address whether the novel ESTs represented previously unidentified mRNA species, we also sequenced the 3′ ends of 1,156 clones whose 5′ ends were considered novel. As a result, 14.6% (169 clones) were identical to known genes in GenBank, 37.7% (390 clones) matched with the sequences in dbEST, and 49.3% (570 clones) were truly novel ESTs.
To evaluate the proportion of cDNAs containing full-length ORF, we selected at random 353 ESTs corresponding to known genes from HT, NP, and AD cDNA libraries and made an bioinformatics analysis. Among these sequences the proportion of cDNA containing the first ATG in the 5′ terminal sequence reached 36%. Therefore, our libraries were relatively enriched in full-length cDNA.
Gene Expression Profile in the HPA Axis.
In the present work, a catalog of genes expressed in the human HPA axis was established by generating a large amount of ESTs, followed by bioinformatics analysis (available on the web at http://www.chgc.sh.cn/database). A total of 20,626 ESTs were assembled into 9,175 clusters (3,979, 3,074, and 4,116 clusters in HT, NP, and AD, respectively) when overlapping ESTs were integrated. A total of 2,777 clusters (30.3%) corresponded to known genes, 4,165 (44.8%) to dbESTs, whereas 2,233 (24.3%) were novel ESTs (see Fig. 1 for details). A total of 1,252, 1,065, and 1,532 EST clusters from HT, NP, and AD, respectively matched known genes, which were grouped into eight categories (endocrine-related, cell division, signaling/cell communication, cell structure/mobility, cell/organism defense, gene/protein expression, metabolism, and unclassified). The genes expressed in three tissues by the highest proportion were those participating in gene/protein expression (16.4%, 23.5%, and 20.4% from HT, NP, and AD, respectively) and metabolism (16.5%, 14.0%, and 17.0% from HT, NP, and AD, respectively). Proportions of the genes related to endocrinology were close in the three tissues (11.8%, 12.9%, and 10.7% from HT, NP, and AD, respectively). However, compared with some other tissues such as CD34+ hematopoietic precursors (10.6%) (7) and cardiovascular system (12.1%) (10), the percentages of genes involved in signaling/cell communication were higher in the HPA axis (18.7%, 18.2%, and 15.3% from HT, NP, and AD, respectively) (P values all <0.01). The gene expression profiles reflected well the functional characteristics of the three levels in the HPA axis, because most of the 20 genes with highest expression showed statistical difference in terms of tissue distribution, including a group of tissue-specific functional markers (Table 1). Except for those genes listed in Table 1, some neuroendocrine-specific genes such as neuroendocrine-specific protein A, pro-melanin-concentrating hormone, prolactin receptor-associated protein, CART, OB-R gene-related protein, and leptin receptor short form were hit in cDNA libraries from HT. In addition, some cytokines and hormones such as vascular endothelial growth factor, c-sis/platelet-derived growth factor (PDGF) 2, PDGF A, insulin-like growth factor 1, adrenomedullin, angiotensinogen, basic fibroblast growth factor, cholecystokinin, endothelin 3, lens epithelium-derived growth factor, transforming growth factor α, and ALK-3 (members of the transforming growth factor-β cytokine family) were encountered in ESTs data from HT. In ESTs from NP, some hormones and cytokines including luteinizing hormone, TSH, pro-galanin, CART, GH (20 kDa), HE1 (a major secretory protein of the human epididymis), growth factor FIGF, angiopoietin-2, amyloid protein (AD-AP), tumor necrosis factor, epithelins 1 and 2, endothelin 3, kidney epidermal growth factor, preprocortistatin (Cort), and preproenkephalin also were hit. Unexpectedly, steroidogenic enzyme/protein gene transcription such as type II β-hydroxysteroid dehydrogenease/5-δ-4-δ isomerase, 17β-hydroxysteroid dehydrogenase, steroidogenic acute regulatory protein, and prepro form of corticotropin-releasing factor were expressed in both HT and AD. It may be interesting to note that transcription factors with tissues specificity were found, such as specific zinc finger protein 2 (A1–5) in HT, Pit1 and zinc finger protein 74 in NP, and ZNF185 in AD. Further study of these gene functions will be beneficial to the disclosure of the specific function of each tissue. Notably, the expression of GTP-binding protein α (stimulatory) was high in these three tissues, in agreement with the concept that the HPA axis is centrally positioned in neuroendocrine signaling. The most highly expressed classical NP hormone genes, as estimated by the number of ESTs, were GH (4.182% of total ESTs from NP), followed by prolactin (2.853%), POMC (0.595%), follicle-stimulating hormone α (0.499%), and TSH (0.06%). This order was in parallel to the output of the hormones from the NP during a period of 24 h (Fig. 1B). To confirm the order of these hormones in NP, real-time PCR performed for GH, POMC, and TSH normalized by comparison with respective glyceraldehyde-3-phosphate dehydrogenase curve-generated gene expression levels (32 × 105, 5.9 × 10⁵, and 2.4 × 10⁵ copies/100 ng RNA, respectively, P value all < 0.001), which are proportional to those estimated by EST copy number. In the EST profile of AD, we found the expression of steroidogenic acute regulatory protein, a vehicle of cholesterol related to steroidogenesis, and all 12 key enzymes involved in the biosynthesis of steroid hormones (Fig. 1C). Surprisingly, when clusters from HT, NP, and AD were compared with each other, only relatively minor portions of clusters were expressed in all three tissues (6.0%, 1.5%, and none for known genes, dbESTs, and novel ESTs, respectively), whereas the majority of clusters, especially in novel ESTs, were found only in one of the three given tissues. These data suggest a significantly functional divergence at distinct levels of the HPA axis and an enrichment of tissue-specific genes in novel ESTs (Fig. 1D). All of these data may contribute to the understanding of the neuroendocrine regulation of human life.
Table 1.
Copies of the first 20 known genes mostly highly expressed in HT, NP, and AD
| HT
|
NP
|
AD
|
|||
|---|---|---|---|---|---|
| Gene name | Copies (%) | Gene name | Copies (%) | Gene name | Copies (%) |
| Proteolipid protein | 70 (0.789)*† | Growth hormone | 302 (4.182)*‡ | Steroidogenic acute regulatory protein | 159 (1.610)†‡ |
| Myelin basic protein | 66 (0.744)*† | Prolactin | 206 (2.853)*‡ | Type II 3β hydroxysteroid dehydrogenase | 107 (1.084)†‡ |
| Glial fibrillary acidic protein | 22 (0.248)*† | POMC | 43 (0.595)*‡ | Steroid 17α-hydroxylase | 73 (0.739)†‡ |
| Neuronal membrane glycoprotein M6b | 19 (0.214)*† | FSH α subunit (or chorionic gonadotropin) | 36 (0.499)*‡ | Aldose reductase | 46 (0.466)†‡ |
| PGP 9.5 (neuroendocrine marker protein) | 14 (0.158)* | Glyoxalase II | 19 (0.263)*‡ | Mitochondrial matrix protein P1 | 35 (0.354)†‡ |
| Amyloid precursor protein | 10 (0.113)*† | Tumor susceptibility protein (TSG101) | 16 (0.222)*‡ | Prostatic binding protein | 29 (0.294)†‡ |
| Carboxypeptidase E | 10 (0.113) | Carboxypeptidase E | 14 (0.194) | KIAA0018 | 26 (0.263)†‡ |
| Selenoprotein P | 10 (0.113)* | Thyroid hormone receptor coactivating protein | 14 (0.194)*‡ | SH3 binding protein | 17 (0.172)†‡ |
| Glutamate transporter | 9 (0.101)*† | Brain-expressed HHCPA78 homolog | 14 (0.194)*‡ | Apo1_Human | 14 (0.142)‡ |
| Homologue of mSNAP25 | 9 (0.101)*† | Electron transfer flavoprotein-ubiquinone oxidoreductase | 11 (0.152)*‡ | IEF 7442 | 14 (0.142)†‡ |
| Osteopontin | 9 (0.101)*† | Lysosomal pepstatin insensitive protease (CLN2) | 10 (0.138)*‡ | 13-kDa differentiation-associated protein | 13 (0.132)†‡ |
| Semaphorin F homolog | 9 (0.101)*† | Hs-cul-3 | 8 (0.111)*‡ | Apolipoprotein E | 13 (0.132)‡ |
| Tyrosine 3-monooxygenase, zeta polypeptide | 9 (0.101)* | Pro-galanin | 8 (0.111)*‡ | Cytochrome P450 XIB2 (aldosterone synthase) | 13 (0.132)†‡ |
| Carbonic anhydrase II | 8 (0.090)*† | Reticulocalbin | 8 (0.111)*‡ | Adrenodoxin | 11 (0.111)†‡ |
| Clusterin | 8 (0.090)* | RNA-binding protein regulatory subunit | 8 (0.111)* | Glutathione peroxidase | 11 (0.111)†‡ |
| Neuroendocrine-specific protein A (NSP) | 8 (0.090)*† | Secretogranin I (chromogranin B) | 8 (0.111) | KIAA0026 | 11 (0.111)‡ |
| Prostatic binding protein | 8 (0.090)*† | hCART | 7 (0.097)*‡ | KIAA0108 | 10 (0.101) |
| RACHI (RACHI)(urea transporter) | 8 (0.090)*† | HIV-1 TAR RNA binding protein (TARBP-b) | 7 (0.097)*‡ | Tazarotene-induced gene 2 (TIG2) | 10 (0.101)†‡ |
| Splicing factor SRp40-2 (SRp40) | 8 (0.090)† | Insulin-induced protein I (INSIGI) | 7 (0.097)*‡ | Chromogranin B (secretogranin I) | 9 (0.091)‡ |
| Acid ceramidase | 7 (0.079) | Ionizing radiation resistance conferring protein | 7 (0.097)*‡ | CLA-I | 9 (0.091)‡ |
Genes listed do not include those widely expressed (8). % indicates the percentage of a given EST in all ESTs obtained from a tissue. The statistical analysis was performed as described (11) (http://igs-server.cnrs-mrs.fr). *, Significant differences of gene expression (P < 0.05) in HT vs. NP.
, Significant differences of gene expression (P < 0.05) in HT vs. AD.
, Significant differences of gene expression (P < 0.05) in NP vs. AD.
Full-Length cDNA Cloning from the HPA Axis.
Table 2 shows all 200 new full-length cDNAs, with 97 cloned from AD, 49 from NP, and the remaining 54 from HT. Among these novel genes, the majority, 153 (76.5%) and 139 (69.5%), contain 500–2,000 bp in cDNA length and encode 100–400 amino acid residues deduced from their encoding frames. Some genes might be new members of certain gene families, such as zinc finger family, leucine zipper family, Ras-related protein family, and vesicle-associated membrane protein family, according to their homology with known genes and domains. In addition, some genes are very conserved in the progress of evolution because the proteins derived from these genes exhibit similar primary structure with organisms such as Escherichia coli, Saccharomyces cerevisiae, Caenorhabditis elegans, Drosophila melanogaster, and Mus musculus, and even some plants or viruses (Table 2). These novel genes might be involved in critical biological process according to their homology to known genes with established functions, such as secretory proteins, signal transduction molecules, enzyme and genes involved in secretion of vesicle, development, differentiation, and transcriptional gene expression. 
The chromosomal locations of 154 nove1 genes were determined, of which 127 were located by using UniGene database information and 27 by RH mapping. The remaining 46 new genes could not be chromosome mapped by either of the above methods.
The Discovery of Novel Splicing Patterns of Known Genes.
The EST data acquired from the HPA axis also provide useful information on alternative splicing of known genes, as shown in Table 3 for 11 genes. Of note, among 302 ESTs for the GH gene in NP, a splicing form lacking 138 bp was discovered, which might result in a new isoform of the hormone missing 46 aa (amino acids 92–137). Comparison of the mRNA sequence with the corresponding genomic region suggests a possible splicing within both exons 4 and 5 of the gene, deleting 11 aa from exon 4 and 35 aa from exon 5. This splicing, however, seems not to fit the classical gt-ag rule but uses atypical splicing donor tt-ag. To confirm the existence of this splicing pattern in NP, primers capable of distinguishing classical GH gene from its new isoform were synthesized, and two bands of expected sizes were amplified in NP by RT-PCR. Both bands then were subcloned into plasmid pGEM-T and sequenced, and their sequences were shown to correspond exactly to our original finding (not shown). New splicing forms of FKBP and WSB genes also were confirmed by the above methods.
Table 3.
Variant splicing pattern of some genes
| Gene name | Splicing pattern | cDNA, bp | Amino acid | Characteristics of splicing |
|---|---|---|---|---|
| Human stromal cell protein | Classical | 1316 | 221 | Atypical, aa-gc |
| Isoform | 1183 | 179 | ||
| Human steroid 5-α-reductase | Classical | 2222 | 260 | Atypical, gt-cg spanning exons 1 and 2 |
| Isoform | 1178 | 211 | ||
| Human FK506-binding protein | Classical | 1231 | 222 | Atypical, gt-cg |
| (FKBP23) | Isoform | 1067 | 259 | |
| Human ancient ubiquitous protein | Classical | 1466 | 410 | Typical gt-ag |
| Isoform | 1664 | 476 | ||
| Human 17.9-kDa protein | Classical | None | 113 | Typical, gt-ag, increase 1 new exon |
| Isoform | 1121 | 160 | ||
| Human growth hormone | Classical | 821 | 217 | Atypical, tt-ag, spanning 2 exons |
| Isoform | 642 | 171 | ||
| Human flotillin | Classical | 1698 | 427 | Atypical, gg-ga |
| Isoform | 1493 | 253 | ||
| Human WSB-1 | Classical | 1925 | 421 | ??-ag |
| Isoform | 1657 | 219 | ||
| Human SURF-4 protein | Classical | 1557 | 269 | Atypical, at-ac |
| Isoform | 1218 | 159 | ||
| Human small GTP-binding protein | Classical | 2496 | 221 | Atypical, ga-ag |
| (Rab27) Isoform | Isoform | 1156 | 213 | |
| hTRIP15-iso | Classical | 1963 | 443 | Typical, gt-ag |
| Isoform | 1984 | 450 |
Discussion
With the growing interest in research into human genome and the advent of high-throughput DNA sequencing technologies, Adams et al. (12) carried out the measurement of cDNAs on a large scale, and then thousands of human ESTs were produced from different organs, tissues, or cell types. However, not all tissue/cell types are equally represented for gene expression profiles in dbEST. Concerning the endocrine system, very few ESTs could be found from the HT and NP whereas there were only about 900 ESTs from the normal adrenal tissues until the end of 1999. The present study thus aimed at characterization of the gene expression profile of the HPA axis by using EST analysis and molecular cloning of full-length cDNA of novel genes identified, to lay a basis for a more profound understanding of the regulation of the neuroendocrine system under physiological conditions as well as for the further analysis of possible disease association. Totally, we have produced 25,973 ESTs from the HPA axis and have basically set up the expression spectrum for known genes in each tissue. Known genes, known ESTs, and novel ESTs make up 79.5% of all ESTs, whereas repetitive elements and mtDNA sequences accounted for 21.5%. This distribution is quite close to those previously reported in other tissues (10). The fact that a relatively low proportion (13.3%) of novel ESTs is from the HPA axis suggests that the majority of human genes may have already been labeled in dbEST (13).
Because there was a satisfactory representation of ESTs generated from HT, NP, and AD, the gene expression of the HPA axis could be analyzed in terms of both patterns and levels. The overall expression profile from the three tissues corresponds very well to the known functions, with neuroendocrine markers/hypothalamic hormones/receptors, classical NP hormones, and enzymes involved in the biosynthesis of steroid hormones as the most highly expressed genes in HT, NP, and AD, respectively. In addition, the three tissues showed relatively distinct gene expression profiles, as there was a relatively low proportion (23.3%) of genes with expression occurring in two or three tissues. In the meantime, however, among genes with overlapped expression, especially those expressed at the three levels of the HPA axis, some important endocrine-related genes were found, which may extend our knowledge about endocrine functions and/or regulations. For example, CART, previously considered as a key hypothalamic hormone controlling appetite and energy metabolism, showed expression in the tissues of HT, NP, and AD. The highest expression of CART (seven EST copies), however, was found in NP instead of HT, suggesting that CART could also be a NP hormone. Another interesting finding was the expression of both corticotropin-releasing hormone (CRH) and urocortin in AD. It was reported that the receptor for CRH as well as the downstream POMC genes could be expressed by AD whereas urocortin recently was found to be able to stimulate secretion of corticotropin through CRH receptor (14), with an even stronger effect than CRH (15). It is thus possible that there be local paracrine/autocrine pathways, with a corresponding regulatory network of feedback for CRH and urocortin in AD. Another example is the hypothalamic expression of adrenomedullin, a secreted protein isolated from human pheochromocytoma (16), but also expressed in the zona glomerulosa of the cortex of AD, which increases the secretion of aldosterone through paracrine mechanism (17).
Recently, full-length cDNA cloning and sequencing have become major tasks in the Human Genome Project's next 5-year plan (18, 19). Mass production of ESTs combined with bioinformatics analysis is a milestone in the discovery of novel transcription units. Based on the known or novel ESTs identified in the HPA axis, and taking advantage of the full-length cDNA-enriched libraries constructed in our work, the UniGene information in public databases, and the available 5′ rapid amplification of cDNA ends PCR technology, we cloned 200 full-length cDNA of novel genes. The tools of bioinformatics not only help to clone novel genes through dbEST assembly, but also provide important clues to the functions of novel genes through comparison of homology to known genes with established function and those genes from model organisms. For example, among 200 novel genes, we have found at least three that may participate in the signal transduction process of the receptors with tyrosine kinase activity. Human UNR gene was cloned from NP and its homology with the known gene in rat is as high as 93%, the latter being located in tandem to N-ras gene with a distance of only 150 bp (20). Recently, the UNR gene product was found to inhibit the expression of N-ras (21), which is an important molecule in the signaling of receptor tyrosine kinase. Another novel gene, human insulin receptor tyrosine kinase substrate cloned from AD, shows 40.9% homology with the insulin receptor tyrosine kinase 53-kDa substrate gene from Crietinase gen. SP. The known 53-kDa substrate contains phosphorylation site of receptor tyrosine kinase and participates in the process of signal transduction of insulin receptor (22). The third novel gene cloned from the NP, designated as human insulin-induced growth response protein 2, shows 83% homology to human insulin-induced growth response protein 1 at the protein level, whereas the latter plays a role in growth and differentiation of tissues involved in metabolic control (23).
Moreover, the estimated total number of human genes may need modification, considering the discrepancy between EST data and genomic DNA data generated from chromosomes 21 and 22 (24–26). There might be overestimation of the number of genes according to EST clusters because many genes may yield different splicing transcripts. Actually, in our study, some known genes and new genes indeed present alternative splicing patterns.
Acknowledgments
This work was supported in part by the National Key Basic Research (973) program of China, Chinese High Tech Program (863), National Natural Science Foundation of China, Shanghai Commission for Science and Technology, and SmithKline Beecham pharmaceuticals.
Abbreviations
- HPA
hypothalamus-pituitary-adrenal
- EST
expressed sequence tag
- HT
hypothalamus
- NP
pituitary gland
- AD
adrenal gland
- CART
cocaine and amphetamine-regulated transcript peptide
- RT
reverse transcriptase
- GH
growth hormone
- POMC
proopiomelanocortin
- TSH
thyroid-stimulating hormone
- RH
radiation hybrid
- CRH
corticotropin-releasing hormone
Footnotes
Data deposition: The sequences reported in this paper have been deposited in the GenBank database (accession nos. AF070666, AF077046, AF077049, AF077052, AF077054, AF078845, AF078846, AF078849, AF078851, AF078853–AF078855, AF078865–AF078867, AF092128, AF092131, AF092137, AF092139, AF093680, AF100740–AF100744, AF100751–AF100757, AF100759, AF100760, AF100762, AF106681–AF106685, AF110644, AF110645, AF110647, AF110774–AF110778, AF112200–AF112204, AF112206–AF112222, AF113122–AF113129, AF113534–AF113540, AF117229–AF117237, AF119662–AF119666, AF125392–AF125394, AF125530–AF125535, AF126020, AF126021, AF126023, AF126024, AF136970–AF136972, AF136974–AF136978, AF150732–AF150735, AF155569, AF155648–AF166658, AF155660–AF155662, AF157316–AF157327, AF160212–AF160215, AF164790–AF164799, AF183409, AF183413, AF183414, AF183416, AF183420, AF183422–AF183428, AF184213, AF211481, AF212253, AF220182–AF220193, AF221595, AF223466–AF223470, and AF226732).
Article published online before print: Proc. Natl. Acad. Sci. USA, 10.1073/pnas.160270997.
Article and publication date are at www.pnas.org/cgi/doi/10.1073/pnas.160270997
References
- 1.Reichlin S. N Engl J Med. 1993;329:1246–1253. doi: 10.1056/NEJM199310213291708. [DOI] [PubMed] [Google Scholar]
- 2.Kristensen P, Judge M E, Thim L, Ribel U, Christjansen K N, Wulff B S, Clausen J T, Jensen P B, Madsen O D, Vrang N, et al. Nature (London) 1998;393:72–76. doi: 10.1038/29993. [DOI] [PubMed] [Google Scholar]
- 3.Arimura A. Jpn J Physiol. 1998;48:301–331. doi: 10.2170/jjphysiol.48.301. [DOI] [PubMed] [Google Scholar]
- 4.Sakurai T, Amemiya A, Ishii M, Matsuzaki I, Chemelli R M, Tanaka H, Williams S C, Richardson J A, Kozlowski G P, Wilson S, et al. Cell. 1998;92:573–585. doi: 10.1016/s0092-8674(00)80949-6. [DOI] [PubMed] [Google Scholar]
- 5.Small C J, Todd J F, Ghatei M, Smith D M, Bloom S R. Regul Pept. 1998;75–76:301–307. doi: 10.1016/s0167-0115(98)00082-2. [DOI] [PubMed] [Google Scholar]
- 6.Kanyicska B, Lerant A, Freeman M E. Endocrinology. 1998;139:5164–5173. doi: 10.1210/endo.139.12.6380. [DOI] [PubMed] [Google Scholar]
- 7.Mao M, Fu G, Wu J S, Zhang Q H, Zhou J, Kan L X, Huang Q H, He K L, Gu B W, Han Z G, et al. Proc Natl Acad Sci USA. 1998;95:8175–8180. doi: 10.1073/pnas.95.14.8175. [DOI] [PMC free article] [PubMed] [Google Scholar]
- 8.Adams M D, Kerlavage A R, Fleischmann R D, Fuldner R A, Bult C J, Lee N H, Kirkness E F, Weinstock K G, Gocayne J D, White O, et al. Nature (London) 1995;377:3–174. [PubMed] [Google Scholar]
- 9.Cox D R, Burmeister M, Price E R, Kim S, Myers R M. Science. 1990;250:245–250. doi: 10.1126/science.2218528. [DOI] [PubMed] [Google Scholar]
- 10.Liew C C, Hwang D M, Fung Y W, Laurenssen C, Cukerman E, Tsui S, Lee C Y. Proc Natl Acad Sci USA. 1994;91:10645–10649. doi: 10.1073/pnas.91.22.10645. [DOI] [PMC free article] [PubMed] [Google Scholar]
- 11.Audic S, Claverie J M. Genome Res. 1997;7:986–995. doi: 10.1101/gr.7.10.986. [DOI] [PubMed] [Google Scholar]
- 12.Adams M D, Kelley J M, Gocayne J D, Dubnick M, Polymeropoulos M H, Xiao H, Merril C R, Wu A, Olde B, Moreno R F, et al. Science. 1991;252:1651–1656. doi: 10.1126/science.2047873. [DOI] [PubMed] [Google Scholar]
- 13.Schuler G D, Boguski M S, Hudson T J, Hui L, Ma J, Castle A B, Wu X, Silva J, Nusbaum H C, Birren B B, et al. Science. 1996;274:540–546. [PubMed] [Google Scholar]
- 14.Vaughan J, Donaldson C, Bittencourt J, Perrin M H, Lewis K, Sutton S, Chan R, Turnbull A V, Lovejoy D, Rivier C, et al. Nature (London) 1995;378:287–292. doi: 10.1038/378287a0. [DOI] [PubMed] [Google Scholar]
- 15.Turnbull A V, Vaughan J, Rivier J E, Vale W W, Rivier C. Endocrinology. 1999;140:71–78. doi: 10.1210/endo.140.1.6419. [DOI] [PubMed] [Google Scholar]
- 16.Kitamura K, Kangawa K, Kawamoto M, Ichiki Y, Nakamura S, Matsuo H, Eto T. Biochem Biophys Res Commun. 1993;192:553–560. doi: 10.1006/bbrc.1993.1451. [DOI] [PubMed] [Google Scholar]
- 17.Kapas S, Martinez A, Cuttitta F, Hinson J P. J Endocrinol. 1998;156:477–484. doi: 10.1677/joe.0.1560477. [DOI] [PubMed] [Google Scholar]
- 18.Collins F S, Patrinos A, Jordan E, Chakravarti A, Gesteland R, Walters L. Science. 1998;282:682–689. doi: 10.1126/science.282.5389.682. [DOI] [PubMed] [Google Scholar]
- 19.Strausberg R L, Feingold E A, Klausner R D, Collins F S. Science. 1999;286:455–457. doi: 10.1126/science.286.5439.455. [DOI] [PubMed] [Google Scholar]
- 20.Boussadia O, Jacquemin-Sablon H, Dautry F. Biochim Biophys Acta. 1993;1172:64–72. doi: 10.1016/0167-4781(93)90270-n. [DOI] [PubMed] [Google Scholar]
- 21.Boussadia O, Amiot F, Cases S, Triqueneaux G, Jacquemin-Sablon H, Dautry F. FEBS Lett. 1997;420:20–24. doi: 10.1016/s0014-5793(97)01479-8. [DOI] [PubMed] [Google Scholar]
- 22.Yeh T C, Ogawa W, Danielsen A G, Roth R A. J Biol Chem. 1996;271:2921–2928. doi: 10.1074/jbc.271.6.2921. [DOI] [PubMed] [Google Scholar]
- 23.Peng Y, Schwarz E J, Lazar M A, Genin A, Spinner N B, Taub R. Genomics. 1997;43:278–284. doi: 10.1006/geno.1997.4821. [DOI] [PubMed] [Google Scholar]
- 24.Ewing B, Green P. Nat Genet. 2000;25:232–234. doi: 10.1038/76115. [DOI] [PubMed] [Google Scholar]
- 25.Liang F, Holt I, Pertea G, Karamycheva S, Salzberg S L, Quackenbush J. Nat Genet. 2000;25:239–240. doi: 10.1038/76126. [DOI] [PubMed] [Google Scholar]
- 26.Dunham I, Hunt A R, Collins J E, Bruskiewich R, Beare D M, Clamp M, Smink L J, Ainscough R, Almeida J P, Babbage A, et al. Nature (London) 2000;402:489–495. doi: 10.1038/990031. [DOI] [PubMed] [Google Scholar]