Abstract
RNA secondary structures are important in many biological processes and efficient structure prediction can give vital directions for experimental investigations. Many available programs for RNA secondary structure prediction only use a single sequence at a time. This may be sufficient in some applications, but often it is possible to obtain related RNA sequences with conserved secondary structure. These should be included in structural analyses to give improved results. This work presents a practical way of predicting RNA secondary structure that is especially useful when related sequences can be obtained. The method improves a previous algorithm based on an explicit evolutionary model and a probabilistic model of structures. Predictions can be done on a web server at http://www.daimi.au.dk/~compbio/pfold.
INTRODUCTION
RNA structures are essential in many biological processes and are often conserved in evolution. Examples of such conserved structures are found in tRNA (1), rRNA (2,3), tmRNA (4), RNase P RNA (5) and SRP RNA (6). Many computational methods have been developed for predicting RNA structures. Early algorithms were made by Nussinov et al. (7) and Zuker and Stiegler (8). Zuker's energy calculations have been further improved (9–11) and are probably the most widely used RNA secondary structure prediction method today (with the MFOLD program).
The work of Knudsen and Hein (12) (here denoted as the KH-99 algorithm) combines an explicit evolutionary model of RNA sequences with a probabilistic model for secondary structures. It assumes an alignment and gives one common structural prediction for all the sequences.
This work improves the KH-99 algorithm primarily by making it faster and more robust toward alignment errors. A thorough evaluation of performance under different circumstances is also included. This new method called Pfold is available through a web-based server www.daimi.au.dk/~compbio/pfold.
METHODS
Pfold is based on the KH-99 algorithm, which was only useful for a limited number of sequences due to its large computation time. This work makes the algorithm practically useful for larger numbers of sequences. The main concerns are treatment of gaps, computational speed and robustness.
The KH-99 algorithm
The KH-99 algorithm uses a stochastic context-free grammar (SCFG) to produce a prior probability distribution of RNA structures. Given an alignment and a phylogenetic tree relating the sequences, posterior probabilities of the structures can be calculated using the inside–outside algorithm (13). The posterior probability is based on individual probabilities for alignment columns or pairs of columns in the case of a base-pair.
Column probabilities are calculated using the likelihood approach by Felsenstein (14). The evolution of column pairs is modelled using a rate matrix for base-pairs (i.e. a 16 by 16 matrix). The most likely structure is found using the CYK algorithm (15). The tree is estimated using a maximum likelihood approach in the SCFG model described.
Both the evolutionary and structural parameters of the KH-99 model are based on extensive tRNA and large subunit rRNA databases (12).
Gaps
Treating gaps in an appropriate way is a returning problem in biological sequence analysis. The best way to deal with gaps would probably be to make an explicit evolutionary model for insertions and deletions, and use that in the sequence analysis. Unfortunately, such calculations are often complicated, as in statistical alignment (16,17). Two simpler ideas are to treat gaps as a fifth nucleotide or to treat them as unknown nucleotides.
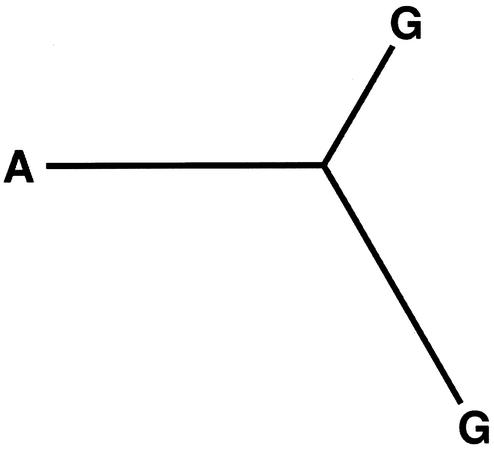
When using an evolutionary model, a number of problems arise from treating a gap as a fifth nucleotide. First, the frequency of gaps will depend on how many sequences are being analysed and on their evolutionary distance. Furthermore, gaps cannot be viewed as evolving in the same way as a nucleotide, thus the rates of evolution are difficult to specify. This approach does, however, have the advantage that it includes the potentially useful information from the insertions and deletions. This method was successfully used in the RNA part of the non-coding RNA gene finding algorithm by Rivas and Eddy (18). When treating gaps as unknown nucleotides, a gapped sequence position should have probability one for any nucleotide. This has the advantage that the probability of a column with gaps is equal to the probability of the same column in an alignment without the gapped sequences, and the tree correspondingly pruned (Fig. 1).
Figure 1.
The effect of treating gaps as unknown nucleotides. Only a single column from the alignment is considered with the nucleotides put at the leaves of the phylogenetic tree. The two trees have identical probabilities since leaves with gaps can be removed.
Pfold uses the latter approach, which is often done in situations where different alignment columns are looked at individually (19). In RNA structure prediction, pairs of columns are analysed together, which can give rise to some difficulties: when treating gaps as unknowns, gaps can form pairs with nucleotides (the top of Fig. 2). This problem was handled by removing columns where less than 75% of the sequences have nucleotides (the bottom of Fig. 2).
Figure 2.
A structure prediction for three hypothetical sequences. In the top alignment, gaps are treated as unknown nucleotides. The structure, shown as parentheses, include pairs between nucleotides and gaps. In the parenthesis notation, corresponding parentheses indicate positions forming base-pairs. In the bottom alignment, the columns with gaps have been left out of the prediction, because <75% of the sequences have nucleotides in these positions.
Unknown nucleotides
In biological sequences, some nucleotides may be unknown or only partial information may be available. These situations can be treated by letting the unknown nucleotide have a probability of one for each of the possible nucleotides. This means that if a given position is known to be a pyrimidine, its probability of being a U is set to one, and its probability of being a C is also set to one. Using this method, any symbols of the extended nucleotide alphabet can be treated correctly by Pfold. This is in accordance with Felsenstein (14).
Tree estimation
In the KH-99 algorithm, the tree was estimated through a maximum likelihood method using the SCFG model. While this gave good results and was interesting with respect to phylogenetic analysis, it was slow. A much faster method is to estimate the tree first. This can be done using standard methods.
In Pfold, pairwise distances between sequences are calculated using maximum likelihood. The rate matrix used should correspond as closely as possible to what is used in the KH-99 algorithm. Since the tree is calculated before the structure has been estimated, a single rate matrix has to be used for this purpose. It was made from the KH-99 algorithm by summing the loop rate matrix and a reduction of the base-pair rate matrix to single positions. The rate matrices were weighted with the probabilities that a given position is in a loop region or a stem region, respectively. The tree is calculated from pairwise distances using the neighbour joining algorithm (20) and adjusting branch lengths to maximum likelihood estimates. This gives a large increase in speed, since the inside–outside calculations only need to be performed once, as opposed to the multiple iterations used in the KH-99 method for estimating the tree.
Robustness
Pfold assumes that all sequences have exactly the same structure. This means that a single sequence with a slightly different structure might ruin a prediction. The same situation applies for alignment errors and sequencing errors. When a single error might change a prediction significantly, the method is not robust (the top of Fig. 3).
Figure 3.
In the top alignment, the KH-99 result is given. The bottom alignment shows the structure when all nucleotides have a 1% chance of being any other nucleotide. The result is a longer stem, which includes one non-standard pair.
A way to make the algorithm more robust is to let any nucleotide have a small probability of being any other nucleotide. The interpretation of this is most obvious in terms of sequencing errors, but the method works for alignment errors and structure differences, too. Figure 3 shows how introduction of this probability changes the results. In Pfold this probability was set to 1%.
Partially known structure
Often, something is known about the structure being predicted and including this knowledge in the analysis can give improved results. Different kinds of knowledge can be used:
That two given columns form a pair together.
That a given column is involved in a pair.
That a given column is unpaired.
This can all be included in the calculations by letting the structures that do not satisfy the previous knowledge have a probability of zero. This approach does not change relative prior distributions of allowed structures.
As a side note, no loops of length two are allowed in this implementation, as opposed to the KH-99 algorithm. This was implemented by disallowing pairs between positions of distance less than four.
What structure should be chosen?
A prediction program should of course report a single prediction as the best. The CYK algorithm for finding the most likely parsing from the grammar is often used (15). An alternative to this has been chosen here: Pfold reports the nested structure with the highest expected number of correct predictions. Appendix 1 (available as Supplementary Material) describes how this structure can be found. Notice that this removes some of the problems associated with using the CYK algorithm on ambiguous grammars.
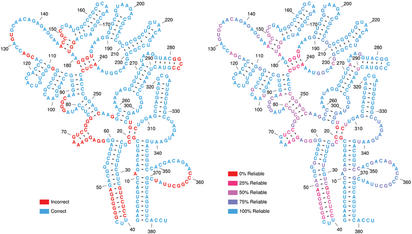
Once the best nested structure has been chosen, the reliability of the prediction is evaluated for each position. This is done by finding the probability that each prediction (specific pair or unpaired) was correct, given the model and the data. The variables from the inside–outside algorithm can easily be used to give this information (Appendix 1 available as Supplementary Material). Knowing which parts of the prediction are reliable is very important when using the prediction in further work (Fig. 4).
Figure 4.
Prediction of the Klebsiella pneumoniae RNase P RNA structure (5) with the KH-99 method based on the four sequence alignment in the work of Knudsen and Hein (12). The left side shows which areas are correctly predicted and the right side shows the reliability of the prediction. Notice the high correlation between the two. Positions 359–366 form a pseudoknot with positions 68–70 and 72–76. Furthermore, positions 84–87 form a pseudoknot with positions 282–285. Since the algorithm described here does not take pseudoknots into account, this explains why these areas are incorrectly predicted while some of them seem reliable.
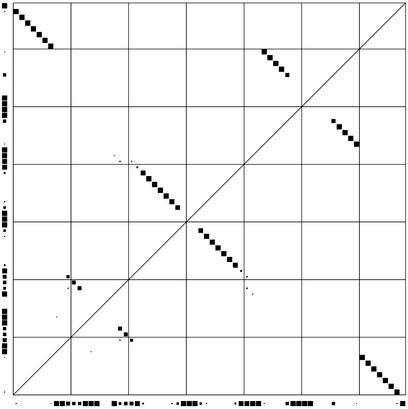
Finding a single best structure may not always give all the information that would be useful. To give an overview of the prediction, a dot plot is produced as well. It is a square plot of pairing probabilities for all different pairs. Each probability is represented by the size of a dot in the appropriate position. Probabilities of not pairing are shown on the sides of the plot (Fig. 5). These calculations resemble the work by McCaskill (21).
Figure 5.
A dot plot made from GCA-tRNA sequences from rat, chicken, mouse and cow (1). The lower left corner represents the beginning of the alignment. Imagining the alignment laid out upwards from here and toward the right, the dots inside the square represent pairing probabilities between positions. The dots outside the square represent probabilities of not pairing. The tRNA structure is clearly visible.
Making the obvious individual structure changes
Sometimes, a structure in a single sequence will have a slightly longer stem than its homologues. This can be incorporated in the prediction by extending a stem if immediate neighbours can form base pairs. Another obvious change is to remove non-standard base pairs from individual sequences. This is done after the structure predictions given by Pfold.
INPUT AND OUTPUT
The input to the web server is an alignment of up to 40 sequences and 500 positions. The alignment should be given in the FASTA format with gaps represented by hyphens (‘-’). Previously known structural elements can be incorporated in the prediction by adding a specific sequence with the relevant information (see web site for details). When a prediction is done, the web server returns an email to the user. This email contains a link to a web page with the results. On the web page, the following is available in multiple formats:
A summary of the input.
The calculated tree.
The predicted structure given as a bracket notation.
Reliabilities of individual predictions.
A dot plot.
RESULTS
For all predictions in this section, two versions were made. The first version was made using the alignment from the database of the sequences being analysed. This alignment was assumed to be ‘correct’. In the second version, sequences from databases were aligned using the ClustalW alignment program by Thompson et al. (22) to imitate a realistic scenario of RNA structure prediction.
Test sets
A number of test sets were made (Table 1). The sets A, B and C are used in evaluating the prediction accuracy as a function of the number of sequences used in the analysis. Test set D is used to show how prediction accuracy varies as a function of evolutionary distance.
Table 1. Test sets from Zwieb et al. (4) and Rosenblad et al. (6).
| Test set | Sequences |
|---|---|
| A: 9 tmRNAs (363.8) | act.act., hae.inf., kle.pne., pas.mul., sal.par., sal.typ., she.put., vib.cho., yer.pes. |
| B: 13 bacterial SRP RNAs (270.5) | bac.alc., bac.bre., bac.cer., bac.cir., bac.mac., bac.meg., bac.pol., bac.pum., bac.sph., bac.ste., bac.thu., bre.bre., clo.per. |
| C: 10 eukaryotic SRP RNAs (300.9) | ory.sat., tri.ae-a, tri.ae-b, zea.ma-a, zea.ma-b, zea.ma-c, zea.ma-d, zea.ma-e, zea.ma-f, zea.ma-h |
| D: 51 eukaryotic SRP RNAs (297.4) | ara.th-a, ara.th-b, cae.el-a, cae.el-b, cae.el-c, cae.el-d, can.spe., cin.hyb., dro.mel., fug.rub., hom.sa-a, hom.sa-b, hom.sa-c, hum.ja-a, hum.ja-b, hum.lu-a, hum.lu-b, hum.lu-c, hum.lu-d, lep.col., lyc.es-a, lyc.es-b, lyc.es-c, lyc.es-e, lyc.es-f, lyc.es-g, lyc.es-h, lyc.es-i, lyc.es-j, lyc.es-k, lyc.es-m, lyc.es-n, lyc.es-o, ory.sat., rat.rat., sch.pom., tet.ros., tet.the., tri.ae-a, tri.ae-b, try.br-a, try.br-b, xen.lae., yar.li-a, yar.li-b, zea.ma-a, zea.ma-b, zea.ma-c, zea.ma-d, zea.ma-e, zea.ma-f |
Sets A, B and C were chosen so that no pairwise distance within each set is more than 0.5 units in the Jukes-Cantor model (23). Set D has unique sequences, all of length greater than 250 from the eukaryotic SRP RNA database. No two sequences are identical within any of the sets. The average sequence length of each test set is written in parentheses.
Prediction accuracy
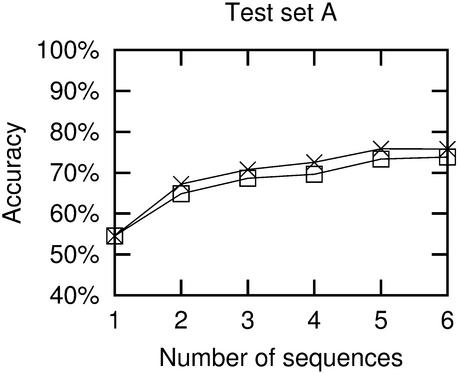
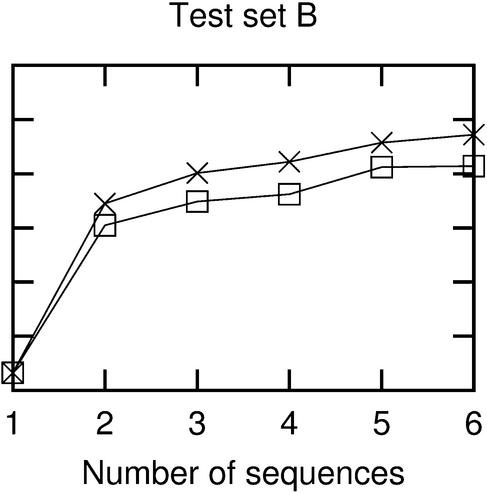
An evaluation of the prediction accuracy is shown in Figure 6. The accuracy was calculated as the percentage of positions for which the secondary structure was correctly predicted. For a pairing position to be counted as correct, the position of the predicted pair had to be correct. Sequences in the test sets used here have a maximum pairwise distance of 0.50 units in the Jukes--Cantor model (23). This means that the sequences are quite diverse, but still possible to align without too many errors.
Figure 6.
Accuracy as a function of the number of sequences used in the prediction. Crosses are from results using ‘correct’ alignments, while boxes are from ClustalW alignments. Each point represents average results for either all possible combinations of the relevant number of sequences or 50 random combinations, whichever is the lowest number.
As expected, prediction accuracy rises with the number of sequences used, as more covariance information becomes available. This shows that when related sequences are available, they should generally be used in the structure prediction (exceptions to this are discussed below). An accuracy of ∼75% is obtainable with six sequences and Pfold can cope with many more sequences, so even higher accuracies are possible.
Pfold was also used on the original test set of Knudsen and Hein (12). There were a few small differences in the results compared to the KH-99 algorithm and the overall performance was slightly better in this new version of the algorithm.
Evolutionary distance effect
There are two effects of evolutionary distance on prediction accuracy: large distances imply much covariation information, but it also means that sequences are difficult to align. Another issue with large evolutionary distances is that secondary structures may not be conserved between the sequences. Since Pfold assumes a single common structure for all sequences, this can pose a problem.
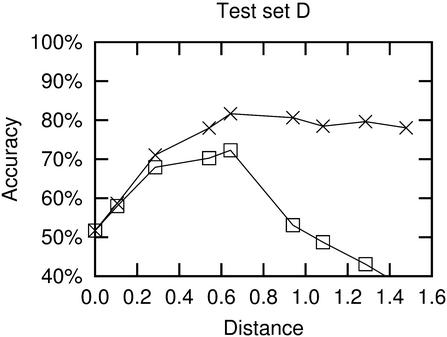
These effects are illustrated in Figure 7. When using ‘correct’ alignments, the accuracy rises with distance, as the evolutionary information increases. The accuracy levels off at ∼80%, which seems to be the maximum obtainable average for two sequences of this type using Pfold. The graph made from the ClustalW alignments show how accuracy increases until an evolutionary distance of ∼0.60. After this, the accuracy drops due to alignment errors. At a distance of ∼0.90 the quality of alignments become so low that the structures might as well be predicted individually.
Figure 7.
Accuracy as a function of pairwise distance between two sequences being analysed. As in Figure 6, crosses are from results using ‘correct’ alignments, while boxes are from ClustalW alignments. The pairs were grouped according to their Jukes–Cantor distances, in the intervals [0;0.2), [0.2;0.4), [0.4;0.6) etc. The points represent average results for 50 random sequence combinations from a specific range of distances. The x-value of a point is the average of the 50 distances.
Speed
The algorithmical improvements made in this work reduces the computation time substantially. The largest improvement is from estimating a single evolutionary tree and fixing it, rather than estimating all the branch lengths under the RNA model. For details on the computation times, see Appendix 2 (available as Supplementary Material).
DISCUSSION
Some aspects of this method remain to be explored, as described by Knudsen and Hein (12). These include: base stacking interactions, a grammar more closely describing real RNA structures and other models for base-pair evolution.
If base-stacking interactions and a better grammar is incorporated in Pfold, the prediction accuracies should become close to the MFOLD results for single sequences (9–11), since the methods resemble each other closely in that situation. For multiple sequences, Pfold should still be able to perform even better.
When structures are conserved in evolution, inclusion of information from multiple related sequences improves predictions. A number of methods have been developed that combine energy calculations with evolutionary information through a given alignment (24–27). These methods have proven quite reliable but lack an explicit evolutionary model.
As emphasised by this work, an important aspect of RNA structure prediction is the alignment problem. In methods that depend on a sequence alignment, the success of the method is closely linked to the quality of the alignment. Some work has been done in the field of RNA structural sequence alignment (28). Rivas and Eddy (18) developed an RNA model that takes the alignment of two sequences into consideration through a pair-SCFG. They did, however, assume the alignment to be given since computational time would be prohibitive in using their method to align sequences. The RNAGA method by Chen et al. (29) predicts consensus structures without trying to align the sequences which might be a useful approach to avoiding the alignment problem.
SUPPLEMENTARY MATERIAL
Supplementary Material is available at NAR Online.
Acknowledgments
ACKNOWLEDGEMENTS
B.K. would like to thank the University of Florida, the Carlsberg Foundation (grant no. ANS-0604/20) and the Danish National Science Research Council (grant no. 21-00-0283) for their support. B.K. also thanks Christian N. S. Pedersen for his great help in answering questions about Unix and programming. We acknowledge the help of Ebbe S. Andersen in making this method practically useful and in illustrating the web server. Finally, we thank Jakob S. Pedersen for helpful comments on the manuscript.
REFERENCES
- 1.Sprinzl M., Horn,C., Brown,M., Ioudovitch,A. and Steinberg,S. (1998) Compilation of tRNA sequences and sequences of tRNA genes. Nucleic Acids Res., 26, 148–153. [DOI] [PMC free article] [PubMed] [Google Scholar]
- 2.Wuyts J., De Rijk,P., Van de Peer,Y., Winkelmans,T. and De Wachter,R. (2001) The European large subunit ribosomal RNA database. Nucleic Acids Res., 29, 175–177. [DOI] [PMC free article] [PubMed] [Google Scholar]
- 3.Wuyts J., Van de Peer,Y., Winkelmans,T. and De Wachter,R. (2002) The European database on small subunit ribosomal RNA. Nucleic Acids Res., 30, 183–185. [DOI] [PMC free article] [PubMed] [Google Scholar]
- 4.Zwieb C., Gorodkin,J., Knudsen,B., Burks,J. and Wower,J. (2003) tmRDB (tmRNA database). Nucleic Acids Res., 31, 446–447. [DOI] [PMC free article] [PubMed] [Google Scholar]
- 5.Brown J.W. (1999) The ribonuclease P database. Nucleic Acids Res., 27, 314. [DOI] [PMC free article] [PubMed] [Google Scholar]
- 6.Rosenblad M.A., Gorodkin,J., Knudsen,B., Zwieb,C. and Samuelsson,T. (2003) Nucleic Acids Res., 31, 363–364. [DOI] [PMC free article] [PubMed] [Google Scholar]
- 7.Nussinov R., Pieczenik,G., Griggs,J.R. and Kleitman,D.J. (1978) Algorithms for loop matchings. SIAM J. Appl. Math., 35, 68–82. [Google Scholar]
- 8.Zuker M. and Stiegler,P. (1981) Optimal computer folding of large RNA sequences using thermodynamic and auxiliary information. Nucleic Acids Res., 9, 133–148. [DOI] [PMC free article] [PubMed] [Google Scholar]
- 9.Zuker M. (1989) Computer prediction of RNA structure. Methods Enzymol., 180, 262–288. [DOI] [PubMed] [Google Scholar]
- 10.Walter A.E., Turner,D.H., Kim,J., Lyttle,M.H., Mueller,P., Mathews,D.H. and Zuker,M. (1994) Coaxial stacking of helixes enhances binding of oligoribonucleotides and improves predictions of RNA folding. Proc. Natl Acad. Sci. USA, 91, 9218–9222. [DOI] [PMC free article] [PubMed] [Google Scholar]
- 11.Mathews D.H., Sabina,J., Zuker,M. and Turner,D.H. (1999) Expanded sequence dependence of thermodynamic parameters improve prediction of RNA secondary structure. J. Mol. Biol., 288, 911–940. [DOI] [PubMed] [Google Scholar]
- 12.Knudsen B. and Hein,J. (1999) RNA secondary structure prediction using stochastic context-free grammars and evolutionary history. Bioinformatics, 15, 446–454. [DOI] [PubMed] [Google Scholar]
- 13.Lari K. and Young,S.J. (1990) The estimation of stochastic context-free grammars using the inside–outside algorithm. Comput. Speech Lang., 4, 35–56. [Google Scholar]
- 14.Felsenstein J. (1981) Evolutionary trees from DNA sequences: a maximum likelihood approach. J. Mol. Evol., 17, 368–376. [DOI] [PubMed] [Google Scholar]
- 15.Durbin R., Eddy,S., Krogh,A. and Mitchison,G. (1998) Biological Sequence Analysis: Probabilistic Models of Proteins and Nucleic Acids. Cambridge University Press, Cambridge, UK. [Google Scholar]
- 16.Thorne J.L., Kishino,H. and Felsenstein,J. (1991) An evolutionary model for maximum likelihood alignment of DNA sequences. J. Mol. Evol., 33, 114–124. [DOI] [PubMed] [Google Scholar]
- 17.Hein J., Wiuf,C., Knudsen,B., Møller,M. and Wibling,G. (2000) Statistical alignment: computational properties, homology testing and goodness-of-fit. J. Mol. Biol., 302, 265–279. [DOI] [PubMed] [Google Scholar]
- 18.Rivas E. and Eddy,S.R. (2001) Noncoding RNA gene detection using comparative sequence analysis. BMC Bioinformatics, 2, 8. [DOI] [PMC free article] [PubMed] [Google Scholar]
- 19.Thorne J.L., Goldman,N. and Jones,D.T. (1996) Combining protein evolution and secondary structure. Mol. Biol. Evol., 13, 666–673. [DOI] [PubMed] [Google Scholar]
- 20.Saitou N. and Nei,M. (1987) The neighbor-joining method: a new method for reconstructing phylogenetic trees. Mol. Biol. Evol., 4, 406–425. [DOI] [PubMed] [Google Scholar]
- 21.McCaskill J.S. (1990) The equilibrium partition function and base pair binding probabilities for RNA secondary structure. Biopolymers, 29, 1105–1119. [DOI] [PubMed] [Google Scholar]
- 22.Thompson J.D., Higgins,D.G. and Gibson,T.J. (1994) CLUSTAL W: improving the sensitivity of progressive multiple sequence alignment through sequence weighting, position specific gap penalties and weight matrix choice. Nucleic Acids Res., 22, 4673–4680. [DOI] [PMC free article] [PubMed] [Google Scholar]
- 23.Jukes T.H. and Cantor,C.R. (1969) Evolution of protein molecules. In Munro,H.N. (ed.), Mammalian Protein Metabolism. Academic Press, New York, pp. 21–132. [Google Scholar]
- 24.Hofacker I.L. and Stadler,P.F. (1999) Automatic detection of conserved base pairing patterns in RNA virus genomes. Comput. Chem., 23, 401–414. [DOI] [PubMed] [Google Scholar]
- 25.Juan V. and Wilson,C. (1999) RNA secondary structure prediction based on free energy and phylogenetic analysis. J. Mol. Biol., 289, 935–947. [DOI] [PubMed] [Google Scholar]
- 26.Lück R., Gräf,S. and Steger,G. (1999) ConStruct: a tool for thermodynamic controlled prediction of conserved secondary structure. Nucleic Acids Res., 27, 4208–4217. [DOI] [PMC free article] [PubMed] [Google Scholar]
- 27.Hofacker I.L., Fekete,M. and Stadler,P.F. (2002) Secondary structure prediction for aligned RNA sequences. J. Mol. Biol., 319, 1059–1066. [DOI] [PubMed] [Google Scholar]
- 28.Gorodkin J., Heyer,L.J. and Stormo,G.D. (1997) Finding the most significant common sequence and structure motifs in a set of RNA sequences. Nucleic Acids Res., 25, 3724–3732. [DOI] [PMC free article] [PubMed] [Google Scholar]
- 29.Chen J.-H., Len,S.-Y. and Maizel,J.V. (2000) Prediction of common secondary structures of RNAs: a genetic algorithm approach. Nucleic Acids Res., 28, 991–999. [DOI] [PMC free article] [PubMed] [Google Scholar]
Associated Data
This section collects any data citations, data availability statements, or supplementary materials included in this article.


