

Abstract
Insulin is secreted from pancreatic β cells in response to an elevation of cytoplasmic Ca2+ resulting from enhanced Ca2+ influx through voltage-gated Ca2+ channels. Mouse β cells express several types of Ca2+ channel (L-, R- and possibly P/Q-type). β cell-selective ablation of the gene encoding the L-type Ca2+ channel subtype Cav1.2 (βCav1.2–/– mouse) decreased the whole-cell Ca2+ current by only ∼45%, but almost abolished first-phase insulin secretion and resulted in systemic glucose intolerance. These effects did not correlate with any major effects on intracellular Ca2+ handling and glucose-induced electrical activity. However, high-resolution capacitance measurements of exocytosis in single β cells revealed that the loss of first-phase insulin secretion in the βCav1.2–/– mouse was associated with the disappearance of a rapid component of exocytosis reflecting fusion of secretory granules physically attached to the Cav1.2 channel. Thus, the conduit of Ca2+ entry determines the ability of the cation to elicit secretion.
Keywords: Ca2+ channels/diabetes/exocytosis/insulin secretion/pancreatic β cells
Introduction
Insulin secretion occurs upon elevation of the blood glucose concentration, when the pancreatic β cell depolarizes and regenerative electrical activity consisting of Ca2+-dependent action potentials is initiated (Henquin and Meissner, 1984; Ashcroft and Rorsman, 1989). The resultant elevation of the cytoplasmic Ca2+ concentration culminates in exocytosis of insulin-containing secretory granules (Barg et al., 2001; (Maecheler and Wollheim, 2001). Mouse pancreatic β cells contain dihydropyridine-sensitive L-type Ca2+ channels and glucose-induced insulin secretion is almost abolished by pharmacological inhibitors of L-type Ca2+ channels such as nifedipine. The molecular identity of the pancreatic β cell L-type Ca2+ channel has not been established and it has variably been reported to be Cav1.2 (α1C) (Barg et al., 2001) or Cav1.3 (α1D) (Yang et al., 1999). A significant fraction (∼50%) of the whole-cell Ca2+ current is resistant to nifedipine (Gilon et al., 1997), indicating the presence of additional Ca2+ channel subtypes in the β cell. The physiological roles of the non-L-type Ca2+ channels are unknown.
Glucose-induced insulin secretion follows a biphasic time-course. A transient first phase lasting 5–10 min is followed by a sustained second phase (Curry et al., 1968). The cellular background to the two phases of release remains unknown but it has been suggested to reflect the sequential release of distinct pools of granules, which vary with regard to release competence (Barg et al., 2002; Bratanova-Tochkova et al., 2002). In support of this idea, high-resolution capacitance measurements have documented two components of exocytosis (Renström et al., 1996; Eliasson et al., 1997). The rapid component is believed to reflect the release of a limited pool of readily releasable granules in close proximity to the L-type Ca2+ channels (Barg et al., 2001), whereas replenishment of this pool by mobilization of granules originally residing in a large reserve pool gives rise to the slower component. Interestingly, the initial component can selectively be prevented by intracellular addition of a recombinant peptide corresponding to the loop connecting domains II and III of Cav1.2 (Wiser et al., 1999; Barg et al., 2001), suggesting that the assembly of a tight Ca2+ channel/insulin granule complex is required for rapid exocytosis in the β cell.
Here we have investigated the role of the L-type Cav1.2 Ca2+ channel for insulin secretion by combining a targeted gene knockout approach with time-resolved insulin release assays and high-resolution single-cell capacitance measurements of exocytosis. Our results suggest that Cav1.2 Ca2+ channels are required for first-phase insulin release and maintenance of systemic glucose tolerance. Collect ively, these data raise the interesting possibility that polymorphisms of genes encoding proteins involved in the formation of the exocytotic core/Ca2+ channel complex may lead to an impairment of rapid insulin secretion, a hallmark of human type-2 diabetes.
Results
Generation of βCav1.2–/– mice
Mice lacking the Cav1.2 L-type Ca2+ channel die in utero before day 15 post-coitum (Seisenberger et al., 2000). To circumvent embryonic lethality, the Cre/loxP recombination system was used to selectively inactivate the Cav1.2 gene in pancreatic β cells (Figure 1A; see Materials and methods for details). β cell-specific Cre/loxP recombination was achieved by expressing the Cre-recombinase under the control of the rat insulin 2 promoter and was ascertained by PCR analysis using DNA isolated from islets of control and βCav1.2–/– mice (Figure 1B). The islets of βCav1.2–/– mice still contained detectable amounts of the ‘floxed’ Cav1.2 gene (L2 allele). This we attribute to contribution of DNA from islet cells not expressing the insulin 2 promoter, i.e. α, δ and PP cells. No Cre-mediated recombination was detectable in heart and lung (data not shown). Islet expression of Cav1.2 mRNA in βCav1.2–/– mice consisted predominantly of the ‘knockout’ variety of Cav1.2 mRNA and only very low amounts of the wild-type transcript could be detected (Figure 1C). By contrast, the wild-type mRNA was still present in heart (Figure 1C), indicating that Cre-mediated recombination did not occur in this tissue. The successful tissue-selective ablation of Cav1.2 in β cells was supported by western blot analysis (Figure 1D) using both a Cav1.2-specific (Diii) and a pan α1 antibody recognizing high voltage-gated Ca2+ channels (Div). Equal loading of the gels shown in (Diii) and (Div) was ascertained by staining for β-actin. The specificity of the Cav1.2 antibody was confirmed using HEK293 cells stably transfected with Cav1.2 (Di) and by heart preparations from (+/+) or (–/–) embryos (Dii) (mouse line A in Seisenberger et al., 2000). Although both antibodies recognize several proteins, it is clear that a band with the mass expected for Cav1.2 selectively disappears following knockout of Cav1.2.

Fig. 1. β cell-specific inactivation of the Cav1.2 gene. (A) To the left, a schematic drawing of the location of the transmembrane segments and the pore loop encoded by exons 14 and 15. To the right, the genomic structures of the wild-type and of the mutated Cav1.2 genes, respectively, are shown. The black arrows indicate the position of the primers used for genotyping and the fragment length of the PCR products. The numbers indicate the exon number. Schematic representation of the wild-type allele, the knockout allele (L1) and the conditional Cav1.2 (L2) allele, which contains two loxP sites flanking exons 14 and 15. (B) PCR analysis of genomic DNA from control, βCav1.2–/– islets and control reaction (no DNA) and kb marker lane as indicated below the lanes. (C) RT–PCR analysis of islets and heart from a βCav1.2–/– mouse (CaV1.2L1/L2/RIP-Cre+/tg) and kb marker as indicated. The scheme (top) represents the locations of the primer pair E13 and Lef1 used in RT–PCR (lower). The double band in heart was sequenced. The upper band represents wild-type mRNA, whereas the lower band consists of wild-type mRNA missing 80 bp. Because the control mice are heterozygous, the heart also expresses the L2 gene transcript (396 bp). As an internal standard, the hypoxanthine phosphoribosyl transferase (HPRT) cDNA was amplified together with the Cav1.2 cDNA. (D) Western blots of protein extracts from control islets and βCav1.2–/– islets (as indicated) using a Cav1.2-specific antibody (iii, top), a panCav-specific antibody (iv) and a β-actin antibody (v, bottom). The specificity of the Cav1.2 antibody was confirmed using HEK293 cells stably transfected with Cav1.2 cells (i) and by heart preparations from (+/+) or (–/–) embryos (ii) (Seisenberger et al., 2000). Please note: Cav1.2 shows an apparently higher mol. wt of 270 kDa in this SDS–PAGE system (11%, low cross-linking).
Complete and selective loss of L-type Ca2+ currents in βCav1.2–/– β cells
We studied the functional consequences of β cell-selective ablation of the Cav1.2 gene using perforated-patch whole-cell Ca2+-current measurements. Figure 2A shows whole-cell Ca2+ currents recorded from a control β cell during a 100 ms depolarization from –70 to –10 mV (close to the peak of the β cell action potential; Henquin and Meissner, 1984) under control conditions and after addition of 1 µM specific L-type Ca2+ channel agonist BayK8644. The peak Ca2+ current elicited by a depolarization to 0 mV in the control β cells (–58 ± 5 pA) was similar to that observed in β cells from NMRI mice (–49 ± 5 pA) under the same experimental conditions (Larsson-Nyrén et al., 2001). The effects of BayK8644 on the integrated Ca2+ currents (Q) evoked by depolarizations to voltages (V) between –50 and +20 mV are summarized in Figure 2B. The agonist stimulated the Ca2+ current to about the same extent at all voltages, and at –10 mV Ca2+ influx increased 2.6 ± 0.6-fold (P < 0.05, n = 5).
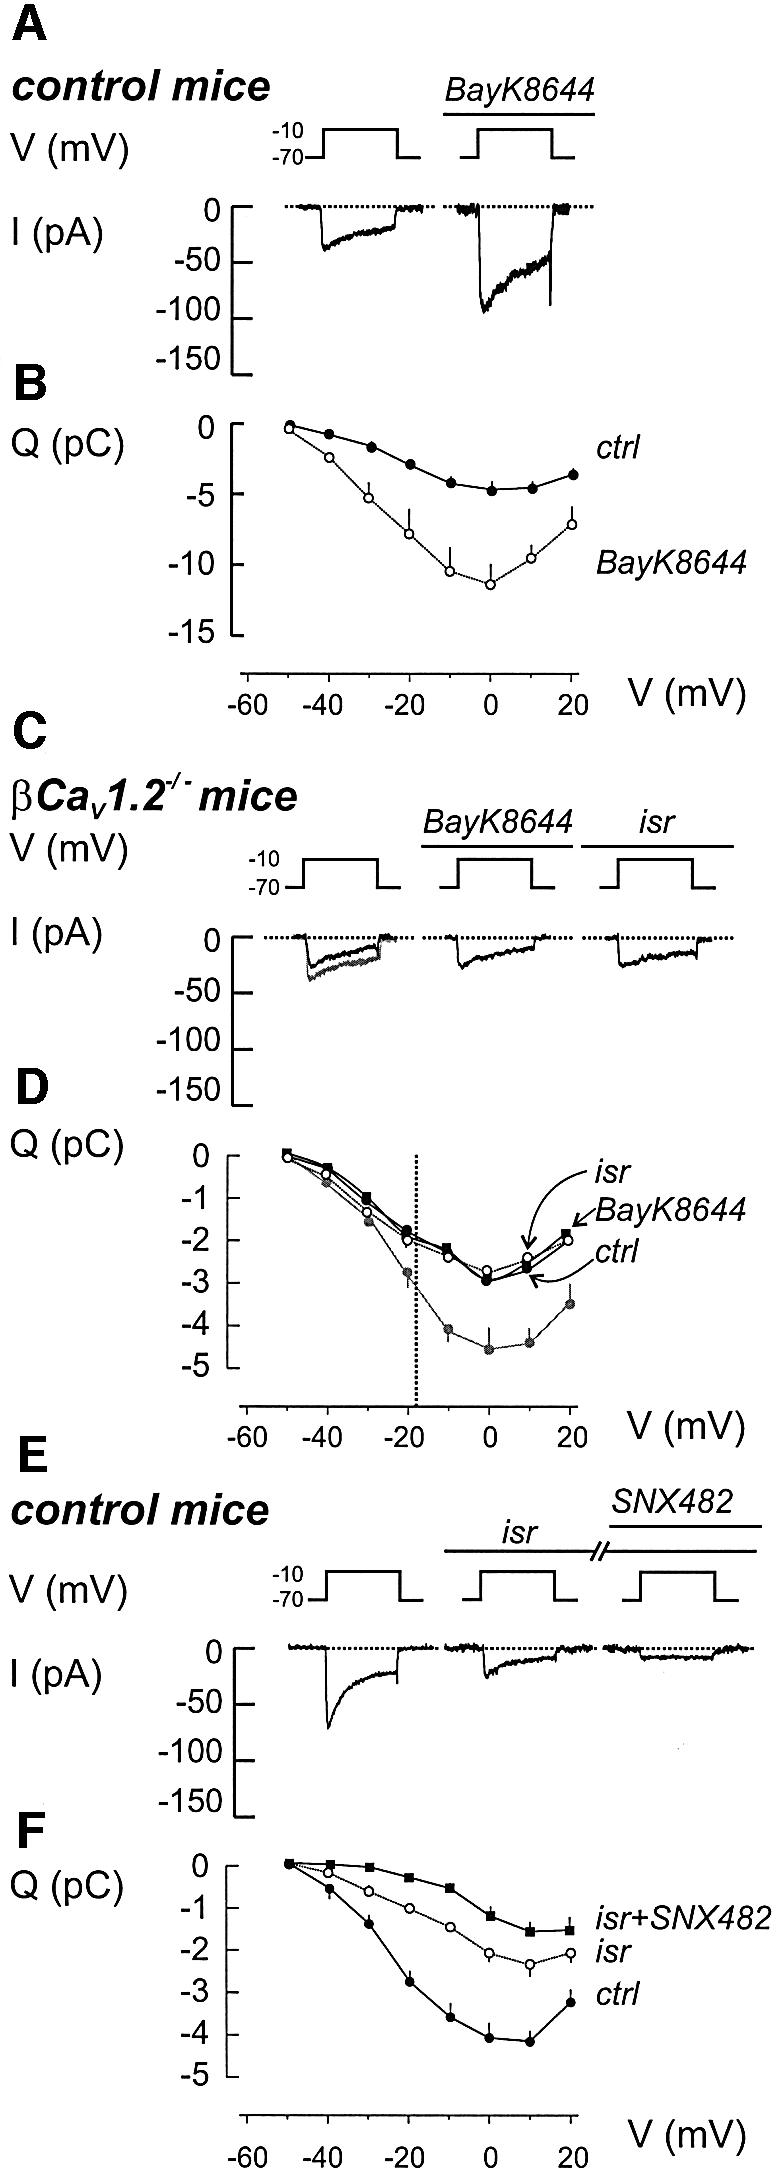
Fig. 2. Ca2+ currents in β cells from control and βCav1.2–/– mice. (A) Whole-cell Ca2+ currents (I) during 100 ms depolarizations from –70 to –10 mV (V) in the absence (left) and presence (right) of 1 µM BayK8644. The dotted line represents the zero current level. (B) Charge (Q)–voltage (V) relationships recorded in the absence (filled circles) and presence of BayK8644 (open circles). Depolarizations were 100 ms long and went to voltages between –50 and +20 mV. Mean values ± SEM of five experiments. P < 0.05 for voltages above –40 mV. (C and D) As in (A and B) but recordings were conducted on β cells from βCav1.2–/– mice. The effects of the L-type channel activator BayK8644 (1 µM) as well as the L-type channel inhibitor isradipine (2 µM) were evaluated. The Q–V relationship recorded from control β cells under control conditions has been superimposed (gray). Data represent mean values ± SEM of 10, 10 and 5 experiments carried out under control conditions, in the presence of BayK8644 or after addition of isradipine, respectively. P < 0.01 for voltages beyond –20 mV when comparing control currents recorded in βCav1.2–/– and control mice. The dotted vertical line indicates the average peak voltage attained during the action potential (approximately –18 mV). (E and F) as (A and B) but isradipine (2 µM) and SNX482 (0.1 µM) were included sequentially as indicated above the voltage trace. Mean values ± SEM of nine experiments. When comparing currents recorded before and after addition of isradipine, P < 0.01 at voltages beyond –30 mV. For currents detected before and after addition of SNX482 and in the continued presence of isradipine, P < 0.05 at voltages –30 to 0 mV.
Ca2+ currents were reduced in β cells from βCav1.2–/– mice. The integrated Ca2+ current observed at –10 mV only amounted to 2.4 ± 0.3 pC (n = 10), ∼55% of the 4.4 ± 0.4 pC (n = 11) seen in control β cells. However, it is noteworthy that, up to –30 mV, the amplitude of the Ca2+ current was identical in the control and βCav1.2–/– β cells. Even at the peak of the β cell action potential (approximately –18 mV; dotted line in Figure 2D), the effects of Cav1.2 disruption were limited to ∼30%. Importantly, BayK8644, as well as the potent L-type Ca2+ channel antagonist isradipine (2 µM), were ineffective in these β cells (Figure 2C). The Q–V relationships in βCav1.2–/– β cells recorded in the absence and presence of BayK8644 or isradipine are shown in Figure 2D, and are compared with the relationship recorded under control conditions in control β cells (gray line). Cell capacitance was nearly identical in βCav1.2–/– and control β cells (5.9 ± 0.2 and 5.8 ± 0.3 pF, respectively), demonstrating that the smaller Ca2+ current in βCav1.2–/– β cells indeed reflects a reduced Ca2+ channel density.
To confirm the β cell-selective ablation of Cav1.2, we measured whole-cell Ca2+ currents in glucagon-producing α cells. As expected, the amplitude of the Ca2+ current in α cells (identified by the presence of a Na+ current activated at physiological membrane potentials; Barg et al., 2000) was unaffected in βCav1.2–/– mice. The mean charge entry during a 100 ms depolarization to –10 mV amounted to –4.4 ± 0.4 pC (n = 18) and –4.5 ± 0.5 pC (n = 8) in α cells from βCav1.2–/– and control mice, respectively (data not shown). The effects of BayK8644 (1 µM) on the α cell Ca2+ current in βCav1.2–/– mice were tested in four cells and increased the Ca2+ current by 58 ± 8% (P < 0.01, n = 4; data not shown).
The consequences of ablating Cav1.2 on the β cell Ca2+ current are similar to those obtained using isradipine (Figure 2E). Isradipine blocked the Ca2+ current to the same extent at all voltages and the integrated current observed at –10 mV was reduced by 53 ± 6% (n = 9). Nifedipine (20 µM) likewise reduced the β cell Ca2+ current by 51 ± 4% (n = 5; data not shown). We also tested the R-type Ca2+ channel antagonist SNX482 (Vajna et al., 2001) on the isradipine-resistant component. The action of SNX482 was voltage-dependent and it blocked ≥60% of the isradipine-resistant component at voltages up to –10 mV. A cocktail of isradipine, SNX482 and the P-/Q-type Ca2+ channel inhibitors ω-conotoxin MVIIC (0.5 µM) or ω-agatoxin IVA (0.1 µM) reduced Ca2+ current elicited by depolarizations to –10 mV by 97 ± 4% (n = 4; data not shown).
βCav1.2–/– mice exhibit impaired glucose tolerance and insulin secretion in vivo
We next determined the consequences of β cell-selective disruption of the Cav1.2 gene on systemic glucose homeostasis and insulin release. The βCav1.2–/– mice exhibited a slight hyperglycemia under basal and fasted (6 h) conditions. Fasting glucose levels averaged 6.8 ± 0.4 mM (n = 8) and 7.7 ± 0.4 mM (P < 0.001, n = 7) in control and βCav1.2–/– mice, respectively (data not shown). An intraperitoneal glucose challenge (2 g/kg body weight) in fed mice (Figure 3A) revealed an impaired glucose tolerance in βCav1.2–/– mice, glucose concentrations as high as ∼30 mM being attained. This correlated with a slight reduction of basal plasma insulin levels and marked reduction of glucose-induced first-phase insulin secretion (measured 3 min after the glucose challenge) in the βCav1.2–/–mice (Figure 3B).

Fig. 3. Impaired glucose tolerance and in vivo insulin secretion in βCav1.2–/– mice. (A) Changes in plasma glucose (p-glucose) in response to an intraperitoneal glucose challenge (2 g/kg body weight) applied at time zero in control (black squares) and βCav1.2–/–mice (gray squares). Data are mean values ± SEM of nine animals for both data sets. (B) Plasma insulin levels (p-insulin) measured in control (black squares) and βCav1.2–/– mice (gray squares) at 0, 3 and 8 min after glucose injection.
Loss of first-phase insulin secretion in βCav1.2–/– mice in vitro
To allow comparison between the kinetics of glucose-induced insulin secretion in control and βCav1.2–/– mice, in situ pancreatic perfusions were carried out (Figure 4). In control animals, elevating the glucose concentration (from 1 to 10 mM) produced a ∼20-fold enhancement of secretion that peaked 3 min after onset of stimulation (compare parts in Figure 3B). In βCav1.2–/– mice, first-phase (<5 min) secretion was inhibited by 78 ± 12% (P < 0.01) and the remaining secretory response peaked ∼1 min later than in control animals. No difference in insulin secretion between control and βCav1.2–/– mice was observed ≥5 min after onset of stimulation.

Fig. 4. Blunted first-phase insulin secretion in βCav1.2–/– pancreata. Insulin release from in situ perfused pancreatic glands from control (black squares) and βCav1.2–/– mice (gray circles) before and after elevating glucose from 1 to 10 mM (black horizontal bar). The dotted horizontal line corresponds to the pre-stimulatory rate of insulin release in control mice. Data represent mean values ± SEM of four animals in both groups.
We correlated these observations to insulin secretion in vitro using isolated islets. In control mice (Figure 5A), an increase in extracellular glucose from 1 to 20 mM stimulated insulin secretion 16-fold. The L-type Ca2+ channel blocker nifedipine (20 µM) had no effect on basal secretion but inhibited glucose-induced release by close to 80%. The R-type channel inhibitor SNX482 (100 nM) likewise failed to affect basal insulin release, but inhibited glucose-elicited insulin secretion by a mere 10% (n = 6; data not shown). In agreement with these results, glucose remained capable of stimulating insulin secretion 3.1-fold even in the presence of nifedipine. The latter effect we attribute to Ca2+ entry through non-L-type Ca2+ channels. In islets from βCav1.2–/– mice (Figure 5B), basal insulin secretion was unaffected, but glucose-induced insulin secretion was much lower than in the control mice and comparable to that seen after blockage of the Ca2+ channels with nifedipine (2.7-fold enhancement). As expected, given that Cav1.2 channels appear to constitute the only L-type Ca2+ channels in the β cell (Figure 2C and D), nifedipine had no effect on glucose-induced insulin secretion in the knockout mice. The suppressed insulin secretory capacity in islets from βCav1.2–/– mice could not be attributed to reduced total insulin content, which amounted to 25 ± 1 ng/islet (n = 13) and 23 ± 2 ng/islet (n = 8) in islets from control and βCav1.2–/– mice, respectively.
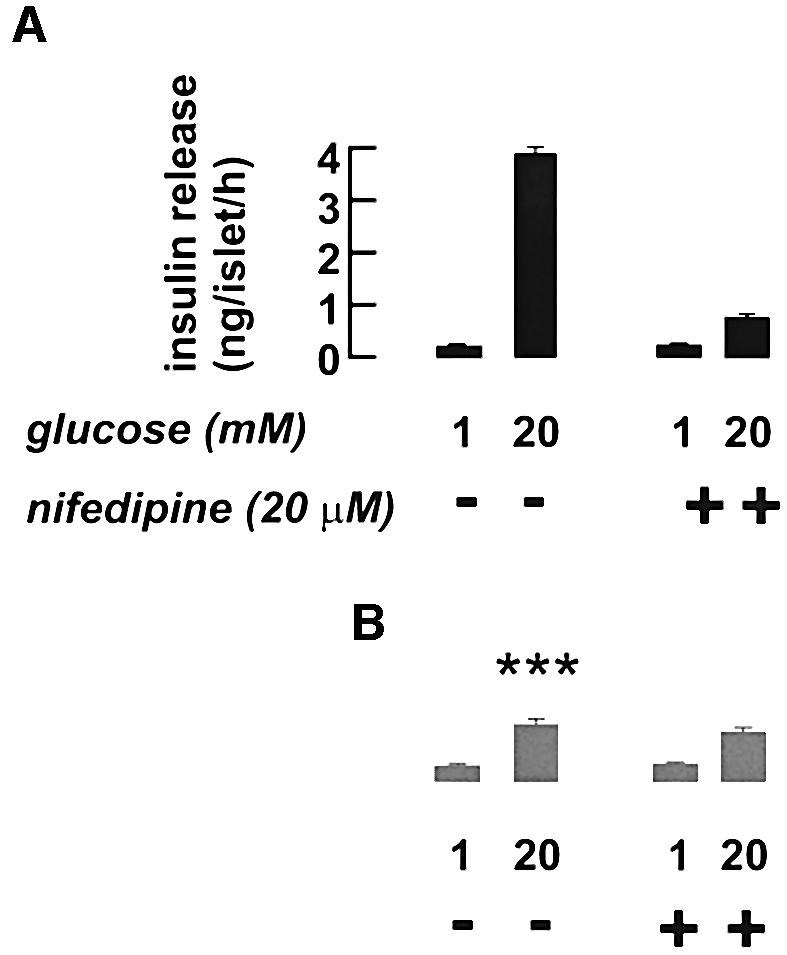
Fig. 5. Loss of a nifedipine-sensitive component of insulin release in isolated Cav1.2–/– islets. Insulin secretion measured in isolated islets from control (A, black bars) and Cav1.2–/– mice (B, gray bars) in the presence of 1 or 20 mM glucose with or without 20 µM nifedipine as indicated. Data are mean values ± SEM of six experiments. ***P < 0.001 versus the same condition in control mice.
Intracellular Ca2+ handling and electrical activity are unperturbed in β cells from βCav1.2–/– mice
The impaired insulin secretory capacity of βCav1.2–/– islets is not attributable to abnormalities of intracellular Ca2+ handling (Figure 6A and B) or glucose-induced electrical activity (Figure 6C and D). Basal [Ca2+]i averaged 103 ± 8 nM (n = 8) and 112 ± 12 nM (n = 8) in control and βCav1.2–/– islets, respectively. Following stimulation with 10 mM glucose, [Ca2+]i rose to a peak value of 279 ± 25 nM in control islets and 325 ± 55 nM in islets from the knockout mice. The time-averaged [Ca2+]i measured both at 10 and 20 mM glucose were likewise not different in the two strains of mice (data not shown). The latency between glucose addition and the initial increase in [Ca2+]i averaged 257 ± 24 s in control islets and 327 ± 18 s (P < 0.05) in βCav1.2–/– islets.

Fig. 6. Intracellular Ca2+ handling and glucose-induced electrical activity are only moderately affected by disruption of the Cav1.2 gene. (A) Cytoplasmic Ca2+ ([Ca2+]i) measured before and after addition of 10 mM glucose in an islet isolated from a control mouse. (B) As in (A) but using an islet isolated from a βCav1.2–/– mouse. Data are representative of eight recordings in each group. (C) Recording of the membrane potential from a β cell in a small cell cluster isolated from control islets exposed to 10 mM glucose at steady state. (D) The same as in (C) but in a β cell from a βCav1.2–/– mouse. Data are representative of four recordings in both groups that lasted long enough to permit multiple changes of the external solutions (>20 min).
We ascertained that steady-state electrical activity was not significantly affected by ablation of Cav1.2. In control mice, the membrane potential changed from a resting potential of –62 ± 3 mV (n = 4) in the absence of glucose to –17 ± 5 mV (measured at the peak of the action potential) in the presence of 10 mM glucose. The corresponding values in the β cells from βCav1.2–/– mice averaged –64 ± 5 and –19 ± 4 mV (n = 4). It is evident that the pattern of action potential firing in β cells from βCav1.2–/– mice was somewhat different from that observed in the control mice in not being grouped to short bursts. It might seem surprising that Cav1.2 ablation had no effect on the peak voltage of the action potential given that the peak Ca2+ current was reduced by ∼30% at –20 mV (Figure 2D). However, several processes in addition to the Ca2+-current amplitude influence the shape of the action potential. These include, for example, the magnitude of the resting and voltage-gated K+ conductances.
Loss of rapid Ca2+-dependent exocytosis in β cells from βCav1.2–/– mice
The mild consequences of ablating Cav1.2 in β cells on intracellular Ca2+ suggest that impaired glucose tolerance and insulin secretion may result from direct interference with the exocytotic apparatus. Indeed, it has been shown previously that Cav1.2 Ca2+ channels co-assemble with fusion proteins including synaptotagmin, syntaxin and SNAP-25 (Wiser et al., 1999; Ji et al., 2002). We used cell capacitance measurements to study the kinetics of depolarization-evoked exocytosis in single β cells from control and βCav1.2–/– mice. Figure 7A shows changes in cell capacitance in response to a train of ten 500 ms depolarizations. The data of a total of nine experiments are summarized in Figure 7B. Typically, the capacitance increase per pulse decreased during the train, from 80 to 100 fF in response to the initial depolarizations to a steady-state rate of 25 fF/pulse. This behavior is expected if the cell contains a limited pool of releasable granules, which are gradually depleted during repetitive stimulation (Neher, 1998; Barg et al., 2000, 2001, 2002). When the same experiments were conducted in β cells from βCav1.2–/– mice (Figure 7C and D), exocytosis in response to the initial depolarizations was markedly reduced whereas that elicited later during the train was not affected. The Ca2+ current elicited by the depolarizations was reduced to an equal extent (∼45%) throughout the train (data not shown). The acute effects of applying the L-type Ca2+ channel antagonist isradipine were identical to those resulting from Cav1.2 disruption (Figure 7E and F). By contrast, inhibition of R-type Ca2+ channels with SNX482, which reduced the Ca2+ current by ∼25%, affected late exocytosis but had no significant effect on the response to the first depolarization (Figure 7G and H). The differential effects of selective L- and R-type channel inhibition on rapid and sustained exocytosis, respectively, are at variance with the effect of the non-selective Ca2+ channel blocker Co2+ (0.5 mM), which inhibited Ca2+ entry by ∼50% (i.e. the same as that produced by ablation of Cav1.2), and reduced exocytosis to an equal extent (45 ± 6%; Figure 7I and J) throughout the train.

Fig. 7. Loss of rapid exocytosis in βCav1.2–/– β cells. (A) Increase in cell capacitance (ΔC, lower) elicited by a train of ten 500 ms depolarizations from –70 to 0 mV (V, upper). The dotted line indicates the pre-stimulatory level. (B) Increment in cell capacitance by each depolarization (ΔCn – ΔCn–1) displayed against pulse number (n). Data are mean values ± SEM of nine experiments. (C and D) The same as in (A and B) but using a β cell obtained from a βCav1.2–/– mouse. Data are mean values ± SEM of 15 experiments. (E and F) As in (A and B) but in the presence of 2 µM isradipine. Data are mean values ± SEM of eight experiments. (G and H) As in (A and B) but in the presence of 0.1 µM SNX482. Data are mean values ± SEM of seven experiments. (I and J) As in (A and B) but in the presence of 0.5 mM Co2+. Data are mean values ± SEM of 11 experiments. In (D, F, H and J), the superimposed gray line denotes the data in control β cells from (A). ***P < 0.001, **P < 0.01 and *P < 0.05 versus responses in the control β cells (gray line).
Discussion
General considerations
Here we have studied the effects of ablating the L-type Ca2+ channel gene Cav1.2 in vivo, at the whole-organ level, in isolated islets and individual islet cells. The combination of techniques makes it possible to correlate the consequences of a single-cell defect on the complex systems physiology of insulin release and plasma glucose homeostasis. The genetic model we have chosen strictly depends on the comparison of litter-matched animals of a control group (Cav1.2+/L2/RIP-Cre+/tg resulting in the genotype Cav1.2+/L1/RIP-Cre+/tg only in the β cells) and of a knockout group (Cav1.2L1/L2/RIP-Cre+/tg resulting in the genotype Cav1.2L1/L1/RIP-Cre+/tg only in the β cells). These animals are identical with the exception of one functional Cav1.2 allele in the control group. Therefore, we compare animals with two knockout alleles with those with one wild-type allele, allowing us to establish the specific function of Cav1.2. Careful analysis of the L-type Ca2+-current densities in embryonic cardiomyocytes for all three genotypes and two differently constructed mouse lines (stop codon in exon 3 versus deletion of exons 14/15 and stop in 16) failed to detect significant differences between (+/+) and (+/–) cells (Seisenberger et al., 2000). We have also analyzed mice in which the Cav1.2 channel was specifically deleted in smooth muscle cells. Cav1.2 current densities were identical in litter-matched animals for the genotypes (+/–) or (+/+) (N.Klugbauer and F.Hofmann, unpublished data). These considerations indicate that a gene dose effect does not account for the present results.
In the following, we will consider the molecular identity of the L-type Ca2+ channel in the pancreatic β cell, the importance of the L-type Cav1.2 channel for systemic glucose control and first-phase insulin secretion, as well as the functional roles fulfilled by other Ca2+ channel subtypes expressed in β cells. Finally, we discuss the possibility that defects of the release machinery and/or Ca2+ entry contribute to the impaired insulin secretion seen in human type-2 diabetes.
Mouse L-type Ca2+ channel variety expressed in β cells is Cav1.2
The present data unequivocally establish the central role of Cav1.2 L-type Ca2+ channels in insulin secretion. Previous studies have indicated that Cav1.3 (α1D) might be of importance in insulin release (Yang et al., 1999; Namkung et al., 2001). However, the finding that the entire DHP-sensitive Ca2+ current is lost following inactivation of the Cav1.2 gene reinforces our previous immunochemical and electrophysiological data that Cav1.2 is the only L-type Ca2+ channel variety expressed in mouse β cells (Barg et al., 2001). In addition to the L-type Ca2+ channels, mouse β cells also express R- and P/Q-type Ca2+ channels. Although the L-type current component accounts for only ∼50% of the total Ca2+ current, its inhibition reduces glucose-induced insulin secretion in vitro by 80% and nearly abolishes insulin release in vivo. Thus, it appears that the conduit of Ca2+ entry determines the biological efficacy of the ion and that influx through L-type Ca2+ channels is more tightly coupled to insulin secretion than that occurring via P/Q- and R-type Ca2+ channels.
CaV1.2 Ca2+ channels are required for first-phase insulin secretion and rapid exocytosis in pancreatic β cells
We have previously demonstrated that Cav1.2 Ca2+ channels functionally associate with insulin granules in the β cells, and that the loop connecting the second and third homologous domains physically tethers the channel to components of the exocytotic core complex (Wiser et al., 1999). It is therefore pertinent that the effects of isradipine and genetic ablation of Cav1.2 are indistinguishable from those of intracellular application of the synprint peptide (Barg et al., 2001). We propose that in βCav1.2–/– mice, the Cav1.2/granule complex is disrupted, leading to selective suppression of fast exocytosis. We emphasize that the effects of inhibition of L-type Ca2+ channels or ablation of the Cav1.2 gene are not simply attributable to the fact that the whole-cell Ca2+ current is reduced by 50%. This possibility can be discarded by the finding that addition of the non-selective Ca2+ channel blocker Co2+ (0.5 mM), which reduces the total whole-cell Ca2+ current (i.e. that flowing through both L- and non-L-type Ca2+ channels) by 50%, does not affect the release kinetics but simply reduces the amplitude of the responses observed during the train by ∼50%.
The role of the non-L-type Ca2+ channels in β cell exocytosis remains enigmatic, but it is worth pointing out that a DHP-resistant component of insulin secretion can be detected both in the insulin-release experiments (Figure 5) as well as the capacitance measurements (Figure 7). It is possible that non-L-type Ca2+ channels fulfill functions in the β cells other than initiation of exocytosis. For example, they may play a role in the refilling of the readily releasable pool of granules by mobilizing reserve granules. This would be consistent with the finding that whereas exocytosis elicited by the two first pulses during a train of ten 500 ms depolarizations is strongly inhibited in β cells from βCav1.2–/– mice and in control β cells exposed to the L-type Ca2+ channel inhibitor isradipine (Figure 7A–F), exocytosis during the latter part of the train is unaffected. Indeed, the R-type Ca2+ channel blocker SNX482 exerts its strongest effect on late exocytosis (Figure 7H). In addition, influx of Ca2+ through non-L-type Ca2+ channels may regulate exocytosis of GABA-containing synaptic-like microvesicles (SLMV; the presence of which has been documented in β cells; Reetz et al., 1991) rather than the large insulin-containing secretory granules (compare with Takahashi et al., 1997). We have ascertained that exocytosis of SLMVs only contributes ∼1% of the total capacitance (M.Braun, A.Wendt and P.Rorsman, manuscript in preparation) increase. It is therefore safe to conclude that the data presented in this study reflect exocytosis of insulin-containing large dense core vesicles. Finally, non-L-type Ca2+ channels may not be important for exocytosis, but rather in the generation of glucose-induced electrical activity (Pereverzev et al., 2002) or gene expression (Wang et al., 2002).
Ca2+ signaling is unperturbed in βCav1.2–/– mice
Surprisingly, given the strong effects on insulin secretion, ablation of Cav1.2 had no detectable effects on intracellular Ca2+ signaling except that the glucose-induced increase in cytoplasmic Ca2+ was delayed by ∼1 min relative to that observed in control β cells. The latter effect nicely echoes the slower time-course of insulin release observed in situ (∼1 min; Figure 4). Possibly, the latter observations are the consequence of L-type Ca2+ channels contributing to the initiation of electrical activity in the β cell (Ribalet and Beigelman, 1981).
Why are measured Ca2+ concentrations unchanged in βCav1.2–/– β cells? The preservation of normal Ca2+ signaling is unexpected in view of previous data showing that glucose-induced increases in cytoplasmic Ca2+ concentration are suppressed following the addition of L-type Ca2+ channel blockers such as nifedipine (Rosario et al., 1993). This may result from a compensatory up-regulation of non-L-type Ca2+ channels, as suggested by the finding that the peak Ca2+ current measured at –20 mV in Cav1.2–/– β cells is 50% larger than that observed in control β cells exposed to isradipine (compare Figure 2D, black circles with F, white circles). In fact, the reduction of the whole-cell Ca2+ current in the knockout mice was limited to ∼30% at voltages up to –20 mV, i.e. the range of voltages covered by the action potential. This makes the strong inhibition of insulin secretion (∼80%; Figures 3–5) even more remarkable and provides additional arguments that exocytosis in the β cell is tightly coupled to Ca2+ entry through Cav1.2.
We emphasize that microfluorimetry reports the global intracellular Ca2+ concentration ([Ca2+]i) within the β cell. We have previously documented the existence of steep Ca2+ gradients in mouse pancreatic β cells and these are not resolved in the present recordings of [Ca2+]i in intact pancreatic islets. Our failure to detect any gross abnormalities in cellular Ca2+ signaling therefore does not exclude the possibility that [Ca2+]i at the release sites is affected. The significance of microdomains of high [Ca2+]i close to the release sites is illustrated by the finding that whereas glucose-induced insulin secretion is nearly abolished in the presence of nifedipine (Figure 5), exocytosis during the latter part of the train of voltage–clamp depolarizations is hardly affected (Figure 7E and F). This apparent discrepancy we attribute to the fact that the stimulus used for the capacitance measurements (trains of 500 ms depolarizations to 0 mV) is much stronger than that normally triggering insulin secretion (50 ms action potentials to ∼15 mV; Atwater et al., 1979). During the train of depolarizations, [Ca2+]i equilibrates in the β cell (Bokvist et al., 1995) and rises sufficiently throughout the cell to initiate exocytosis of granules that are not in the immediate vicinity of the Ca2+ channels. This does not occur during the brief action potentials when exocytotic levels of [Ca2+]i (≥10 µM) are only attained close to the Ca2+ channels (Barg et al., 2001, 2002).
Does human type-2 diabetes result from defective assembly of Ca2+ channels and secretory granules?
It is tempting to consider the significance of these findings to human type-2 diabetes. Like the βCav1.2–/– mice, early cases of type-2 diabetes exhibit mild basal hyperglycemia, impaired glucose tolerance and lack of first-phase insulin secretion (UKPDS16, 1995). We are not implying that loss-of-function mutations of the Cav1.2 gene cause diabetes. However, polymorphisms that result in subtle changes in gating of the Ca2+ channel or its ability to interact with the exocytotic machinery (Nagamatsu et al., 1999; Wiser et al., 1999; Zhang et al., 2002) can be envisaged to result in impaired insulin secretion. The significance of such interactions is illustrated by the fact that whereas the SNARE proteins SNAP-25 and syntaxin1A inhibit the L-type Ca2+ channel when expressed individually, channel activity is actually stimulated when these proteins are co-expressed (Wiser et al., 1999; Ji et al., 2002). Interestingly, SNARE protein expression is reduced in the GK rat model of human type-2 diabetes (Nagamatsu et al., 1999; Zhang et al., 2002) and several proteins known to be important for the anchoring of the insulin granules to the Ca2+ channels localize to chromosomal regions linked to human type-2 diabetes. These include the insulin granule proteins synaptotagmins 5 and 7 (Haeger et al., 1998; Norman et al., 1998; Pratley et al., 1998), putative Ca2+ sensors in β cell exocytosis (Ji et al., 2002), the granular fusion protein VAMP-2/synaptobrevin-2 (Regazzi et al., 1995; Parker et al., 2001; Lindgren et al., 2002) and the plasma membrane-associated fusion protein SNAP-25 (Imperatore et al., 1998; Ji et al., 2002). Indeed, a single nucleotide polymorphism in the gene encoding syntaxin1A has recently been found to associate with human type-2 diabetes (Tsunoda et al., 2001). Ca2+ channels and proteins involved in exocytosis therefore deserve to be regarded as interesting candidate genes in genetic studies of type-2 diabetes. We point out that the functional consequences of the polymorphisms must be small as we are not born with type-2 diabetes. This suggests that the changes in protein function resulting from the polymorphisms only become significant when combined with other β cell abnormalities such as age-dependent reduction in glucose metabolism (due to accumulating mitochondrial mutations; Maechler and Wollheim, 2001) with resultant impairment of electrical activity and Ca2+ entry. This concept is indeed entirely compatible with the current view that diabetes results from a combination of genetic factors, age and environmental factors (McCarthy and Froguel, 2002). Genes encoding proteins involved in exocytosis (SNARE proteins as well as Ca2+ channels) should accordingly be considered as candidate genes in future studies of the genetics of type-2 diabetes.
Materials and methods
Conditional inactivation of the Cav1.2 gene in pancreatic β cells
As described previously (Seisenberger et al., 2000), two different Cav1.2 alleles were generated by Cre-mediated recombination in ES cells (L1 and L2; Figure 1A). In L1, exons 14 and 15 that encode the IIS5 and IIS6 transmembrane segments and the pore loop in domain II were deleted. In addition, this deletion causes incorrect splicing from exon 13 to an intron upstream of exon 16, and thereby generates a premature stop codon in exon 16 and a loss-of-function allele. L2 contains the ‘floxed’ exons 14 and 15, and encodes a functional Cav1.2 gene. To generate β cell-specific Cav1.2-deficient mice, the Cav1.2+/L1 mouse (i.e. a mouse carrying one L1 allele and one wild-type allele) was crossed with a mouse expressing the Cre-recombinase under the control of the rat insulin 2 promoter (RipCre+/tg) (Postic et al., 1999). The resulting Cav1.2+/L1,RipCre+/tg mice were then mated with Cav1.2L2/L2 mice (i.e. mice homozygous for the L2 allele) to obtain the β cell-specific knockout Cav1.2L1/L2,RipCre+/tg (i.e. βCav1.2–/– mice) and control animals (Cav1.2+/L2,RipCre+/tg). Both lines were viable and showed no gross abnormalities. Genotyping was performed using primers VI4 (5′-TGGCCCCTAAGCAATGA-3′), VI8 (5′-AGGGGTGTTCAGAGCAA-3′) and VI10 (5′-CCCCAGCCAA TAGAATGCCAAT-3′). The background mouse strain was C57BL/6.
Isolation of pancreatic islets
Mice (3–4 months old) were killed by cervical dislocation, the pancreas quickly excised and pancreatic islets isolated by standard collagenase digestion (Salehi et al., 1999). The surgical procedures used in the in vitro and in vivo studies were approved by the ethical committee at Lund University, the Regierung von Oberbayern or by the Veterinary Office of the canton of Geneva.
DNA isolation from islets and PCR analysis
Islets were digested for 5 min at 55°C in 19 µl of buffer containing 50 mM Tris pH 8.0, 20 mM NaCl, 1 mM EDTA, 1% SDS and 1 mg/ml proteinase K. Proteinase K was subsequently inactivated by increasing the temperature of the digest to 95°C for 5 min. The digest (0.1 µl) was taken for PCR analysis using the Cav1.2-specific primers VI4, VI8 and VI10.
RT–PCR on mRNA of islets
Freshly prepared islets were cultured overnight in RPMI 1640 medium (Gibco™) at 37°C. PolyA mRNA was isolated using Dynabeads Oligo (dT)25 (Dynal Biotech, Oslo, Norway). The following buffers were used: GTC buffer [4 M guanidine thiocyanate, 20 mM Na acetate pH 5.4, 0.1 mM DTT, 0.5% lauroyl sarcosinat (w/v), 6.5 µl/ml mercaptoethanol], binding buffer (100 mM Tris–HCl pH 8.0, 20 mM EDTA, 400 mM LiCl) and washing buffer (10 mM Tris–HCl pH 8.0, 0.15 M LiCl, 1 mM EDTA). The mRNA was eluted with DEPC-treated water. Random hexamer primers and Superscript Reverse Transkriptase II (Life Technologies) were used for cDNA synthesis. The following primers were used: for amplifying Cav1.2 (E13 5′-ACAGCCAATAAAG CCCTCCT-3′ and Lef 1 5′-GGCTTCTCCATCACCTCCTGTT-3′), for HPRT (QG 197 5′-GTAATGATCAGTCAACGGGGGAC-3′ and QG 198 5′-CCAGCAAGCTTGCAACCTTAACCA-3′).
Western blot analysis
Approximately 900 islets of control and βCav1.2–/– mice were cultured in RPMI 1640 for 48 h at 37°C. Thereafter, the islets were homogenized after one freeze–thaw cycle in a hypotonic buffer (20 mM K2HPO4/KH2PO4 pH 7.2, 1 mM EDTA) containing protease inhibitors [1 mM benzamidine, 0.1 mM PMSF and Protease Inhibitor Cocktail (1:500; Sigma)]. The homogenates (40 µg protein) were separated on an 11% SDS–PAGE (lower crosslinking with 0.2% bis-acrylamide). Peptides were blotted on a PVDF membrane (Millipore) and probed with a Cav1.2- (Chemicon) and a panCav-specific antibody (Calbiochem). Equal loading of the slots was ascertained using a monoclonal β-actin antibody (Abcam). Antibodies were visualized by the ECL system (NEN).
Glucose and insulin measurements
In the in vivo studies, glucose [11.1 mmol (equal to 2 g)/kg body weight] was dissolved in 0.9% NaCl and delivered by intraperitoneal injection. Blood sampling, detection of plasma insulin by RIA and enzymatic determination of plasma glucose concentrations were performed as described previously (Salehi et al., 1999). In situ pancreatic perfusions were performed as detailed in Maechler et al. (2002), except that the basal and stimulatory glucose concentrations in the perfusate were 1 and 10 mM, respectively. Insulin release in vitro was measured in batch incubations. Briefly, freshly isolated islets were pre-incubated for 30 min at 37°C in a Krebs–Ringer bicarbonate buffer pH 7.4 supplemented with 7 mM glucose, 10 mM HEPES and 0.1% bovine serum albumin, and gassed with 95% O2 and 5% CO2. Groups of 10 islets were then incubated in 1 ml for 60 min at 37°C in KRB supplemented with glucose and nifedipine as specified. Total insulin islet content was determined by extraction with acidic ethanol and insulin was assayed by RIA.
Electrophysiology
Isolated islets (see above) were dissociated into single cells by shaking in Ca2+-free medium. Insulin-secreting β cells and glucagon-producing α cells were identified electrophysiologically by the absence and presence, respectively, of Na+ currents at physiological membrane potentials (Barg et al., 2000). The measurements were conducted using an EPC-7 patch–clamp amplifier in conjunction with the software Pulse (version 8.53; HEKA Elektronik, Lambrecht/Pfalz, Germany). Whole-cell Ca2+ currents and glucose-induced electrical activity were recorded from metabolically intact cells using the perforated-patch whole-cell approach (Renström et al., 1996). Exocytosis was monitored using standard whole-cell measurements that allow control of the cytosol, by recordings of cell capacitance using the sine+DC mode of the lock-in amplifier included in the Pulse software suite. The extracellular bath solution contained (in mM) 138 NaCl, 5.6 KCl, 2.6 CaCl2, 1.2 MgCl2, 5 glucose (unless otherwise indicated) and 5 HEPES (pH 7.4 with NaOH). For the recordings of the whole-cell Ca2+ currents, 20 mM NaCl was equimolarly replaced by the K+ channel blocker TEA-Cl. The pipette solution in the perforated-patch recordings of membrane potential contained (in mM) 76 K2SO4, 10 NaCl, 10 KCl, 1 MgCl2, 5 HEPES (pH 7.35 with KOH) and 0.24 mg/ml amphotericin B (Renström et al., 1996). For the whole-cell Ca2+ current recordings, the K+ salts in the pipette solution were replaced by the corresponding Cs+ salts. The intracellular medium used in the capacitance measurements consisted of (in mM): 125 Cs glutamate, 10 CsCl, 10 NaCl, 1 MgCl2, 5 HEPES, 3 Mg ATP, 0.1 cAMP and 0.05 EGTA (pH 7.2 with CsOH). The dihydropyridines nifedipine, isradipine (Pfizer) and BayK8644 were prepared as stock solutions in DMSO (final concentration ≤0.1%). The R-type blocker SNX482 (Peptide Institute Inc., Osaka, Japan) was dissolved directly in the extracellular medium. All other reagents were from Sigma. Effects of agonists and antagonists were determined in the steady state. The bath (∼1.5 ml) was continuously perfused (6 ml/min) and the temperature maintained at ∼32°C.
Microfluorimetry
[Ca2+]i in intact pancreatic islets was measured by dual-wavelength microfluorimetry using fura-2 and a D104 PTI microfluorimetry system (Monmouth Junction, NJ). The temperature of the experimental chamber was +32°C. Procedures for loading and calibration of the fluorescence signal were as detailed in Olofsson et al. (2002).
Data analysis
Data are given as mean values ± SEM. Statistical significances were evaluated by either ANOVA followed by Dunnet’s ad hoc tests for unpaired comparisons, or by paired Student’s t-test when comparing data obtained in the same cell.
Acknowledgments
Acknowledgements
We thank Mrs K.Borglid, Mrs B-M.Nilsson and Mrs S.Paparisto for expert technical assistance. and Dr Cecilia Lindgren for help with diabetes genetics. Supported by the JDRF, the Swedish Research Council (grant nos 08647, 13509, 12234), the Swedish Diabetes Association, the NovoNordisk Foundation, the European Commission (HPRN-CT-2000-00082), the Deutsche Forschungsgemeinschaft, Fond der Chemischen Industrie, Swiss National Science Foundation (grant no 32-66907.01) and the Swiss Federal Office for Education and Science (grant no 01.0260).
References
- Ashcroft F.M. and Rorsman,P. (1989) Electrophysiology of the pancreatic β-cell. Prog. Biophys. Mol. Biol., 54, 87–143. [DOI] [PubMed] [Google Scholar]
- Atwater I., Dawson,C.M., Ribalet,B. and Rojas,E. (1979) Potassium permeability activated by intracellular calcium ion concentration in the pancreatic β cell. J. Physiol., 288, 575–588. [PMC free article] [PubMed] [Google Scholar]
- Barg S., Galvanovskis,J., Göpel,S., Rorsman,P. and Eliasson,L. (2000) Tight coupling between electrical activity and exocytosis in mouse glucagon-secreting α-cells. Diabetes, 49, 1500–1510. [DOI] [PubMed] [Google Scholar]
- Barg S. et al. (2001) Fast exocytosis with few Ca2+ channels in insulin-secreting mouse pancreatic B cells. Biophys. J., 81, 3308–3323. [DOI] [PMC free article] [PubMed] [Google Scholar]
- Barg S., Eliasson,L., Renström,E. and Rorsman,P. (2002) A subset of 50 secretory granules in close contact with l-type ca2+ channels accounts for first-phase insulin secretion in mouse β-Cells. Diabetes, 51, S74–S82. [DOI] [PubMed] [Google Scholar]
- Bokvist K., Eliasson,L., Ämmälä,C., Renström,E. and Rorsman,P. (1995) Co-localization of L-type Ca2+ channels and insulin-containing secretory granules and its significance for the initiation of exocytosis in mouse pancreatic B-cells. EMBO J., 14, 50–57. [DOI] [PMC free article] [PubMed] [Google Scholar]
- Bratanova-Tochkova T.K. et al. (2002) Triggering and augmentation mechanisms, granule pools, and biphasic insulin secretion. Diabetes, 51, S83–S90. [DOI] [PubMed] [Google Scholar]
- Curry D.L., Bennett,L.L. and Grodsky,G.M. (1968) Dynamics of insulin secretion by the perfused rat pancreas. Endocrinology, 83, 572–584. [DOI] [PubMed] [Google Scholar]
- Eliasson L., Renstrom,E., Ding,W.G., Proks,P. and Rorsman,P. (1997) Rapid ATP-dependent priming of secretory granules precedes Ca2+-induced exocytosis in mouse pancreatic B-cells. J. Physiol., 503, 399–412. [DOI] [PMC free article] [PubMed] [Google Scholar]
- Gilon P., Yakel,J., Gromada,J., Zhu,Y., Henquin,J.C. and Rorsman P. (1997) G protein-dependent inhibition of L-type Ca2+ currents by acetylcholine in mouse pancreatic B-cells. J. Physiol., 499, 65–76. [DOI] [PMC free article] [PubMed] [Google Scholar]
- Hager J. et al. (1998) A genome-wide scan for human obesity genes reveals a major susceptibility locus on chromosome 10. Nat. Genet., 20, 304–308. [DOI] [PubMed] [Google Scholar]
- Henquin J.C. and Meissner,H.P. (1984) Significance of ionic fluxes and changes in membrane potential for stimulus–secretion coupling in pancreatic β-cells. Experientia, 40, 1043–1052. [DOI] [PubMed] [Google Scholar]
- Imperatore G., Hanson,R.L., Pettitt,D.J., Kobes,S., Bennett,P.H. and Knowler,W.C. (1998) Sib-pair linkage analysis for susceptibility genes for microvascular complications among Pima Indians with type 2 diabetes. Pima Diabetes Genes Group. Diabetes, 47, 821–830. [DOI] [PubMed] [Google Scholar]
- Ji J,. Yang,S.N., Huang,X., Li,X., Sheu,L., Diamant,N., Berggren,P-O. and Gaisano,H.Y. (2002) Modulation of L-type Ca2+ channels by distinct domains within SNAP-25. Diabetes, 51, 1425–1436. [DOI] [PubMed] [Google Scholar]
- Larsson-Nyrén G., Sehlin,J., Rorsman,P. and Renstrom,E. (2001) Perchlorate stimulates insulin secretion by shifting the gating of L-type Ca2+ currents in mouse pancreatic B-cells towards negative potentials. Pflugers Arch., 441, 587–595. [DOI] [PubMed] [Google Scholar]
- Lindgren C.M. et al. (2002) Contribution of known and unknown susceptibility genes to early-onset diabetes in Scandinavia: evidence for heterogeneity. Diabetes, 51, 1609–1617. [DOI] [PubMed] [Google Scholar]
- Maechler P. and Wollheim,C.B. (2001) Mitochondrial funtion in normal and diabetic β-cells Nature, 414, 807–812. [DOI] [PubMed] [Google Scholar]
- Maechler P., Gjinovci,A. and Wollheim,C.B. (2002) Implication of glutamate in the kinetics of insulin secretion in rat and mouse perfused pancreas. Diabetes, 51, (Suppl. 1), S99–S102. [DOI] [PubMed] [Google Scholar]
- McCarthy M.I. and Froguel,P. (2002) Genetic approaches to the molecular understanding of type 2 diabetes. Am. J. Physiol. Endocrinol. Metab., 283, E217–E225. [DOI] [PubMed] [Google Scholar]
- Nagamatsu S., Nakamichi,Y., Yamamura,C., Matsushima,S., Watanabe,T., Ozawa,S., Furukawa,H. and Ishida,H. (1999) Decreased expression of t-SNARE, syntaxin 1, and SNAP-25 in pancreatic β-cells is involved in impaired insulin secretion from diabetic GK rat islets: restoration of decreased t-SNARE proteins improves impaired insulin secretion. Diabetes, 48, 2367–2373. [DOI] [PubMed] [Google Scholar]
- Namkung Y. et al. (2001) Requirement for the L-type Ca2+ channel α1D subunit in postnatal pancreatic β cell generation. J. Clin. Invest., 108, 1015–1022. [DOI] [PMC free article] [PubMed] [Google Scholar]
- Neher E. (1998) Vesicle pools and Ca2+ microdomains: new tools for understanding their roles in neurotransmitter release. Neuron, 20, 389–399. [DOI] [PubMed] [Google Scholar]
- Norman R.A. et al. (1998) Autosomal genomic scan for loci linked to obesity and energy metabolism in Pima Indians Am. J. Hum. Genet., 62, 659–668. [DOI] [PMC free article] [PubMed] [Google Scholar]
- Olofsson C.S., Göpel,S.O., Barg,S., Galvanovskis,J., Ma,X., Salehi,A., Rorsman,P. and Eliasson,L. (2002) Fast insulin secretion reflects exocytosis of docked granules in mouse pancreatic B-cells. Pflugers Arch., 444, 43–51. [DOI] [PubMed] [Google Scholar]
- Parker A. et al. (2001) A gene conferring susceptibility to type 2 diabetes in conjunction with obesity is located on chromosome 18p11. Diabetes, 50, 675–680. [DOI] [PubMed] [Google Scholar]
- Pereverzev A., Vajna,R., Pfitzer,G., Hescheler,J., Klockner,U. and Schneider,T. (2002) Reduction of insulin secretion in the insulinoma cell line INS-1 by overexpression of a Cav2.3 (α1E) calcium channel antisense cassette. Eur. J. Endocrinol. 146, 881–889. [DOI] [PubMed] [Google Scholar]
- Postic C. et al. (1999) Dual roles for glucokinase in glucose homeostasis as determined by liver and pancreatic β cell-specific gene knockouts using Cre recombinase. J. Biol. Chem., 274, 305–315. [DOI] [PubMed] [Google Scholar]
- Pratley R.E. et al. (1998) An autosomal genomic scan for loci linked to prediabetic phenotypes in Pima Indians. J. Clin. Invest., 101, 1757–1764. [DOI] [PMC free article] [PubMed] [Google Scholar]
- Reetz A., Solimena,M., Matteoli,M., Folli,F., Takei,K. and De Camilli,P. (1991) GABA and pancreatic β cells: colocalization of glutamic acid decarboxylase (GAD) and GABA with synaptic-like microvesicles suggests their role in GABA storage and secretion. EMBO J., 10, 1275–1284. [DOI] [PMC free article] [PubMed] [Google Scholar]
- Regazzi R. et al. (1995) VAMP-2 and cellubrevin are expressed in pancreatic β-cells and are essential for Ca2+- but not for GTPγS-induced insulin secretion. EMBO J., 14, 2723–2730. [DOI] [PMC free article] [PubMed] [Google Scholar]
- Renström E., Eliasson,L., Bokvist,K. and Rorsman,P. (1996) Cooling inhibits exocytosis in single mouse pancreatic B-cells by suppression of granule mobilization. J. Physiol., 494, 41–52. [DOI] [PMC free article] [PubMed] [Google Scholar]
- Ribalet B. and Beigelman,P.M. (1981) Effects of divalent cations on β-cell electrical activity. Am. J. Physiol., 241, 59–67. [DOI] [PubMed] [Google Scholar]
- Rosario L.M., Barbosa,R.M., Antunes,C.M., Silva,A.M., Abrunhosa,C.M. and Santos,R.M. (1993) Bursting electrical activity in pancreatic β-cells: evidence that the channel underlying the burst is sensitive to Ca2+ influx through L-type Ca2+ channels. Pflugers Arch., 424, 439–447. [DOI] [PubMed] [Google Scholar]
- Salehi A., Chen,D., Håkansson,R., Nordin,G. and Lundquist,I. (1999) Gastrectomy induces impaired insulin and glucagon secretion: evidence for a gastro-insular axis in mice. J. Physiol., 514, 579–593. [DOI] [PMC free article] [PubMed] [Google Scholar]
- Seisenberger C. et al. (2000) Functional embryonic cardiomyocytes after disruption of the L-type α1C (Cav1.2) calcium channel gene in the mouse. J. Biol. Chem., 275, 39193–3999. [DOI] [PubMed] [Google Scholar]
- Takahashi N., Kadowaki,T., Yazaki,Y., Miyashita,Y. and Kasai,H. (1997) Multiple exocytotic pathways in pancreatic β cells. J. Cell Biol., 138, 55–64. [DOI] [PMC free article] [PubMed] [Google Scholar]
- Tsunoda K., Sanke,T., Nakagawa,T., Furuta,H. and Nanjo,K. (2001) Single nucleotide polymorphism (D68D, T to C) in the syntaxin 1A gene correlates to age at onset and insulin requirement in Type II diabetic patients. Diabetologia, 44, 2092–2097. [DOI] [PubMed] [Google Scholar]
- UKPDS16 (United Kingdom Prospective Diabetes Study Group) (1995) Overview of 6 years therapy of type II diabetes: a progressive disease (UKPDS16). Diabetes, 44, 1249–1258. [PubMed] [Google Scholar]
- Vajna R. et al. (2001) Functional coupling between ‘R-type’ Ca2+ channels and insulin secretion in the insulinoma cell line INS-1. Eur. J. Biochem., 268, 1066–1075. [DOI] [PubMed] [Google Scholar]
- Wang W., Xu,J. and Kirsch,T. (2002) Annexin-mediated Ca2+ influx regulates growth plate chondrocyte maturation and apoptosis. J. Biol. Chem., in press. [DOI] [PubMed] [Google Scholar]
- Wiser O., Trus,M., Hernandez,A., Renström,E., Barg,S., Rorsman,P. and Atlas,D. (1999) The voltage sensitive Lc-type Ca2+ channel is functionally coupled to the exocytotic machinery. Proc. Natl Acad. Sci. USA., 96, 248–253. [DOI] [PMC free article] [PubMed] [Google Scholar]
- Yang S.N. et al. (1999) Syntaxin 1 interacts with the L(D) subtype of voltage-gated Ca2+ channels in pancreatic β cells. Proc. Natl Acad. Sci. USA, 96, 10164–10169. [DOI] [PMC free article] [PubMed] [Google Scholar]
- Zhang W., Khan,A., Östenson,C-G., Berggren,P-O., Efendic,S. and Meister,B. (2002) Down-regulated expression of exocytotic proteins in pancreatic islets of diabetic GK rats. Biochem. Biophys. Res. Commun., 291, 1038–1044. [DOI] [PubMed] [Google Scholar]