Abstract
Systematic studies on the hybridization of fluorescently labeled, rRNA-targeted oligonucleotides have shown strong variations in in situ accessibility. Reliable predictions of target site accessibility would contribute to more-rational design of probes for the identification of individual microbial cells in their natural environments. During the past 3 years, numerous studies of the higher-order structure of the ribosome have advanced our understanding of its spatial conformation. These studies range from the identification of rRNA-rRNA interactions based on covariation analyses to physical imaging of the ribosome for the identification of protein-rRNA interactions. Here we reevaluate our Escherichia coli 16S rRNA in situ accessibility data with regard to a tertiary-structure model of the small subunit of the ribosome. We localized target sequences of 176 oligonucleotides on a 3.0-Å-resolution three-dimensional (3D) model of the 30S ribosomal subunit. Little correlation was found between probe hybridization efficiency and the proximity of the probe target region to the surface of the 30S ribosomal subunit model. We attribute this to the fact that fluorescence in situ hybridization is performed on fixed cells containing denatured ribosomes, whereas 3D models of the ribosome are based on its native conformation. The effects of different fixation and hybridization protocols on the fluorescence signals conferred by a set of 10 representative probes were tested. The presence or absence of the strongly denaturing detergent sodium dodecyl sulfate had a much more pronounced effect than a change of fixative from paraformaldehyde to ethanol.
Fluorescence in situ hybridization (FISH) with rRNA-targeted oligonucleotide probes has become a commonly used technique for the direct identification of individual cells in applied and environmental microbiology (2, 10). Low probe-conferred fluorescence is a common problem in FISH. In addition to cellular ribosome content and cell wall permeability, the FISH signal depends on the accessibility of the rRNA target site to the fluorescently labeled oligonucleotide. Due to the densely packed three-dimensional (3D) structure of the ribosome, probe access to target sites may be hindered by rRNA-rRNA interactions as well as by interactions of the rRNAs with ribosomal proteins (3, 26).
One of the first experimental attempts to consider target site-specific effects in the design of rRNA-targeted oligonucleotide probes for FISH applications was published by Frischer et al. in 1996 (11). Four additional systematic studies addressing the in situ accessibility of rRNA to fluorescently labeled oligonucleotide probes have since been published. In 1998, Fuchs et al. quantified the fluorescence signals conferred by 171 carboxyfluorescein-labeled oligonucleotides targeting the 16S rRNA of Escherichia coli (14). Three years later, a study was published on the in situ accessibility of the 23S rRNA of E. coli for Cy3-labeled oligonucleotide probes (13). Recently (in 2003), Inãcio et al. studied the in situ accessibility of the D1/D2 domains of the 26S rRNA of Saccharomyces cerevisiae to Cy3-labeled oligonucleotide probes (17). Also in 2003, Behrens and coworkers reexamined the 16S rRNA accessibility of E. coli to Cy3-labeled oligonucleotides and compared it to results obtained for the bacterium Pirellula sp. strain 1, the archaeon Metallosphaera sedula, and the 18S rRNA of the yeast S. cerevisiae (4).
During the past 3 years, major breakthroughs in the determination of atomic-resolution ribosome structures have been made. The structure of the 50S subunit from Haloarcula marismortui has been solved to 2.4 Å resolution (3), and Harms et al. in 2001 presented the 3.1-Å-resolution structure of the large ribosomal subunit from Deinococcus radiodurans (16). Two high-resolution structures have appeared for the 30S subunit from Thermus thermophilus, one from the Yonath group at 3.3 Å resolution (23) and the other from the Ramakrishnan group at 3.0 Å resolution (26). In 2002, Tung and coworkers modeled the all-atom structure of the E. coli 30S ribosomal subunit by using the T. thermophilus structure as a template (24). In the present study, we use a computer-generated atomic-homology model of the E. coli 30S ribosomal subunit produced by F. Mueller and R. Brimacombe (unpublished data) based on the 3.0 Å structure of T. thermophilus (26).
Until now, data from the in situ accessibility studies have not been systematically evaluated with respect to the currently available models of the 3D structure of the ribosome. Here we compare the E. coli 16S rRNA in situ accessibility for Cy3-labeled oligonucleotides with a 3D-structure model of the 30S ribosomal subunit. This comparison is complicated by the fact that the in situ accessibility studies were performed on paraformaldehyde (PFA)-fixed cells, whereas structure analysis is done on native ribosomal subunits. Therefore, studies were performed on the influence of different fixation methods and hybridization procedures on the 16S rRNA in situ accessibility of E. coli for 10 representative Cy3-labeled oligonucleotide probes.
MATERIALS AND METHODS
Microorganisms and fixation.
E. coli strain K-12, DSM 30083T (Deutsche Sammlung von Mikroorganismen und Zellkulturen, Braunschweig, Germany), was grown as recommended by the strain collection. Cells were harvested in the exponential-growth phase (optical density at 600 nm, ∼0.5) and washed once with 1× phosphate-buffered saline (130 mM sodium chloride-10 mM sodium phosphate buffer [pH 7.2]) (1× PBS). Different fixation methods were used. PFA fixation was carried out as described previously (1). In addition, one batch of PFA-treated cells was stored at 4°C in 1× PBS, not as in the standard protocol at −20°C in a 1:1 mixture of 1× PBS and absolute ethanol. For ethanol fixation, 1 volume of cells resuspended in 1× PBS was mixed with 1 volume of cold absolute ethanol. The cells were first incubated at 4°C for 16 h and then stored at −20°C.
Probe design, labeling, and quality control.
The oligonucleotide probes used were those reported by Behrens et al. (4). All are fully complementary to 16S rRNA sequences of E. coli. The standard length was 18 nucleotides. Each probe was synthesized, monolabeled at the 5′ end with Cy3 [5,5′-disulfo-1,1′-(-γ-carbopentynyl)-3,3,3′,3′-tetramethylindolocarbocyanin-N-hydroxysuccinimidester] in the last step of solid-phase synthesis, and purified by high-performance liquid chromatography by ThermoHybaid Interactiva Division GmbH (Ulm, Germany). Since differences in the quality of labeling directly influenced the amount of probe-conferred fluorescence (data not shown), aliquots of each probe were analyzed in a model DU530 spectrophotometer (Beckmann, Munich, Germany) and estimated as described by Fuchs et al. (14). A list containing all E. coli probes used in this study is provided as supplementary material (http://www.mpi-bremen.de/∼sbehrens). Different fixation methods were compared for the following probes: Eco262, Eco298, Eco585, Eco621, Eco645, Eco800, Eco889, Eco1428, Eco1464, and Eco1509.
FISH.
Approximately 108 fixed cells were hybridized in 100 μl of a buffer containing 0.9 M sodium chloride, 0.01% sodium dodecyl sulfate (SDS), 20 mM Tris-HCl (pH 8.4), and 1.5 ng of the fluorescent probe μl−1 at 46°C for 3 h (25). Alternatively, hybridizations were performed without SDS in the hybridization buffer. After 3 h of incubation, cells were pelleted by centrifugation for 3 min at 4,000 × g and resuspended in 100 μl of hybridization buffer containing no probe. Cells were washed for 30 min at 46°C. For flow cytometric analysis, samples were mixed with 200 μl of 1× PBS (pH 8.4), immediately placed on ice, and analyzed within 3 h.
Flow cytometry.
The fluorescence intensities of hybridized cells were quantified by a MoFlow flow cytometer (Cytomation Inc., Fort Collins, Colo.). The 514-nm emission line of an argon ion laser was used as a light source and tuned to an output power of 500 mW. Forward angle light scatter (FSC) was detected with a 530 (±20)-nm (Cytomation, Inc.) band-pass filter. Fluorescence was detected with a 570 (±20)-nm band-pass filter (Cytomation, Inc.). All measurements were calibrated to polychromatic, 0.5-μm-diameter polystyrene beads (Polysciences, Warrington, Pa.) to check the stability of the optical alignment of the flow cytometer and to standardize the fluorescence intensities of the probes.
Data acquisition and processing.
The parameters FSC, side angle light scatter (SSC), and fluorescence (FL1) were recorded as pulse height signals (4 decades in logarithmic scale each), and for each measurement 10,000 events were stored in list mode files. Subsequent analysis was done with the Summit software (Cytomation, Inc.). Probe-conferred fluorescence was determined as the median of the FL1 values of single cells lying in a gate that was defined in an FSC-versus-FL1 dot plot. Probe-conferred fluorescence intensities of triplicate samples were recorded. Each replicate represented an independent cell hybridization. Only triplicates with a coefficient of variation (CV) of <10% were accepted; otherwise, the quantification was repeated. No standard deviations are given, since the CV in all cases was <10%.
Fluorescence of cells was corrected by subtraction of background fluorescence of negative controls (Non338) and standardized to the fluorescence of reference beads.
rRNA models.
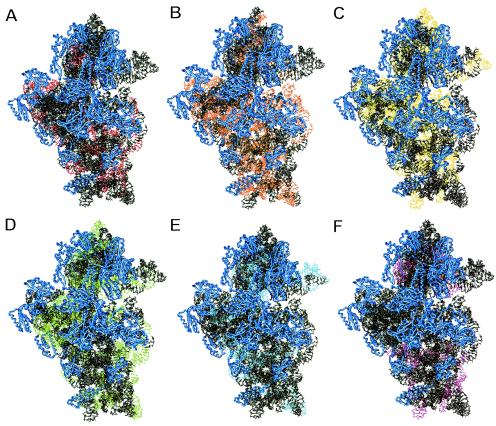
The model for the 3D structure of the E. coli 16S rRNA was an atomic-homology model (Mueller and Brimacombe, unpublished) based on the 3.0-Å-resolution structure of T. thermophilus 16S rRNA (26) and constructed in a manner similar to that of the E. coli model described by Tung et al. (24). All of the figures in this article showing 3D models of the ribosome were generated by using the ERNA-3D (Editor for RNA in 3D) program (19-21). The 16S rRNA target sites of the probes are shown color-coded according to the six arbitrary brightness classes defined by Fuchs et al. (14) and Behrens et al. (4). Because nontarget regions are shown in black and ribosomal proteins are shown in blue, light blue instead of blue was chosen for class V probes, and magenta replaced black for probes grouped into class VI (see Fig. 1).
FIG. 1.
Target sequences of fluorescently labeled oligonucleotide probes are shown within a 3D structure model of the 30S ribosomal subunit of E. coli. Ribosomal proteins are shown in blue. Red (A), orange (B), yellow (C), green (D), light blue (E), and magenta (F) indicate target sequences belonging to probe brightness classes I (highest fluorescence signal) to VI (lowest fluorescence signal), respectively, defined in the study of Behrens et al. (4).
RESULTS AND DISCUSSION
We visualized all 176 target sequences of the probes investigated by Behrens et al. within a 3D model of the small ribosomal subunit (4). After normalization of the measured fluorescence values, Behrens et al. (4) grouped the probes according to their relative fluorescence hybridization signals into six arbitrary classes of brightness (relative fluorescence intensity): class I (>0.81; brightest class), class II (0.8 to 0.61), class III (0.6 to 0.41), class IV (0.4 to 0.21), class V (0.2 to 0.06), and class VI (0.05 to 0; least bright class) (14). Figure 1 shows the probe target sequences on a spatial model of the 30S ribosomal subunit. Probes grouped into class I apparently have relatively unhindered access to their target sequence, whereas probes grouped into class VI demonstrate examples of inaccessible binding sites. The six groups all seem to be quite evenly distributed over the 3D-structure model of the small ribosomal subunit (4). Neither a clustering of highly accessible sites on the surface nor a predominance of less accessible sites within the small subunit or at the small-large subunit interface is evident (Fig. 1). Based on the assumption that the highest conservation is found at the tertiary-structure level of rRNA (24), the low correlation of the data sets examined by Behrens et al. (4) had already suggested that in situ accessibility does not depend exclusively on a probe target site location inside or outside of the ribosome, i.e., on the surface or within more densely organized structures of the ribosome.
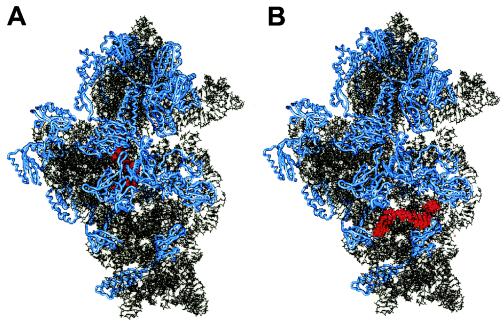
Further detail is shown for one relatively accessible and one inaccessible region. The target region of the class I probe Eco907 (positions 907 to 925) (Fig. 2A) comprises the 5′ end of helix 30, helix 2, and the 3′ end of helix 31 (helix numbering according to the work of Brosius et al. [7]). According to the 3D model, this region is fairly deep within the small subunit and is covered by ribosomal proteins S5 and S12. Probe Eco907 is located at the center of what has been identified as a conformational switch in the E. coli 16S rRNA (18). Other examples of class I probes that target deep regions covered by ribosomal proteins are Eco20 (S5 and S8), Eco378 (S16), and Eco1176 (S2, S7, S9, and S13). In contrast, the target site of probe Eco621 (positions 621 to 638) (Fig. 2B) is nearly free from any hindrance by ribosomal proteins and is located directly on the outside of the small ribosomal subunit. Nevertheless, hybridization of probe Eco621 (class VI) is strongly hindered. This blocking does not occur only in E. coli; rather, helix 22 seems to be fairly inaccessible throughout all three domains of life (4).
FIG. 2.
3D structure model of the 30S ribosomal subunit of E. coli. (A) The target region of class I probe Eco907 (positions 907 to 925) is shown in red; it comprises the 5′ end of helix 30, helix 2, and the 3′ end of helix 31 (helix numbering according to the work of Brosius et al. [7]). (B) Highlighted in red is the target region of class VI probe Eco621 (positions 621 to 638), corresponding to the loop region of helix 22. Proteins are shown in blue.
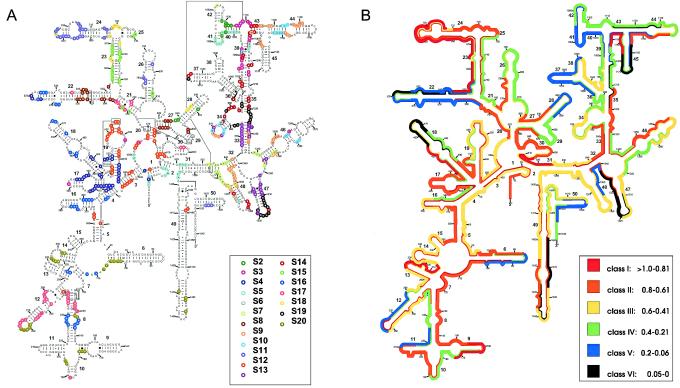
For better illustration of the in situ accessibility data of Behrens et al. (4) in the context of the complex interactions observed in the 3D-structure model, we visualized the RNA interactions with ribosomal proteins on a secondary-structure diagram (Fig. 3). The protein interaction data used were originally obtained by study of the crystal structure of the 30S ribosomal subunit of T. thermophilus (6). Based on sequence alignment, the T. thermophilus data were transferred to a 16S rRNA secondary-structure model for E. coli (Fig. 3A) (24). The contacts between the ribosomal proteins and RNA are quite equally distributed throughout the 5′, central, and 3′ major domains. The 3′ minor domain, comprising helices 49 and 50, has very few interactions with proteins (6). The only RNA helices in Fig. 3A that have no protein interactions are helices 11, 15, and 38 (numbering according to the work of Brosius et al. [7]). Nevertheless, probe binding is hindered on the 3′ half of helix 11, as well as on the 5′ half of helix 38 (brightness class V) (Fig. 3B). On the other hand, regions with many RNA-protein interactions, such as helix 17 or the 5′ end of helix 23, were highly accessible. There is little correlation between the in situ accessibility of probe target regions (Fig. 3B) and the extent of interaction of these sites with ribosomal proteins (Fig. 3A). The average number of nucleotides with protein interactions is not significantly different for the six brightness classes (see the supplementary material, available at www.mpi-bremen.de/∼sbehrens).
FIG. 3.
Predicted secondary structures of E. coli 16S rRNA (9). Numbers attached to nucleotides indicate sequence numbering; boldfaced numbers indicate helix numbering according to the work of Brosius et al. (7). (A) Regions of the 16S rRNA of E. coli contacted by the ribosomal proteins S2 to S20 are highlighted. Proteins S1 and S21 are not included. Actual contacts as observed in the crystal structure of the 30S ribosomal subunit of T. thermophilus are shown with colored circles around the RNA residues in question. No distinction was made between backbone-only contacts, base-only contacts, and contacts with both the backbone and the base. (B) Distribution of relative fluorescence hybridization intensities of 176 oligonucleotide probes targeting the 16S rRNA of E. coli. The different colors indicate different brightness classes, as explained in the key.
Thus, the 3D model cannot explain the differences in probe-conferred hybridization signals. This counterintuitive result may be explained by the fact that the flow cytometric quantification of probe-conferred fluorescence signals by Behrens et al. (4) was done on PFA-fixed cells. Upon treatment with PFA, ribosomes most probably undergo massive conformational changes, including protein denaturation. Formaldehyde is also able to form Schiff bases with the primary amino groups of adenine, guanine, and cytosine, thereby influencing RNA-RNA interactions. Interestingly, the native ribosomal subunits have been described as relatively inaccessible to oligonucleotide hybridization. Bogdanov et al. tried to identify rRNA regions located on the surfaces of ribosomal subunits by binding DNA oligonucleotides to the rRNA (5). Binding sites were identified by RNase H hydrolysis. Although the accessibility of the large enzyme RNase H to the bound DNA oligonucleotides might be hindered by the 3D structure of the 30S subunit in some cases, Bogdanov et al. could identify only two regions (positions 8 to 15 and 773 to 782) where oligonucleotides had unhindered access to rRNA in the native 30S ribosomal subunit (5). These regions were also accessible in our study (class II and III probes) (4). The low accessibility of native 30S subunits for oligonucleotide hybridization described by Bogdanov et al. (5) is contradictory to the relatively high number of class I and II target sites (covering 37% of the whole 16S rRNA sequence) found by Behrens et al. (4). We therefore conclude that fixation and hybridization must significantly increase the accessibility of 16S rRNA target sites to probes.
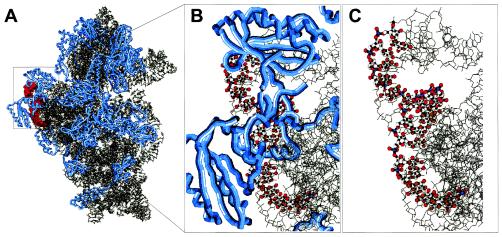
Apart from the changes induced by our FISH protocol, oligonucleotide hybridization itself likely causes massive conformational changes within the ribosome. An 18-mer oligonucleotide has a length of 55 Å (Fig. 4). The double helix formed by an oligonucleotide of that size bound to its rRNA target has a length of more than 1.5 helix turns (Fig. 4C). Taking into account that the 30S subunit has a width of roughly 70 Å, it is clear that hybridization of an 18-mer oligonucleotide must result in enormous distortions of the native ribosome structure. The probe label will contribute to this effect. In line with this, differences in E. coli 16S rRNA in situ accessibility for carboxyfluorescein- and Cy3-labeled oligonucleotides have been reported in a previous study (4). A strong conformational effect of oligonucleotide hybridization was also demonstrated in the study of Fuchs et al. in which unlabeled helper oligonucleotides were successfully used to increase probe-conferred fluorescence signals (12). Inaccessible target sites are likely opened up by conformational changes introduced by hybridization of helper probes (12). This also suggests that a significant proportion of site-specific hindrance may originate in RNA-RNA interactions.
FIG. 4.
Detailed view of the transition zone between the 5′ end of helix 23 and helix 24 (helix numbering according to the work of Brosius et al. [7]) within the 30S ribosomal subunit of E. coli. (A) Overview of the whole 30S subunit, with the region to be shown in large scale highlighted in red. Proteins are depicted as blue tubes. (B) Target region of probe Eco668 (positions 668 to 685) marked as a ball-and-stick model. Blue tubes, ribosomal proteins. (C) Same as panel B but without ribosomal proteins.
Gutell and coworkers compared their comparative structure model with the high-resolution crystal structure of the 30S subunit of T. thermophilus in terms of base-base and base-backbone interactions of the 16S rRNA molecule (15). They transformed all tertiary rRNA interactions of both models onto a secondary-structure diagram of the 16S rRNA of T. thermophilus (data not shown) and found that most of the intramolecular interactions are located in loop regions. Loop regions have higher sequence conservation than helix regions (24) and play an important role in stabilizing the tertiary fold of rRNA. These regions of complex tertiary RNA interactions cannot be linked to target sites of low probe accessibility in a denatured ribosome, confirming that differences in probe-conferred hybridization signals cannot be predicted from 3D models of the native 30S ribosomal subunit. Site-specific hindrance of probe binding on the level of RNA interactions seems to originate more in intrahelix base pairing than in helix-spanning tertiary rRNA interactions. Long, smooth helical regions often show limited accessibility compared with short, irregular helices that are interrupted by unpaired nucleotide bulges (Fig. 3B).
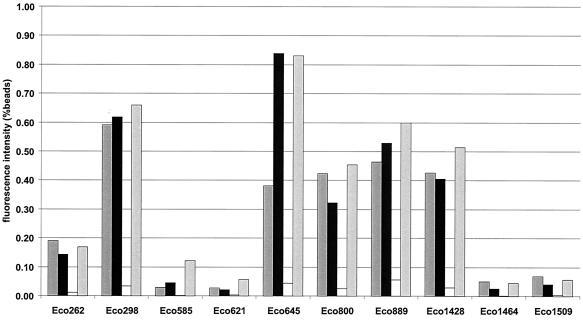
We performed a limited study to test the influence of different fixation protocols, storage of fixed cells, and SDS in the hybridization buffer on probe accessibility. We quantified the probe-conferred fluorescence intensity for 10 Cy3-labeled oligonucleotides after hybridization to differently treated E. coli cells (Fig. 5). With one exception (Eco645), where the fluorescence intensity for ethanol-fixed cells is less than 50% of that for PFA-treated cells, there is no clear difference in probe-mediated fluorescence between ethanol- and PFA-fixed E. coli cells. Nor is there a significant difference between cells kept in a mixture of ethanol and 1× PBS and cells stored in 1× PBS buffer. Ethanol fixation works mainly by dehydration, whereas formaldehyde, the reactive compound in the PFA fixative, is able to form covalent bonds between primary amino groups. We therefore considered the possibility that probe target accessibility might be lower in the vicinity of basic amino acids such as arginine and lysine that contain primary amino groups in their side chains. Basic amino acids are most frequent in loops and long extensions of ribosomal proteins that are buried in the rRNA, reaching deep into the 3D structure of the ribosome (6). Since there are no indications for decreased accessibility of buried target sites, we do not consider formaldehyde-mediated cross-linking of probe target sites with basic amino acids to be an important factor.
FIG. 5.
Comparison of fluorescence intensities of Cy3-labeled oligonucleotide probes hybridized with or without SDS in the hybridization buffer to differently fixed E. coli cells. Fluorescence intensity is expressed as a percentage of that obtained with standard beads. Dark shaded bars, ethanol fixation, storage in an ethanol-1× PBS mixture, and standard hybridization with 0.01% SDS. Solid bars, PFA fixation, storage in an ethanol-1× PBS mixture, and standard hybridization with 0.01% SDS. Open bars, PFA fixation, storage in an ethanol-1× PBS mixture, and hybridization without SDS. Light shaded bars, PFA fixation, storage in 1× PBS, and standard hybridization with 0.01% SDS.
It is hard to determine what causes the strong positive effect of addition of SDS to the hybridization buffer on probe binding. Cell wall permeability, protein removal, and/or ribosome folding might all be affected. In order to optimize FISH for the in situ identification of Archaea, Burggraf et al. varied the SDS concentration in hybridization and washing solutions from 0.01 to 1% to achieve better probe penetration through the more rigid archaeal cell walls (8). Rajagopal and coworkers studied the growth of E. coli in the presence of 10% SDS (22). They found elevated expression of the ATP-dependent proteases ClpP and ClpB, which enable the cell to eliminate denatured and aggregated proteins in the cytoplasm. Apparently, SDS in the growth medium caused protein misfolding in the cytoplasm. Ribosomal proteins make fewer base-specific interactions than other RNA-binding proteins and tend instead to interact through salt bridges between positively charged residues on the protein and phosphate oxygen atoms on the RNA (6). Specific interactions based on shape and charge complementarity will most likely be interrupted in the presence of SDS. This is consistent with our observation that in situ accessibility of the 16S rRNA (4) does not match the rRNA-protein interaction data (6) (Fig. 3).
Our conclusions from this and former studies for rational probe design are as follows. (i) The 3D structure of the native small ribosomal subunit is not relevant to probe accessibility, since FISH is performed in a strongly denaturing environment, although the degree of denaturation can be modulated. (ii) The influence of protein-rRNA interactions on target site accessibility can, for the same reasons, generally be neglected. (iii) Intrahelix, secondary base interactions are more important than tertiary rRNA-rRNA contacts. (iv) If possible, probes should not be targeted to long, smooth helical regions. However, these regions are among the most variable in the 16S rRNA and therefore are of particular interest for the design of specific probes. (v) If targeting these regions is unavoidable, the use of helper probes should be considered (12).
Acknowledgments
We thank Richard Brimacombe (MPI of Molecular Genetics, Berlin, Germany) for helpful discussions on ribosome structure. We thank Barbara MacGregor for critical reading of the manuscript.
This work was supported by grants from the DFG (Am73/3-1), the Fonds der chemischen Industrie, and the Max Planck Society.
REFERENCES
- 1.Amann, R. I., L. Krumholz, and D. A. Stahl. 1990. Fluorescent-oligonucleotide probing of whole cells for determinative, phylogenetic, and environmental studies in microbiology. J. Bacteriol. 172:762-770. [DOI] [PMC free article] [PubMed] [Google Scholar]
- 2.Amann, R. I., W. Ludwig, and K. H. Schleifer. 1995. Phylogenetic identification and in situ detection of individual microbial cells without cultivation. Microbiol. Rev. 59:143-169. [DOI] [PMC free article] [PubMed] [Google Scholar]
- 3.Ban, N., P. Nissen, J. Hansen, P. B. Moore, and T. A. Steitz. 2000. The complete atomic structure of the large ribosomal subunit at 2.4 Å resolution. Science 289:905-920. [DOI] [PubMed] [Google Scholar]
- 4.Behrens, S., C. Rühland, J. Inacio, H. Huber, A. Fonseca, I. Spencer-Martins, B. M. Fuchs, and R. Amann. 2003. In situ accessibility of small subunit ribosomal RNA of members of the domains Bacteria, Archaea, and Eucarya to Cy3-labeled oligonucleotide probes. Appl. Environ. Microbiol. 69:1748-1758. [DOI] [PMC free article] [PubMed] [Google Scholar]
- 5.Bogdanov, A. A., N. V. Chichkova, A. M. Kopylov, A. S. Mankin, and E. A. Skripkin. 1988. Surface topography of ribosomal RNA. Methods Enzymol. 164:440-456. [DOI] [PubMed] [Google Scholar]
- 6.Brodersen, D. E., W. M. Clemons, A. P. Carter, B. T. Wimberly, and V. Ramakrishnan. 2002. Crystal structure of the 30S ribosomal subunit from Thermus thermophilus: structure of the proteins and their interactions with 16S RNA. J. Mol. Biol. 316:725-768. [DOI] [PubMed] [Google Scholar]
- 7.Brosius, J., T. J. Dull, D. D. Sleeter, and H. F. Noller. 1981. Gene organization and primary structure of a ribosomal RNA operon from Escherichia coli. J. Mol. Biol. 148:107-127. [DOI] [PubMed] [Google Scholar]
- 8.Burggraf, S., T. Mayer, R. Amann, S. Schadhauser, C. R. Woese, and K. O. Stetter. 1994. Identifying members of the domain Archaea with rRNA-targeted oligonucleotide probes. Appl. Environ. Microbiol. 60:3112-3119. [DOI] [PMC free article] [PubMed] [Google Scholar]
- 9.Cannone, J. J., S. Subramanian, M. N. Schnare, J. R. Collett, L. M. D'Souza, Y. Du, B. Feng, N. Lin, L. V. Madabusi, K. M. Muller, N. Pande, Z. Shang, N. Yu, and R. R. Gutell. 2002. The Comparative RNA Web (CRW) Site: an online database of comparative sequence and structure information for ribosomal, intron, and other RNAs. BMC Bioinformatics 3:2. [DOI] [PMC free article] [PubMed] [Google Scholar]
- 10.DeLong, E. F., G. S. Wickham, and N. R. Pace. 1989. Phylogenetic stains: ribosomal RNA-based probes for the identification of single microbial cells. Science 243:1360-1363. [DOI] [PubMed] [Google Scholar]
- 11.Frischer, M. E., P. J. Floriani, and S. A. Nierzwicki-Bauer. 1996. Differential sensitivity of 16S rRNA targeted oligonucleotide probes used for fluorescence in situ hybridization is a result of ribosomal higher order structure. Can. J. Microbiol. 42:1061-1071. [DOI] [PubMed] [Google Scholar]
- 12.Fuchs, B. M., F. O. Glöckner, J. Wulf, and R. Amann. 2000. Unlabeled helper oligonucleotides increase the in situ accessibility of 16S rRNA for fluorescently labeled oligonucleotide probes. Appl. Environ. Microbiol. 66:3603-3607. [DOI] [PMC free article] [PubMed] [Google Scholar]
- 13.Fuchs, B. M., K. Syutsubo, W. Ludwig, and R. Amann. 2001. In situ accessibility of the Escherichia coli 23S ribosomal RNA for fluorescently labeled oligonucleotide probes. Appl. Environ. Microbiol. 67:961-968. [DOI] [PMC free article] [PubMed] [Google Scholar]
- 14.Fuchs, B. M., G. Wallner, W. Beisker, I. Schwippl, W. Ludwig, and R. Amann. 1998. Flow cytometric analysis of the in situ accessibility of Escherichia coli 16S rRNA for fluorescently labeled oligonucleotide probes. Appl. Environ. Microbiol. 64:4973-4982. [DOI] [PMC free article] [PubMed] [Google Scholar]
- 15.Gutell, R. R., J. C. Lee, and J. J. Cannone. 2002. The accuracy of ribosomal RNA comparative structure models. Curr. Opin. Struct. Biol. 12:301-310. [DOI] [PubMed] [Google Scholar]
- 16.Harms, J., F. Schluenzen, R. Zarivach, A. Bashan, S. Gat, I. Agmon, H. Bartels, F. Franceschi, and A. Yonath. 2001. High resolution structure of the large ribosomal subunit from a mesophilic eubacterium. Cell 107:679-688. [DOI] [PubMed] [Google Scholar]
- 17.Inácio, J., S. Behrens, B. M. Fuchs, Á. Fonseca, I. Spencer-Martins, and R. Amann. 2003. In situ accessibility of Saccharomyces cerevisiae 26S rRNA to Cy3-labeled oligonucleotide probes comprising the D1/D2 gene domains. Appl. Environ. Microbiol. 69:2899-2905. [DOI] [PMC free article] [PubMed] [Google Scholar]
- 18.Lodmell, J. S., and A. E. Dahlberg. 1997. A conformational switch in Escherichia coli 16S ribosomal RNA during decoding of messenger RNA. Science 277:1262-1267. [DOI] [PubMed] [Google Scholar]
- 19.Mueller, F., and R. Brimacombe. 1997. A new model for the three-dimensional folding of Escherichia coli 16S ribosomal RNA. 1. Fitting the RNA to a 3D electron microscopic map at 20 Å. J. Mol. Biol. 271:524-544. [DOI] [PubMed] [Google Scholar]
- 20.Mueller, F., T. Döring, T. Erdemir, B. Greuer, N. Jünke, M. Osswald, J. Rinke-Appel, K. Stade, S. Thamm, and R. Brimacombe. 1995. Getting closer to an understanding of the three-dimensional structure of ribosomal RNA. Biochem. Cell Biol. 73:767-773. [DOI] [PubMed] [Google Scholar]
- 21.Mueller, F., I. Sommer, P. Baranov, R. Matadeen, M. Stoldt, J. Wohnert, M. Gorlach, M. van Heel, and R. Brimacombe. 2000. The 3D arrangement of the 23S and 5S rRNA in the Escherichia coli 50S ribosomal subunit based on a cryo-electron microscopic reconstruction at 7.5 Å resolution. J. Mol. Biol. 298:35-59. [DOI] [PubMed] [Google Scholar]
- 22.Rajagopal, S., N. Sudarsan, and K. W. Nickerson. 2002. Sodium dodecyl sulfate hypersensitivity of clpP and clpB mutants of Escherichia coli. Appl. Environ. Microbiol. 68:4117-4121. [DOI] [PMC free article] [PubMed] [Google Scholar]
- 23.Schluenzen, F., A. Tocilj, R. Zarivach, J. Harms, M. Gluehmann, D. Janell, A. Bashan, H. Bartels, I. Agmon, F. Franceschi, and A. Yonath. 2000. Structure of functionally activated small ribosomal subunit at 3.3 Å resolution. Cell 102:615-623. [DOI] [PubMed] [Google Scholar]
- 24.Tung, C. S., S. Joseph, and K. Y. Sanbonmatsu. 2002. All-atom homology model of the Escherichia coli 30S ribosomal subunit. Nat. Struct. Biol. 9:750-755. [DOI] [PubMed] [Google Scholar]
- 25.Wallner, G., R. Amann, and W. Beisker. 1993. Optimizing fluorescent in situ-hybridization with rRNA-targeted oligonucleotide probes for flow cytometric identification of microorganisms. Cytometry 14:136-143. [DOI] [PubMed] [Google Scholar]
- 26.Wimberly, B. T., D. E. Brodersen, W. M. Clemons, R. J. Morgan-Warren, A. P. Carter, C. Vonrhein, T. Hartsch, and V. Ramakrishnan. 2000. Structure of the 30S ribosomal subunit. Nature 407:327-339. [DOI] [PubMed] [Google Scholar]


