Abstract
Factors affecting fecal microorganism survival and distribution in the Antarctic marine environment include solar radiation, water salinity, temperature, sea ice conditions, and fecal input by humans and local wildlife populations. This study assessed the influence of these factors on the distribution of presumptive fecal coliforms around Rothera Point, Adelaide Island, Antarctic Peninsula during the austral summer and winter of February 1999 to September 1999. Each factor had a different degree of influence depending on the time of year. In summer (February), although the station population was high, presumptive fecal coliform concentrations were low, probably due to the biologically damaging effects of solar radiation. However, summer algal blooms reduced penetration of solar radiation into the water column. By early winter (April), fecal coliform concentrations were high, due to increased fecal input by migrant wildlife, while solar radiation doses were low. By late winter (September), fecal coliform concentrations were high near the station sewage outfall, as sea ice formation limited solar radiation penetration into the sea and prevented wind-driven water circulation near the outfall. During this study, environmental factors masked the effect of station population numbers on sewage plume size. If sewage production increases throughout the Antarctic, environmental factors may become less significant and effective sewage waste management will become increasingly important. These findings highlight the need for year-round monitoring of fecal coliform distribution in Antarctic waters near research stations to produce realistic evaluations of sewage pollution persistence and dispersal.
Antarctica is the largest pristine wilderness in the world. Nevertheless, Antarctic waters are polluted by sewage waste released from research stations, tourists, and commercial fishing vessels. In Antarctica, fecal coliforms are generated by two sources: local vertebrate populations and human sewage. On a continent-wide scale, fecal material excreted by wildlife far exceeds that produced by humans: estimated summer populations of seals are greater than 8,000,000 in contrast to the human population of around 15,000 (14). Despite this, on a local scale, human sewage can be the dominant source of fecal microorganisms in the marine environment and have a significant environmental impact (32). Although seals and sea birds excrete fecal microorganisms that are closely related to those produced by humans, some strains found in sewage may not be indigenous to Antarctica, having been transported there by humans. Sewage microorganisms have the potential to infect and cause disease or become part of the gut flora of local sea mammal and bird populations as well as fish and marine invertebrates (13, 17). Consequently, it is important to minimize the release of human-derived fecal microorganisms.
Sewage waste produced by the majority of coastal Antarctic research stations is discharged, relatively untreated, into the marine environment. Formal monitoring of the human impact on the Antarctic environment was made mandatory under the Protocol on Environmental Protection to the Antarctic Treaty (3). Since then, several studies have examined the distribution of the sewage plumes released from Antarctic stations (8, 11, 25, 34); however, none has characterized the factors affecting sewage microorganism survival and distribution throughout the year.
Fecal bacterial survival rates can vary from a few minutes to many days depending upon the environmental conditions (44). Physical factors affecting the survival of fecal microorganisms in seawater include solar radiation (16, 27, 28, 39, 43), temperature (37, 41), and salinity (1, 35). In Antarctica some parameters vary dramatically depending upon the season. Under a combination of these environmental stresses, fecal coliform cell death can be accelerated (4, 43, 46).
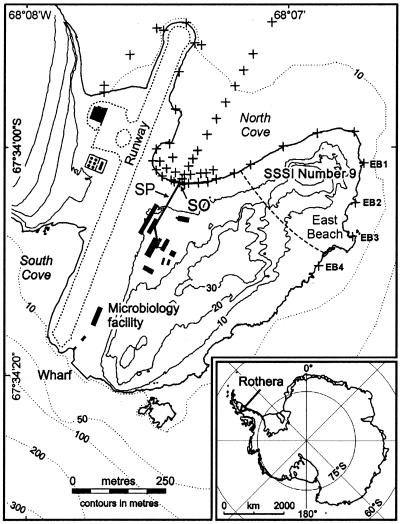
Rothera Research Station is situated on a small rocky promontory at the south end of Adelaide Island on Rothera Point (67°34′S, 68°08′W) (Fig. 1). It provides a living and working environment for up to 140 people during the austral summer season, falling to around 22 in winter. Sewage waste produced on the station is pumped into the shallow (<10 m deep) North Cove. With the exception of maceration, the sewage is untreated and contains food waste, grey water, human waste, and saline water from the desalination plant that supplies the station with potable water. Large transient populations of migrant seals and penguins occupy Rothera Point at certain times of the year and release fecal material into the surrounding sea.
FIG. 1.
Map of Rothera Point showing the position of the seawater sample sites (+), East Beach water sample sites (+, EB1 to EB4), sewage outfall (SO), sewage pipe (SP), and site of special scientific interest (SSSI Number 9).
The isolation of Antarctic research stations and the absence of external anthropogenic influences offer a unique opportunity to analyze the direct influence of wildlife and human populations on the local fecal microorganism distribution. Previous human impact studies at Rothera Point have examined trace metal contamination levels in marine invertebrates (33) and surfactant biodegradation rates (18) at pristine sites and near the sewage outfall. This study aimed to identify the main factors affecting fecal coliform distribution in the Antarctic near-shore marine environment around Rothera Research Station throughout the year.
MATERIALS AND METHODS
The environmental data were collected within the period from September 1998 to May 2000.
Measurement of physical and biological parameters.
Environmental radiation was measured with a double monochromator spectroradiometer (DM150; Bentham Instruments, Reading, United Kingdom) with a scan range of 280 to 600 nm (step, 0.5 nm). This was calibrated to a 1-kW quartz-halogen lamp source traceable to a National Institute of Standards and Technology standard.
The seawater temperature was measured, as part of a long-term marine biology data set in Ryder Bay (67°34′9"S, 68°12′24"W) 1.5 km from Rothera Point, at a depth of 15 m with three digital reversing thermometers (Sensoren Instruments Systeme GmbH, Kiel, Germany). The mean of the three temperature values was recorded. An Aquapac CTD (conductivity, temperature, and depth) device with fluorescence and photosynthetically active radiation (PAR) sensors (Chelsea Instruments, Molesey, Surrey, United Kingdom) measured the chlorophyll a concentration and PAR in the water column. Fluorescence data collected by the CTD were calibrated and corrected to give the average concentration of chlorophyll a in the upper 5 m of the water column. PAR transmission at 5 m was calculated as a percentage of the mean PAR measured within the upper 0.5 m of the water column. The salinity of open seawater, collected at a 0.5-m depth, within North Cove was measured with a handheld refractometer (Topac, Inc., Hingham, Mass.) and expressed as parts per thousand. The spatial variation in salinity was visualized by using ARC-INFO, version 7.2. The local sea ice extent was monitored from the ice ramp immediately to the west of Rothera Point. The sea ice thickness was determined by drilling.
Bird and sea mammal numbers around Rothera Point were recorded daily during a 1-h survey performed between 1400 and 1900 h local time (Greenwich mean time − 3 h) depending upon the season. A record was kept of the station population between September 1998 and October 1999.
Survey of presumptive fecal coliform bacteria around Rothera Point.
Seawater was sampled from several sites around Rothera Point, with emphasis on sites within North Cove (Fig. 1). The tidal range at Rothera is small (±1 m), so sampling was not restricted by the state of the tide. During 11 to 12 February and 23 to 24 April 1999 (austral summer and early winter, respectively), when sea ice had not formed, water samples were collected from the shoreline or from an inflatable boat. On 28 September 1999 (late winter) seawater was sampled through holes drilled in the sea ice. Samples were collected 1 m below the water surface, and the collection bottle was filled only when the required depth was reached. Samples were returned immediately to the laboratory for microbiological analysis.
Three replicates of each seawater sample (100 ml) underwent membrane filtration through cellulose nitrate filters (47-mm diameter, 0.2-μm pore size; Sartorius, Göttingen, Germany). The spread plate count technique was also carried out on samples collected within North Cove to allow enumeration of presumptive fecal coliforms present in high concentrations (24). Serial dilutions were carried out with phosphate-buffered saline (PBS; 8.0 g of NaCl/liter, 1.21 g of K2HPO4/liter, 0.34 g of KH2PO4/liter [pH 7.3]). With both the membrane filtration and plate count techniques, presumptive fecal coliforms were cultured on membrane lauryl sulfate broth with 1.5% agar (Oxoid, Basingstoke, United Kingdom) at 30°C for 4 h followed by 44°C for 14 h (2). Colonies were counted, and the number of presumptive fecal coliforms per 100 ml of seawater was calculated. The data were processed with a geographic information systems package, ARC-INFO, version 7.2, and maps were created to show presumptive fecal coliform concentrations and distribution in North Cove.
Exposure of fecal bacteria to solar radiation.
The viability of two Escherichia coli strains was examined during exposure to solar radiation at Rothera Point between 1230 and 1400 h (local time) on 8 February 1999. E. coli 10243 was obtained commercially (National Collections of Industrial, Food, and Marine Bacteria, Aberdeen, Scotland) while E. coli UFC1 was isolated from seawater adjacent to the Rothera sewage outfall. E. coli UFC1 was identified by small-subunit ribosomal DNA sequencing (12) and revealed a 99% homology with E. coli CFT073 (AE016770) over 667 bp.
E. coli 10243 and E. coli UFC1 were exposed to solar radiation inside UV-transparent polyethylene pouches (29). Strains were cultured in nutrient broth (Oxoid) in the dark in shake flasks at 150 rpm for 18 h at 37°C. The liquid culture was diluted 100-fold in PBS and mixed, and 400 μl was transferred to sterile UV-transparent 25- by 35-mm polyethylene pouches, which were then heat sealed. Cell suspensions were placed on a horizontal thermal plate (+2°C) located outside and exposed to solar radiation for 0, 5, 10, 15, 20, 30, 45, 60, and 90 min. A duplicate set of pouches was covered in aluminum foil as nonirradiated controls. At each time point, three irradiated and three nonirradiated pouches were removed for enumeration of viable cells. Pouches were opened, and 200 μl of cell suspension was transferred into 1.8 ml of PBS, mixed, and serially diluted (10-fold). Dilutions were dispensed onto nutrient agar plates (nutrient broth with 1.5% agar; Oxoid) in triplicate and incubated at 37°C for 48 h in the dark. The percent survival of cells under each treatment was determined relative to the foil-covered controls. Irradiances were weighted according to the DNA damage action spectrum of Setlow (38) normalized to 1 at 300 nm (UVDNA).
Transmission of solar UV through artificial sea ice.
When sea ice formed in North Cove during the winter of 1999 it was generally >30 cm thick. To simulate this, seawater was frozen at −20°C to create three cylinders of ice (diameter, 32 cm; depth, 30 cm). The edge of the ice was covered in black polyethylene to exclude solar radiation. The top surface of the ice block was positioned normal to the incident solar radiation (solar zenith angle, 30°). UV flux was measured (i) at the top surface of the ice block and (ii) through the ice (30-cm depth) with a UV radiometer (UVX radiometer with UVX-31 sensor [band range, 260 to 360 nm; calibration wavelength, 310 nm]; Ultra-Violet Products Ltd., Cambridge, United Kingdom). The percent attenuation of solar UV was calculated as 98.06% (±0.15%, standard error of the mean) through 30 cm of sea ice.
RESULTS
Seasonal variation in physical and biological parameters.
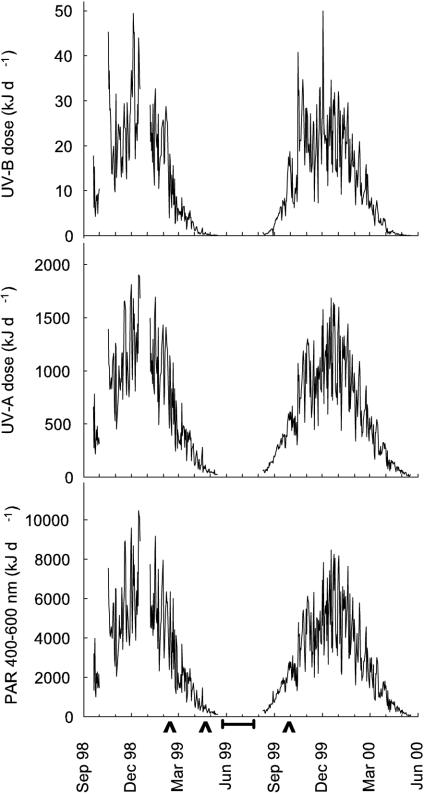
Figure 2 shows the daily dose of UVB (280 to 315 nm), UVA (315 to 400 nm), and PAR (400 to 600 nm) recorded at Rothera Point between September 1998 and May 2000. The sun was below the local horizon between 20 May and 23 July. High UVB fluxes recorded in the austral spring (September to November) were due to ozone depletion over Rothera (measured by total ozone mapping spectrometer [http://www.jwocky.gsfc.nasa.gov]).
FIG. 2.
Daily UVB, UVA, and PAR doses recorded at Rothera Point between September 1998 and May 2000. Seawater sample dates are indicated (∧). The horizontal bar indicates the period when the sun was permanently below the local horizon.
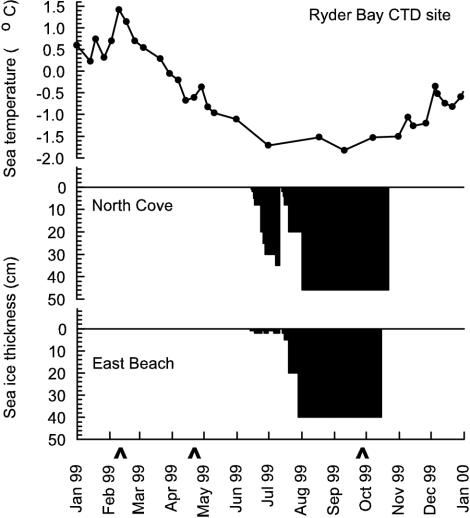
The seawater temperature declined between mid-February and July 1999, which facilitated the formation of sea ice (Fig. 3). Initially, thick ice formed in North Cove during June but by mid-July it had been blown out by strong winds, after which it reformed. Currents in the deep water off East Beach prevented thick sea ice formation until mid-July. During October, the sea ice was blown out from both sites and did not reform.
FIG. 3.
Seawater temperature in Ryder Bay and sea ice conditions in North Cove and off East Beach during 1999. Seawater sample dates are indicated (∧).
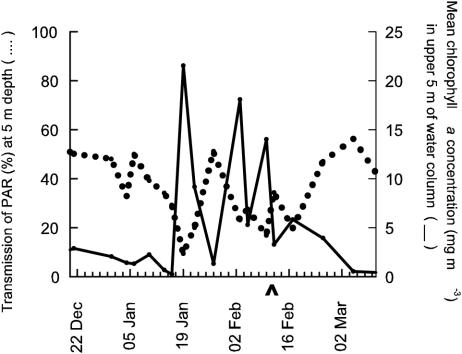
Figure 4 shows the mean chlorophyll a concentration in the top 5 m of the water column and the percent transmission of PAR at a 5-m depth near Rothera Point. There was a strong inverse relationship between chlorophyll a concentration and PAR transmission (r2 = 0.55, n = 15, P < 0.001). When there was no algal bloom, PAR values at 5 m were almost five times greater than when the chlorophyll a concentration in the water column was at its highest recorded value. Consequently, during an algal bloom, the penetration of solar radiation through the water column near Rothera Point is greatly reduced.
FIG. 4.
Mean chlorophyll a concentration in the upper 5 m of the water column (solid line) and percent transmission of PAR at a 5-m depth (dotted line) in seawater around Rothera Point. The February seawater sample date is indicated (∧).
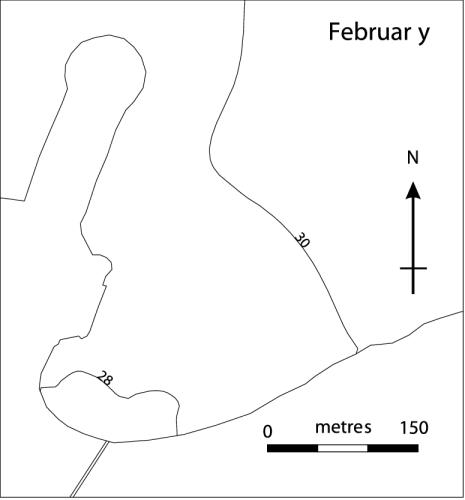
Figure 5 shows the salinity within North Cove on 11 to 12 February 1999. Salinity increased from <28 to >30‰ within 300 m of the outfall. Maximum and minimum salinity values recorded within North Cove in February were 32 and 26‰, respectively.
FIG. 5.
Contour map of seawater salinity (per mille) within North Cove from 11 to 12 February 1999.
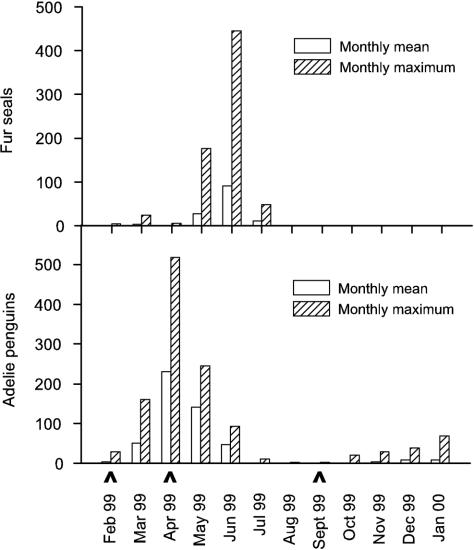
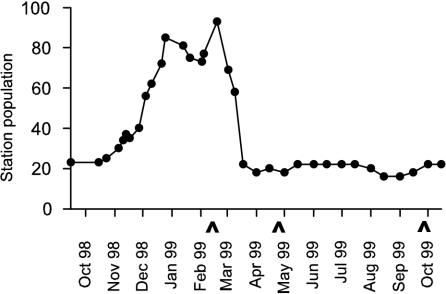
The monthly maximum and monthly mean fur seal (Acrtocephalus gazella) and Adélie penguin (Pygoscelis adeliae) counts on East Beach are shown in Fig. 6. The majority of wildlife on Rothera Point was found on East Beach, though seals were occasionally observed in North Cove. The human population of Rothera Research Station between October 1998 and October 1999 is shown in Fig. 7. The human population was at a maximum during the late summer when returning deep-field parties were in transit through the station. During the winter (April to October), the population was ∼20.
FIG. 6.
Monthly mean and maximum fur seal and Adélie penguin counts on East Beach, Rothera Point between February 1999 and January 2000. Seawater sample dates are indicated (∧).
FIG. 7.
Human population of Rothera Research Station between October 1998 and October 1999. Seawater sample dates are indicated (∧).
Distribution of presumptive fecal coliforms around Rothera Point.
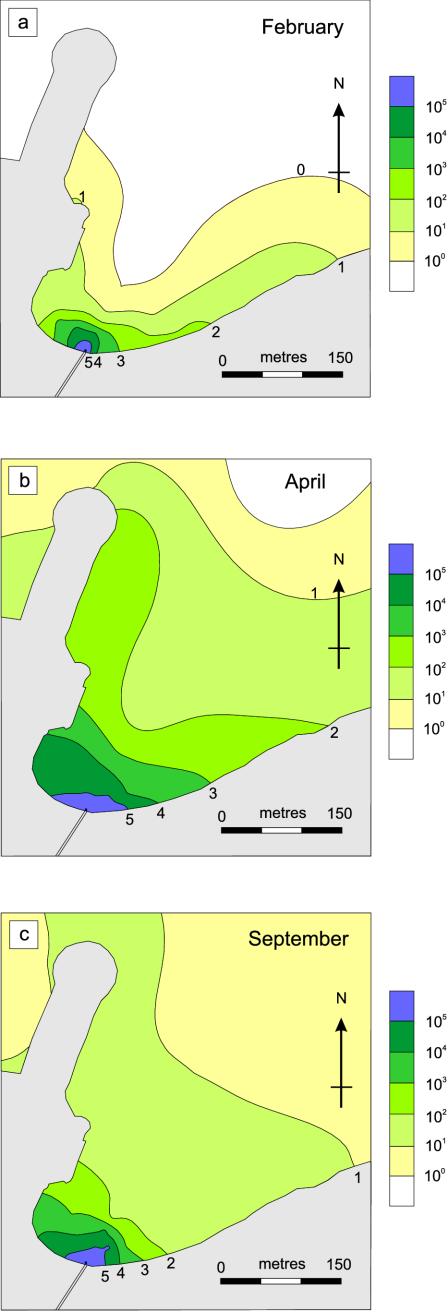
Figure 8 shows the extent and concentration of viable presumptive fecal coliforms in North Cove during each sampling period. On 11 to 12 February, presumptive fecal coliforms were restricted to the area immediately around the outfall and along the shoreline to the north and east (Fig. 8a). On 23 to 24 April 1999, the fecal coliform concentration in North Cove was greater and the distribution was more widespread (Fig. 8b). Fecal coliform counts within North Cove were not less than 101 per 100 ml of seawater and were >102 per 100 ml of seawater over roughly half of the cove area. On 28 September, fecal coliform numbers in North Cove were generally not less than 101 per 100 ml of seawater (Fig. 8c). However, concentrations of fecal coliforms of >102 per 100 ml of seawater were restricted to the area immediately adjacent to the outfall. Although recorded in February and April, the spread of high concentrations of presumptive fecal coliforms (>102 cells per 100 ml of seawater) along the shoreline to the north and east was not observed in September.
FIG.8.
The extent and number of viable fecal coliforms in North Cove on 11 to 12 February (a), 23 to 24 April (b), and 28 September (c) 1999. Numbers represent the common log exponent of viable fecal coliform numbers per 100 ml of seawater.
Table 1 shows presumptive fecal coliform counts at sample sites off East Beach (EB1 to EB4) and at other sites around Rothera Point during the study. On 11 to 12 February, no fecal coliforms were detected at sites outside North Cove. By 23 to 24 April, fecal coliforms were detected at all sites, with the highest numbers found near penguin roosts on East Beach (2.16 × 10⁴ cells per 100 ml of seawater). On 28 September, when sea ice had formed and local wildlife numbers were very low, fecal coliforms were detected at all but one site; however, numbers were lower than detected in April (<102 cells per 100 ml of seawater). The wharf and South Cove had low fecal coliform counts throughout the year.
TABLE 1.
Presumptive fecal coliform counts at sample sites around Rothera Point, excluding North Cove
| Sampling sitea | No. of coliforms per 100 ml of seawater on sample date:
|
||
|---|---|---|---|
| 11-12 February | 23-24 April | 28 September | |
| EB1 | 0 | 867 | 27 |
| EB2 | 0 | 187 | 14 |
| EB3 | 0 | 21,600 | 2 |
| EB4 | 0 | 11,400 | 1 |
| Wharf | 0 | 2 | 1 |
| South Cove | 0 | 1 | 0 |
Figure 1 shows site positions.
Exposure of fecal bacteria to solar radiation.
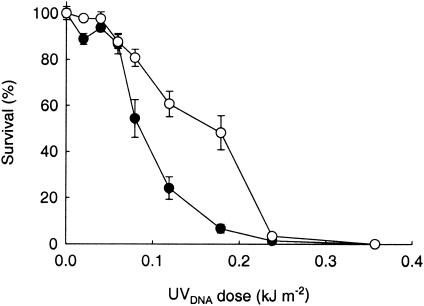
Figure 9 shows the percent survival of E. coli 10243 and E. coli UFC1 under Antarctic solar radiation. One hundred percent mortality was observed in both strains after a 90-min solar exposure of 0.36 kJ of UVDNA m−2.
FIG. 9.
Percent survival of E. coli 10243 (•) and E. coli UFC1 (○) with exposure to solar radiation (± standard error of the mean). Irradiances were weighted according to the DNA damage action spectrum of Setlow (38).
DISCUSSION
Various seasonal environmental parameters affected distribution of fecal coliform bacteria around Rothera Point.
(i) Solar radiation
The solar radiation dose was probably the dominant factor in determining viable fecal coliform concentrations in the sea around Rothera Point (Fig. 8 and Table 1). In February, the daily solar radiation doses were high (UVB, 18.1 kJ d−1; UVA, 1,141.7 kJ d−1; PAR, 6,353.5 kJ d−1) and the presumptive fecal coliform counts were low. By April, the radiation doses had fallen by ∼95% and the presumptive fecal coliform concentrations increased by up to 1,000-fold. In September, despite ozone depletion and moderate doses of radiation (UVB, 17.5 kJ d−1; UVA, 595.6 kJ d−1; PAR, 2,743.3 kJ d−1), the presumptive fecal coliform concentrations in North Cove remained high compared with the February data. The presence of sea ice (>45 cm thick), covered with a layer of snow (>10 cm thick), may have attenuated the UV transmission into the seawater by >98% and increased microbial survival. Once input of solar radiation into the water column was reduced, either by reduced day length and increased solar zenith angle (April) or by formation of sea ice (September), presumptive fecal coliform concentrations increased significantly.
This and other studies (40, 44) have shown the bactericidal effect of solar radiation on a range of sewage microorganism species. Various factors affect the cytotoxic effect of solar radiation on fecal coliforms.
(a) Water depth.
Water depth can influence the effectiveness of solar radiation in fecal coliform inactivation. Action spectra for E. coli show that UVB radiation has the greatest bactericidal effect (48, 49), although UVA may be more important in the marine environment, as it penetrates the water column to a greater depth (9). The use of a repair-deficient E. coli strain as a biological dosimeter in Antarctic aquatic environments showed that the majority of cellular damage caused by solar radiation occurred in the top 10 m of the water column (29). Natural bacterioplankton inactivation also decreased with depth and showed no significant inhibition at 9.5 m (21). Consequently, as the majority of North Cove is <10 m deep, it provides suitable conditions for bacterial inactivation by solar radiation.
(b) Dissolved oxygen.
High concentrations of dissolved oxygen found in Antarctic seawater could lead to enhanced microbial inactivation by solar UV radiation. Temperature and salinity play important roles in regulating the concentration of oxygen found in seawater. Antarctic surface seawater at 0°C and 25‰ salinity can contain twice the concentration of dissolved oxygen found in the tropics at 30°C and 35‰ (376.12 compared with 190.74 μmol of O2 kg seawater−1) (7). When oxygen is present, photochemical damage to E. coli is increased at wavelengths found in solar radiation, particularly UVA (36, 39, 48, 49). The combination of UV and oxygen allows the formation of highly reactive free radicals (including singlet oxygen, hydroperoxyl, and hydroxyl groups), which cause cellular damage (47).
(c) Sea ice.
Sea ice thickness and physical properties, together with the snow that collects on its surface, can result in the attenuation of solar radiation input into the water column (6, 31, 45). Sea ice algal blooms can further attenuate solar radiation transmission through ice. If sea ice fails to form during periods of ozone depletion in the austral spring (as is frequently the case at Rothera Point), fecal coliform survival may be further reduced.
(d) Algal blooms.
Algal blooms also reduce the penetration of solar radiation into the water column (21, 23). Unlike sewage microorganisms, many phytoplankton species can tolerate high solar UV influx by production of UV-screening pigments or vertical migration in the water column (20, 30). Consequently, an algal bloom may significantly reduce the UV dose experienced by microbes in the water column and, hence, increase survival time.
(ii) Salinity.
Salinity can affect fecal bacterial viability, with high or rapidly changing salt concentrations increasing cell inactivation (1). The input of freshwater from iceberg melt, snowmelt from the shore, and sewage waste contributed to the low salinity in North Cove. Seasonal factors can affect seawater salinity. In summer, salinity around a piece of melting glacier ice can vary between almost freshwater and >30‰ salinity (26), whereas in winter, salt released during sea ice formation can increase seawater salinity (19). Rates of bacterial mortality may be increased by rapid changes in osmotic stress caused by passing through seawater with spatially variable salt concentrations.
(iii) Water currents.
In February and April, when North Cove was free of sea ice, waves and wind-driven currents from the north prevented distribution of the sewage throughout the bay and caused it to move along the shoreline. North Cove is shallow, which enhances the effects of the wind in the production of waves. By September, the formation of sea ice eliminated wave and wind-driven seawater mixing and fecal coliforms were not concentrated along the shoreline to either side of the outfall, as was observed previously. Consequently, the flushing of sewage out of North Cove was inhibited by the formation of sea ice. The sea close to East Beach is comparatively deep, with currents passing Rothera Point, even when sea ice is present. This may have limited the development of high fecal coliform concentrations. It was unlikely that high concentrations of viable sewage microbes from the outfall extended around the Site of Special Scientific Interest (SSSI) to East Beach (Fig. 1).
(iv) Wildlife.
In February, no fecal coliforms were detected at sites outside North Cove, even though wildlife was present. This was probably a result of low fecal input by wildlife and high doses of solar radiation, which may have increased fecal bacterial mortality rates. By April, when the solar radiation dose was low and local Adélie penguin numbers were at their yearly maximum (monthly average of 231), fecal coliforms were detected at all sites outside North Cove, with the highest counts found near penguin roosts on East Beach. In September, when sea ice had formed (attenuating solar radiation penetration into the seawater) and local wildlife numbers were very low, fecal coliforms were detected at all but one site; however, the numbers were much lower than those detected in April (<102 cells per 100 ml of seawater). This highlights the importance of solar radiation in killing fecal coliforms derived from indigenous wildlife as well as from humans.
The French continental Antarctic research station, Dumont d'Urville (66°40′S, 140°01′E), has a local wildlife population consisting mainly of Adélie and emperor (Aptenodytes forsteri) penguin colonies. Dellile (10) found a strong positive correlation between penguin population and bacterial numbers in the seawater adjacent to the rookeries and also a decline in bacterial numbers with distance from the shore. Erskine et al. (15) estimated that seals and penguins around Macquarie Island (sub-Antarctic) produced 3,730 tons of feces per year (dry mass), and Smith (42) suggested that the sewage pollution produced by the station was, by comparison, insignificant. Nevertheless, pollution effects have been observed near the much larger McMurdo station, where large percentages of marine invertebrates contained the fecal indicator organism Clostridium perfringens (13, 32).
(v) Station population.
In February, the station population was ∼80, which declined to ∼20 by April and September. The increase in station population number during the summer had little effect on fecal coliform numbers in North Cove due to the bactericidal action of solar radiation. This again emphasizes the dominant effect of solar radiation in determining fecal coliform survival and distribution. Management and design of sewage systems may also be important in determining the output of fecal microorganisms into the environment. Antarctic research station populations vary considerably (from 2 to >1,000). As sewage production increases, environmental factors will become less significant, and as a result, effective sewage waste management becomes increasingly important.
The sewage plume produced by Rothera Research Station was small and localized when compared to studies of other Antarctic station sewage plumes (e.g., the Dumont d'Urville [11] and McMurdo [25] stations). This is likely to be due to seasonal factors. (i) Throughout the year, Rothera Research Station has a small population (average winter and summer populations of ∼20 and ∼60, respectively, during 1999). (ii) The sewage outfall empties into a shallow bay that facilitates bacterial inactivation by solar radiation during summer. (iii) Sea ice formation, which enhances fecal coliform survival in seawater and reduces sewage dilution rates, occurs irregularly around Rothera Point; for example, only three of the last six years (1997 to 2002) have seen well-developed sea ice.
Several authors recommend that sewage receive full treatment before discharge into the polar environment (5, 8, 22). The British Antarctic Survey has installed a full sewage treatment plant at Rothera Research Station, which came into operation in February 2003.
Acknowledgments
This work was supported by the British Antarctic Survey's Biomolecular Responses to Environmental Stresses in the Antarctic project and the Environment and Information Division.
I thank N. Blenkharn, P. Wickens, G. Fell, C. Barnes, I. McDonald, C. Day, and M. Annat for help with sample collection. S. Hinde, J. Beaumont, and L. Thomson are acknowledged for undertaking the daily wildlife surveys. P. Geissler and H. Peat are thanked for providing solar radiation data, D. Pearce is thanked for molecular biological identification work, and J. Beaumont and A. Clarke are thanked for CTD and sea temperature data. N. McWilliams and P. Fretwell are acknowledged for map preparation, and P. Convey, L. Peck, J. Shears, and D. Walton are acknowledged for helpful comments on the manuscript.
REFERENCES
- 1.Anderson, I. C., M. W. Rodes, and H. I. Kator. 1979. Sublethal stress in Escherichia coli: a function of salinity. Appl. Environ. Microbiol. 38:1147-1152. [DOI] [PMC free article] [PubMed] [Google Scholar]
- 2.Anonymous. 1994. The microbiology of water 1994. Part 1-drinking water. Methods for the examination of waters and associated materials. Report on public health and medical subjects no. 71. Her Majesty's Stationery Office, London, United Kingdom.
- 3.Antarctic Treaty Consultative Parties. 1991. Protocol on Environmental Protection to the Antarctic Treaty. CM 1960. Her Majesty's Stationery Office, London, United Kingdom.
- 4.Baleux, B., A. Caro, J. Lesne, P. Got, S. Binard, and B. Delpeuch. 1998. Survie et maintien de la virulence de Salmonella typhimurium VNC exposee simultanement a trios facteurs stressants experimentaux. Oceanol. Acta 21:939-950. [Google Scholar]
- 5.Barros, J. A., F. J. Hanus, and R. Y. Morita. 1975. Survival of human enteric and other sewage microorganisms under simulated deep sea conditions. Appl. Microbiol. 30:309-318. [DOI] [PMC free article] [PubMed] [Google Scholar]
- 6.Belzile, C., S. C. Johannessen, M. Gosselin, S. Demers, and W. L. Miller. 2000. Ultraviolet attenuation by dissolved and particulate constituents of first-year ice during late spring in an Arctic polynya. Limnol. Oceanogr. 45:1265-1273. [Google Scholar]
- 7.Benson, B. B., and D. Krause, Jr. 1984. The concentration of isotopic fractionation of oxygen dissolved in freshwater and seawater in equilibrium with the atmosphere. Limnol. Oceanogr. 29:620-632. [Google Scholar]
- 8.Bruni, V., T. L. Maugeri, and L. Monticelli. 1997. Fecal pollution indicators in the Terra Nova Bay (Ross Sea, Antarctica). Mar. Pollut. Bull. 34:908-912. [Google Scholar]
- 9.Davies-Colley, R. J., R. G. Bell, and A. M. Donnison. 1994. Sunlight inactivation of Enterococci and fecal coliforms in sewage effluent diluted in seawater. Appl. Environ. Microbiol. 60:2049-2058. [DOI] [PMC free article] [PubMed] [Google Scholar]
- 10.Dellile, D. 1987. Spatial distribution of coastal Antarctic seawater bacteria: relationship with Avifauna. Polar Biol. 8:55-60. [Google Scholar]
- 11.Dellile, D., and E. Dellile. 2000. Distribution of enteric bacteria in Antarctic seawater surrounding the Dumont d'Urville permanent station (Adelie Land). Mar. Pollut. Bull. 40:869-872. [DOI] [PubMed] [Google Scholar]
- 12.Dunbar, J., S. Takala, S. M. Barns, J. A. Davis, and C. R. Kuske. 1999. Levels of bacterial community diversity in four arid soils compared by cultivation and 16S rRNA gene cloning. Appl. Environ. Microbiol. 65:1662-1669. [DOI] [PMC free article] [PubMed] [Google Scholar]
- 13.Edwards, D. D., G. A. McFeters, and M. I. Venkatesan. 1998. Distribution of Clostridium perfringens and fecal sterols in a benthic coastal marine environment influenced by the sewage outfall from McMurdo station, Antarctica. Appl. Environ. Microbiol. 64:2596-2600. [DOI] [PMC free article] [PubMed] [Google Scholar]
- 14.Erickson, A. W., and M. B. Hanson. 1990. Continental estimates and population trends of Antarctic ice seals, p. 253-264. In K. R. Kerry and G. Hempel (ed.), Antarctic ecosystems, ecological change and conservation. Springer-Verlag, Berlin, Germany.
- 15.Erskine, P. D., D. M. Bergstrom, S. Schmidt, G. R. Stewart, C. E. Tweedie, and J. Shaw. 1998. Subantarctic Macquarie Island—a model ecosystem for studying animal derived nitrogen sources using 15N natural abundance. Oecologia 117:187-193. [DOI] [PubMed] [Google Scholar]
- 16.Fujioka, R. S., H. H. Hashimoto, E. B. Siwak, and R. H. Young. 1981. Effect of sunlight on survival of indicator bacteria in seawater. Appl. Environ. Microbiol. 41:690-696. [DOI] [PMC free article] [PubMed] [Google Scholar]
- 17.Gardner, H., K. Kerry, and M. Riddle. 1997. Poultry virus infection in Antarctic penguins. Nature 387:245. [DOI] [PubMed] [Google Scholar]
- 18.George, A. L. 2002. Seasonal factors affecting surfactant biodegradation in Antarctic coastal waters: comparison of a polluted and pristine site. Mar. Environ. Res. 53:403-415. [DOI] [PubMed] [Google Scholar]
- 19.Golden, K. M. 2001. Brine percolation and the transport properties of sea ice. Ann. Glaciol. 33:28-36. [Google Scholar]
- 20.Hader, D.-P. 1997. Effects of UV radiation on phytoplankton. Adv. Microb. Ecol. 15:1-26. [Google Scholar]
- 21.Hader, D.-P., H. D. Kumar, R. C. Smith, and R. C. Worrest. 1998. Effects on aquatic ecosystems. J. Photochem. Photobiol. B 46:53-68. [Google Scholar]
- 22.Halton, J. E., and W. R. Nehlsen. 1968. Survival of Escherichia coli in zero degree centigrade seawater. J. Water Pollut. Control Fed. 40:865-868. [PubMed] [Google Scholar]
- 23.Helbling, E. W., E. R. Marguet, V. E. Villafane, and O. Holm-Hansen. 1995. Bacterioplankton viability in Antarctic waters as affected by solar ultraviolet radiation. Mar. Ecol. Prog. Ser. 126:293-298. [Google Scholar]
- 24.Herbert, R. A. 1990. Methods for enumerating microorganisms and determining biomass in natural environments, p. 1-39. In R. Grigorova and J. R. Noris (ed.), Methods in microbiology, vol. 22. Techniques in microbial ecology. Academic Press, London, United Kingdom.
- 25.Howington, J. P., G. A. McFeters, J. P. Barry, and J. J. Smith. 1992. Distribution of the McMurdo Station sewage plume. Mar. Pollut. Bull. 25:324-327. [Google Scholar]
- 26.Hudier, E., and G. Ingram. 1994. Small-scale melt processes governing the flushing of nutrients from a first-year sea ice, Hudson Bay, Canada. Oceanol. Acta 17:397-403. [Google Scholar]
- 27.Kapuscinski, R. B., and R. Mitchell. 1981. Solar radiation induces sublethal injury in Escherichia coli in seawater. Appl. Environ. Microbiol. 41:670-674. [DOI] [PMC free article] [PubMed] [Google Scholar]
- 28.Kapuscinski, R. B., and R. Mitchell. 1983. Sunlight-induced mortality of viruses and Escherichia coli in coastal seawater. Environ. Sci. Technol. 17:1-6. [DOI] [PubMed] [Google Scholar]
- 29.Karentz, D., and L. H. Lutze. 1990. Evaluation of biologically harmful ultraviolet radiation in Antarctica with a biological dosimeter designed for aquatic environments. Limnol. Oceanogr. 35:549-561. [Google Scholar]
- 30.Karentz, D., J. E. Cleaver, and D. L. Mitchell. 1991. Cell survival characteristic and molecular responses of Antarctic phytoplankton to ultraviolet-B radiation. J. Phycol. 27:326-341. [Google Scholar]
- 31.Kepner, R. L., R. A. Wharton, R. D. Collier, C. S. Cockell, and W. H. Jeffrey. 2000. UV radiation and potential biological effects beneath the perennial ice cover of an Antarctic lake. Hydrobiologia 427:155-165. [Google Scholar]
- 32.Lenihan, H. S., J. S. Oliver, M. D. Oakden, and M. D. Stephenson. 1990. Intense localized benthic pollution around McMurdo Station, Antarctica. Mar. Pollut. Bull. 21:422-430. [Google Scholar]
- 33.Lohan, M. C., P. J. Stratham, and L. Peck. 2001. Trace metals in the Antarctic soft-shelled clam Laternula elliptica: implications for metal pollution from Antarctic research stations. Polar Biol. 24:808-817. [Google Scholar]
- 34.McFeters, G. A., J. P. Barry, and J. P. Howington. 1993. Distribution of enteric bacteria in Antarctic seawater surrounding a sewage outfall. Water Res. 27:645-650. [DOI] [PubMed] [Google Scholar]
- 35.Monfort, P., and B. Baleux. 1991. Distribution and survival of motile Aeromonas spp. in brackish water receiving sewage treatment effluent. Appl. Environ. Microbiol. 57:2459-2467. [DOI] [PMC free article] [PubMed] [Google Scholar]
- 36.Peak, J. G., M. J. Peak, and R. W. Tuveson. 1983. Ultraviolet action spectra for aerobic and anaerobic inactivation of Escherichia coli strains specifically sensitive and resistant to near ultraviolet radiations. Photochem. Photobiol. 38:541-543. [DOI] [PubMed] [Google Scholar]
- 37.Rhodes, M. W., and H. I. Kator. 1983. Seasonal variation in survival of Escherichia coli exposed in situ in membrane diffusion chambers containing filtered and non-filtered estuarine water. Appl. Environ. Microbiol. 45:1877-1883. [DOI] [PMC free article] [PubMed] [Google Scholar]
- 38.Setlow, R. B. 1974. The wavelengths in sunlight effective in producing skin cancer: a theoretical analysis. Proc. Natl. Acad. Sci. USA 71:3363-3366. [DOI] [PMC free article] [PubMed] [Google Scholar]
- 39.Sinton, L. W., R. J. Davies-Colley, and R. G. Bell. 1994. Inactivation of enterococci and fecal coliforms from sewage and meatworks effluent in seawater chambers. Appl. Environ. Microbiol. 60:2040-2048. [DOI] [PMC free article] [PubMed] [Google Scholar]
- 40.Sinton, L. W., R. K. Finlay, and P. A. Lynch. 1999. Sunlight inactivation of fecal bacteriophages and bacteria in sewage-polluted seawater. Appl. Environ. Microbiol. 64:3605-3613. [DOI] [PMC free article] [PubMed] [Google Scholar]
- 41.Smith, J. J., J. P. Howington, and G. A. McFeters. 1994. Survival, physiological response and recovery of enteric bacteria exposed to a polar marine environment. Appl. Environ. Microbiol. 60:2977-2984. [DOI] [PMC free article] [PubMed] [Google Scholar]
- 42.Smith, S. 2000. The effects of a small sewage outfall on an algal epifaunal community at Macquarie Island (sub-Antarctic): a drop in the Southern Ocean? Mar. Pollut. Bull. 40:873-878. [Google Scholar]
- 43.Solic, M., and N. Krstulovic. 1992. Separate and combined effects of solar radiation, temperature, salinity and pH on the survival of fecal coliforms in seawater. Mar. Pollut. Bull. 24:411-416. [Google Scholar]
- 44.Statham, J. A., and T. A. McMeekin. 1994. Survival of fecal bacteria in Antarctic coastal waters. Antarct. Sci. 6:333-338. [Google Scholar]
- 45.Trodahl, H. J., and R. G. Buckley. 1990. Enhanced ultraviolet transmission of Antarctic sea ice during the austral spring. Geophys. Res. Lett. 17:2177-2179. [Google Scholar]
- 46.Troussellier, M., J.-L. Bonnefont, C. Courties, A. Derrien, E. Dupray, M. Gauthier, M. Gourmelon, F. Joux, P. Lebaron, Y. Martin, and M. Pommepuy. 1998. Responses of enteric bacteria to environmental stresses in seawater. Oceanol. Acta 21:965-981. [Google Scholar]
- 47.Vincent, W. F., and P. J. Neale. 2000. Mechanisms of UV damage to aquatic organisms, p. 149-176. In S. de Mora, S. Demers, and M. Vernet (ed.), The effects of UV radiation in the marine environment. Cambridge University Press, Cambridge, United Kingdom.
- 48.Webb, R. B., and M. S. Brown. 1976. Sensitivity of strains of Escherichia coli differing in repair capability to far UV, near UV and visible radiations. Photochem. Photobiol. 24:425-432. [DOI] [PubMed] [Google Scholar]
- 49.Webb, R. B., and M. S. Brown. 1979. Action spectrum for oxygen dependent and independent inactivation of Escherichia coli WP2 from 254 to 460 nm. Photochem. Photobiol. 29:407-409. [DOI] [PubMed] [Google Scholar]


