Abstract
Background
In order to identify rice genes involved in nutrient partitioning, microarray experiments have been done to quantify genomic scale gene expression. Genes involved in nutrient partitioning, specifically grain filling, will be used to identify other co-regulated genes, and DNA binding proteins. Proper identification of the initial set of bait genes used for further investigation is critical. Hierarchical clustering is useful for grouping genes with similar expression profiles, but decreases in utility as data complexity and systematic noise increases. Also, its rigid classification of genes is not consistent with our belief that some genes exhibit multifaceted, context dependent regulation.
Results
Singular value decomposition (SVD) of microarray data was investigated as a method to complement current techniques for gene expression pattern recognition. SVD's usefulness, in finding likely participants in grain filling, was measured by comparison with results obtained previously via clustering. 84 percent of these known grain-filling genes were re-identified after detailed SVD analysis. An additional set of 28 genes exhibited a stronger grain-filling pattern than those grain-filling genes that were unselected. They also had upstream sequence containing motifs over-represented among grain filling genes.
Conclusions
The pattern-based perspective that SVD provides complements to widely used clustering methods. The singular vectors provide information about patterns that exist in the data. Other aspects of the decomposition indicate the extent to which a gene exhibits a pattern similar to those provided by the singular vectors. Thus, once a set of interesting patterns has been identified, genes can be ranked by their relationship with said patterns.
Background
Grain filling aspects of nutrient partitioning are intensely studied as they affect the yield and quality of many important cereals. This quality can be measured in nutritional and aesthetic terms. The grain-filling process of cereal development typically has two processes: dilatory and filling. Together these processes encompass the synthesis, transport, and storage of carbohydrates, fatty acids, proteins, and minerals. The dilatory process is characterized by high biosynthetic activity and low dry matter accumulation. During the filling phase all plant resources contribute toward a steady rate of starch accumulation in the starch storage unit. Genes that influence the grain filling process are particularly important in achieving the goal of manipulating nutrient partitioning pathways.
In Zhu et al. (2003) [1], several genes responsible for grain filling in rice were computationally identified. There, clustering of gene expression profiles was used to identify grain filling genes and their transcription factors from 21,000 rice genes. The method used consisted of an initial identification of nutrient partitioning genes based on annotation and selection of genes that potentially participate in the grain-filling process by clustering of expression profiles via Self-Organizing Map (SOM), followed by hierarchical clustering influenced by the SOM gene ordering [2]. A set of grain filling related, nutrient partitioning gene clusters were identified via informed visual inspection of the hierarchical clustering results. This initial set of genes formed the sole basis for identification of a wider range of grain filling related genes with diverse functions, over-represented cis acting regulatory elements, and associated transcription factors. Such an approach provided a powerful way to associate genes with traits of interest, to identify key regulators as putative target genes in this complicated biological process, and a potential method to identify strategies for improvement of crop yield and nutrient value by pathway engineering. However, the identified genes and their regulatory networks require thorough functional validations by experimental methods such as reverse genetics. These experimental validation steps usually are time-consuming and expensive. Thus, improvement of microarray data analysis by false positive reduction becomes necessary.
Competitive learning schemes like the Kohonen SOM [3] and hierarchical clustering are popular methods for visualization and identification of patterns in a large set of gene expression profiles. SOM analysis can provide nonexclusive classifications, but requires an estimate for the number of classes (nodes) and is usually carried out in a low-dimensional space. Hierarchical clustering is a more frequently used method, but visualization via one-dimensional lists can lead to poor resolution of related genes even if a SOM gene ordering influences the branch flipping, as implemented in the software tool Cluster [2].
Recently, singular value decomposition (SVD) has emerged as an alternative method for genomic research. Several groups have demonstrated its utility in identifying global, cyclic patterns of gene expression [4,5], and its application in reduction of experimental and biological noise in microarray datasets [5,6]. SVD is a feature generation technique that facilitates the exploration of multiple dimensions of data variability. SVD is an operation applied to a matrix that results in a list of vectors, which contain features measuring different aspects of variation in the data. One can produce multiple nonexclusive gene orderings or classifications based on significant feature vectors. The patterns exhibited by one or more feature vectors, singly or in combination, may correspond to biological processes.
To improve accuracy of target identification by avoiding exclusive clustering and exploring a wider range of dimensionality in expression pattern variation, we have examined the utility of singular value decomposition in identifying grain-filling genes. In this manuscript, we focus on nutrient partitioning genes potentially involved in grain filling. After evaluating the full spectrum of expression patterns, we address the identification of grain filling genes by a measure of correlation with a familiar expression pattern, conceptually conforming to grain filling. In this manner we have identified several genes potentially involved in grain filling, and evaluate them by comparison with grain filling genes identified in an earlier study [1]. These genes have similar expression profiles showing significant differential expression during rice grain development and tissue specificity to panicle and grain. Cis-acting regulatory element surveys also support their role in the grain filling process.
Results
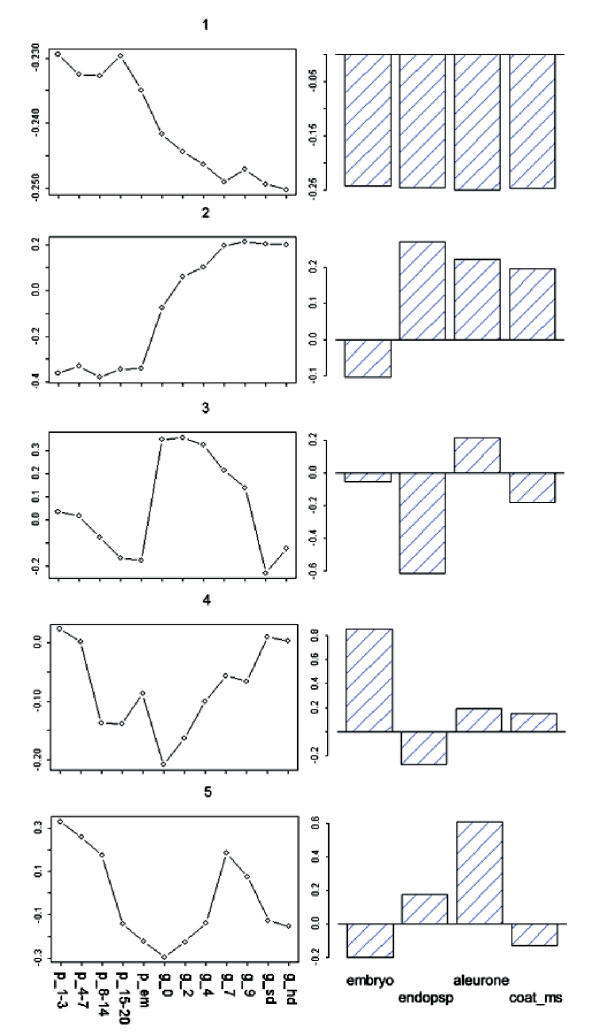
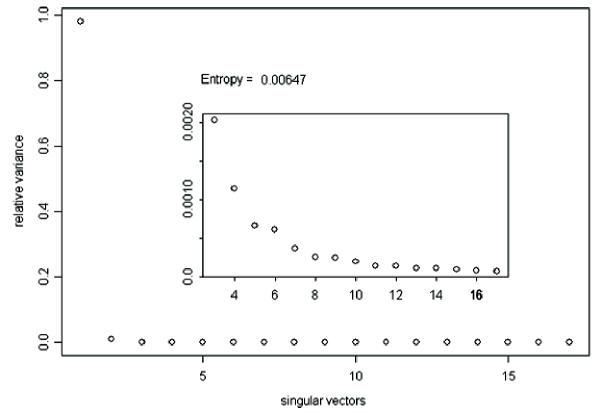
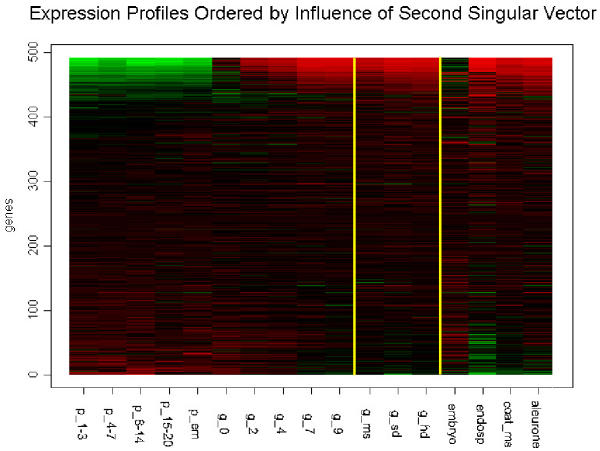
The decomposition of a matrix of expression levels, A, presented us with several interesting patterns for gene expression during grain development (Figure 1). The first three patterns are significant according to the relative variance threshold, t, described by Everitt and Dunn (2001) [7], 0.7/n (n = 491 → t = 0.00142.) The entropy in the distribution of relative variances is very low, indicating uneven contribution of the patterns to the expression profiles in A (Figure 2). The first pattern, v1, reflects a significant deviation from the basal expression level, with an insignificant variance between experimental conditions. In addition, the coefficients of u1 have higher entropy of distribution than the following left singular vectors, making it a weaker gene classifier. v1 may represent normalized global gene expression deviation from the project mean, and was not used to identify grain-filling genes. v2 has a significant pattern of variation between experiments, indicative of a process very similar to our grain-filling ideal. u2 was used to sort the 491 genes. The sorted expression profiles are shown in Figure 3. We classified genes as grain filling if their rank percentile was greater than or equal to 0.8. We limited our threshold to 0.8 in order to obtain a set of at least 98 genes. The control set was a list of 98 genes previously classified as grain filling by Zhu et al. (2003) [1]. Thus, the maximum possible fraction of overlap between our grain filling gene list and the control set could be 100%. Seventy-two percent of the control set had rank percentiles greater than 0.8. There were 28 genes ranked above this level that were not in the control set (Table 1a). The control set percentiles are shown in Table 2 (see Additional file: 1), with values derived from rankings by several patterns. Those in the control set not greater than the 80th percentile in the v2 ranking were investigated further to see if they followed other potential nutrient partitioning patterns. Of these twenty-seven, five were strongly composed of pattern v3, and ten of v5, leaving thirteen genes in the grain filling control set unaccounted for (Table 1b).
Figure 1.
First five singular vectors vs. developmental (lines) and histological samples (bars). Sample abbreviations: p_1–3 (panicle 1–3 cm), ..., p_em (panicle during panicle emergence), g_0 (grain at zero days postanthesis), ..., g_sd (grain, soft dough), g_hd (grain, hard dough), endosp (endosperm), & coat_ms (seed coat, milk stage).
Figure 2.
Singular values ranked by the relative variance they account for, and entropy of this distribution. Inset focuses on singular values of rank 3 and lower.
Figure 3.
Expression profiles that have a grain-filling pattern are grouped together in this ordering based on the influence of the second right singular vector. Expression levels in Embryo samples are uncorrelated with this ordering.
Table 1.
List of Probe Set IDs for newly identified genes (Class C) and unresolved genes (Class B)
| a) Class C | Description | b) Class B | Description |
| OS006543_at | YNT1_ANASP Q05067 ANABAENA SP. (STRAIN PCC 7120). HYPOTHETICAL ABC TRANSPORTER ATP-BINDING PROTEIN IN NTCA/BIFA 3 REGION(ORF1) (FRAGMENT). | OS017582.1_r_at | gi|7267708| sucrose-phosphate synthase-like protein [Arabidopsis thaliana] |
| OS004712.1_at | gi|4467848| ADP-glucose pyrophosphorylase large subunit [Hordeum vulgare] | OS019628.1_at | gi|7576210| palmitoyl-protein thioesterase precursor-like [Arabidopsis thaliana] |
| OS007703.1_at | gi|4467144| putative phosphatidylinositol synthase [Arabidopsis thaliana] | OS000739_at | gi|5734442| hexose transporter [Lycopersicon esculentum] |
| OS017116_at | gi|7108597|AF129478_1 K+ transporter HAK5 [Arabidopsis thaliana] | OS012020_i_at | ABCX_PORPU P51241 PORPHYRA PURPUREA. PROBABLE ATP-DEPENDENT TRANSPORTER YCF16. |
| OS000501_at | gi|322850|PC1257 alpha-amylase (EC 3.2.1.1) (clone alphaAmy8-C) – rice (fragment) | OS001622.1_r_at | gi|169767| alpha-amylase |
| OS022287_at | PA2L_VIPAA P17935 VIPERA AMMODYTES AMMODYTES (WESTERN SAND VIPER). PHOSPHOLIPASE A2 HOMOLOG, AMMODYTIN L PRECURSOR. | OS020548.1_at | AMYG_NEUCR P14804 NEUROSPORA CRASSA. GLUCOAMYLASE PRECURSOR |
| OS007631.1_at | PSS_METJA Q58609 METHANOCOCCUS JANNASCHII. CDP-DIACYLGLYCEROL – SERINE O-PHOSPHATIDYLTRANSFERASE (EC 2.7.8.8) (PHOSPHATIDYLSERINE SYNTHASE). | OS006763.1_at | gb|Z95637 acyl-CoA:1-acylglycerol-3-phosphate acyltransferase from Brassica napus. [Arabidopsis thaliana] |
| OS011263_s_at | gi|2129657|S71286 oleosin, 20 K – Arabidopsis thaliana | OS013884.1_i_at | PTSN_ECOLI P31222 ESCHERICHIA COLI. NITROGEN REGULATORY IIA PROTEIN |
| OS016830.1_at | gi|7939571| phospholipase D [Arabidopsis thaliana] | OS006772.1_i_at | gi|2981620| mutated 3-ketoacyl-CoA thiolase [Arabidopsis thaliana] |
| OS018554_at | KDGL_DROME Q01583 DROSOPHILA MELANOGASTER (FRUIT FLY). DIACYLGLYCEROL KINASE (EC 2.7.1.107) (DIGLYCERIDE KINASE) (DGK)(DAG KINASE). | OS005686_at | YDEX_ECOLI P77257 ESCHERICHIA COLI. HYPOTHETICAL ABC TRANSPORTER ATP-BINDING PROTEIN YDEX. |
| OS022506_at | PTFA_MYCGE P47308 MYCOPLASMA GENITALIUM. PTS SYSTEM, FRUCTOSE-SPECIFIC IIABC COMPONENT (EIIABC-FRU) (FRUCTOSE-PERMEASE IIABC COMPONENT) (PHOSPHOTRANSFERASE ENZYME II, ABCCOMPONENT) (EC 2.7.1.69) (EII-FRU / EIII-FRU). | OS008739.1_at | gi|4587543|AC006577_10 Belongs to the PF|00657 Lipase/Acylhydrolase with GDSL-motif family. |
| OS005330_at | GPI2_YEAST P46961 P48014 SACCHAROMYCES CEREVISIAE (BAKER S YEAST). N-ACETYLGLUCOSAMINYL-PHOSPHATIDYLINOSITOL BIOSYNTHETIC PROTEIN GPI2. | OS022874_at | TRPC_AZOBR P26938 AZOSPIRILLUM BRASILENSE. INDOLE-3-GLYCEROL PHOSPHATE SYNTHASE |
| OS013194_at | gi|2285885| sulfate transporter [Arabidopsis thaliana] | OS021397.1_i_at | FCGN_HUMAN P55899 HOMO SAPIENS (HUMAN). IGG RECEPTOR FCRN LARGE SUBUNIT P51 PRECURSOR |
| OS020610_at | AMHX_BACSU P54983 BACILLUS SUBTILIS. AMIDOHYDROLASE AMHX (EC 3.5.1.-) (AMINOACYLASE). | ||
| OS021689.1_at | KICH_YEAST P20485 SACCHAROMYCES CEREVISIAE (BAKER S YEAST). CHOLINE KINASE (EC 2.7.1.32). | ||
| OS019294_at | YKG8_CAEEL P46558 CAENORHABDITIS ELEGANS. HYPOTHETICAL CHOLINE KINASE LIKE B0285.8 IN CHROMOSOME III. | ||
| OS006931.1_at | gi|735880| geranylgeranyl pyrophosphate synthase-related protein | ||
| OS017593.1_at | gi|2129660|S69197 oleoyl-[acyl-carrier-protein] hydrolase (EC 3.1.2.14) (clone TE 1–7) – Arabidopsis thaliana | ||
| OS023388_r_at | YDEZ_ECOLI P77651 ESCHERICHIA COLI. HYPOTHETICAL ABC TRANSPORTER PERMEASE PROTEIN YDEZ. | ||
| OS014177_at | YCKJ_BACSU P42200 BACILLUS SUBTILIS. PROBABLE AMINO-ACID ABC TRANSPORTER PERMEASE PROTEIN. | ||
| OS022558_i_at | R104_SACPA Q92378 SACCHAROMYCES PARADOXUS (YEAST). MEIOTIC RECOMBINATION PROTEIN REC104. | ||
| OS012669.1_at | gi|3044212| acyl-CoA oxidase [Arabidopsis thaliana] | ||
| OS013723_at | GLGC_BACCL P30522 BACILLUS CALDOLYTICUS. GLUCOSE-1-PHOSPHATE ADENYLYLTRANSFERASE (EC 2.7.7.27) (ADP-GLUCOSESYNTHASE) (ADP-GLUCOSE PYROPHOSPHORYLASE) (FRAGMENT). | ||
| OS022194_at | NEPU_THEVU Q08751 THERMOACTINOMYCES VULGARIS. NEOPULLULANASE (EC 3.2.1.135) (ALPHA-AMYLASE II). | ||
| OS009538_at | gi|4490321| nitrate transporter [Arabidopsis thaliana] | ||
| OS014390_at | gi|9294650| lipase/acylhydrolase; myrosinase-associated protein [Arabidopsis thaliana] | ||
| OS003885_at | gi|4115931| contains similarity to Guillardia theta ABC transporter (GB:AF041468) [Arabidopsis thaliana] | ||
| OS009777.1_at | gi|8570057| ESTs AU056822(S20908), C26441(C12328), C28477(C61243) correspond to a region of the predicted gene.~Arabidopsis thaliana putative acyl-coA dehydrogenase (AF049236) [Oryza sativa] |
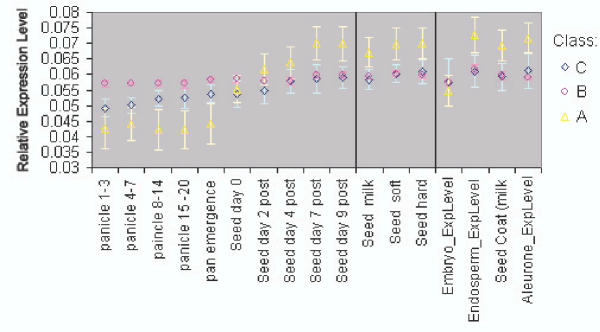
The selection of grain filling genes by SVD pattern association, when compared to visual selection relying on clustering, returns genes with expression profiles more consistent with our grain-filling ideal. The expression profiles for genes in the control set found by one pattern or another were averaged (Class A). A similar treatment was given to those not found (Class B), and separately, those not in the control set but highly ranked by u2 (Class C). Classes A, B, and C were plotted together to compare their expression profiles, Figure 4. Class B shows little differential expression when compared with C and A. A shows differential expression that corresponds with our ideal for grain filling expression profiles. Class C also shows grain-filling-like differential expression, but with lower magnitude of variation.
Figure 4.
Plots of average, transformed expression levels for genes which both hierarchical clustering and SVD agreed were grain filling (Class A), genes not selected by the SVD method (Class B), and novel genes selected via SVD analysis (Class C). Error bars are shown for one standard deviation.
The detailed classification of the grain filling related nutrient partitioning genes was examined and compared between the two studies. It is clear that the previously selected grain-filling genes in our control set comprised four different gene clusters (Figures 5,6). In Table 2 (see Additional file: 1) the genes are ordered according to that in the clustering. Among them, ninety-two percent of the genes in cluster node 439 were classified by u2 as grain filling genes, while the other three clusters had approximately 42% of their genes classified as grain filling genes. These three clusters differ from the first in purity of signal. The three clusters with fewer matches seem to exhibit a mixture of expression patterns, while the first cluster does so to a much lower extent.
Figure 5.
Genes, identified in Zhu et al. as potential grain filling genes, grouped by node from their hierarchical clustering. It shows the cluster with genes up-regulated during the grain filling process. The detailed description of the genes is listed in Table 2 (Additional file 1).
Figure 6.
Potential grain filling genes grouped by node from their hierarchical clustering. It shows three clusters with genes up-regulated in specific grain samples. The detailed description of the genes is listed in Table 2 (Additional file 1).
The involvement in grain filling of the novel set (C) of genes is supported by the over-representation of the grain filling cis-element. A survey of cis elements of the C set of genes shows that they have more in common with grain filling genes than the unselected genes. The element AACA was found to be over represented among grain-filling genes in earlier work by Zhu et al., and is more abundant among the novel genes. AACA was part of the motif CAACA, which occurred in 12 of the 14 promoters. This motif was described as the RAV1 AAT binding consensus sequence of Arabidopsis thaliana transcription factor, RAV1 [8]. AACA was also found in an E4-TATA Box element contained in 6 of the 14 promoters [9]. Looking for AACA in the set of unselected genes, it was found in the motif TAACAAA, which only occurred in 2 of the 8 promoters. This motif was described as a binding site for GAMYB [10]. Considering the similarities in expression pattern and promoter elements between the novel genes and the previously identified grain filling genes, the novel set of genes is likely to be involved in grain filling as well.
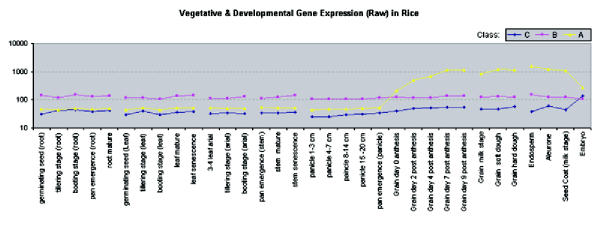
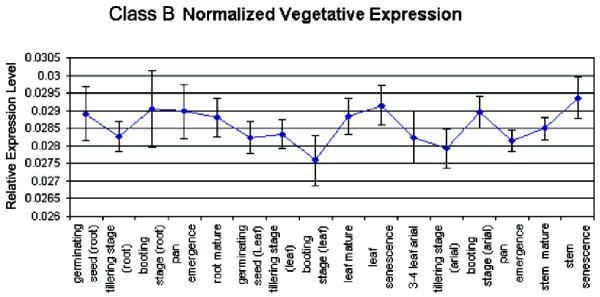
To characterize the function of genes that were classified differently by each method (Class B), we analyzed their expression patterns in the vegetative growth phase and their promoter sequences. Among the vegetative growth samples, this set of genes is generally expressed at a higher level than either the novel set (Class C) or the grain filling set (Class A) – both of which have very similar un-normalized expression levels. Figure 7 illustrates the un-normalized average expression levels for each set. Closer inspection of the differences between expression levels of these genes in the vegetative growth samples reveals a slight elevation in expression for non-photosynthetic samples, including all root samples, and senescence stem and senescence leaf samples (Figure 8). A cis element unique to this set of genes is AACCAA, and may explain this bias. It was found in 5 of the 8 promoters from this set, but was not present among the other genes with a grain-filling pattern. This light-repressed promoter element was previously found to have higher DNA binding activity in etiolated plants but much lower activity in green plants [11].
Figure 7.
Average un-normalized gene expression levels for novel grain filling genes (Class C), misclassified genes (Class B), and agreed-upon grain filling genes (Class A). Samples are grouped by tissue type: root, leaf, arial, and stem; developmental series in panicle and grain; general grain phases; and seed organ.
Figure 8.
Average normalized expression levels during vegetative growth samples for the misclassified set of genes. A dark responsive cis-element is present in most of their promoters. Root and etiolated samples such as stem and leaf senescence are elevated.
Discussion
Our association of genes to singular vectors was not exclusive. A gene's expression profile can be described as linear combination of each right singular vector, and said gene can be associated with those vectors that contribute the most. Clustering provides nested clusters with mutual exclusivity among clusters at a given correlation threshold. When there are genes with low intensity patterns, clustering can result in groups with a mixture of patterns and low internal correlation. Sets of genes strongly correlated with a particular singular vector will have greater internal correlation. Given these differences, both methods agree on a majority of grain filling genes, which had very significant differential expression during grain development. This could be expected as both clustering and SVD seek to minimize the squared error.
The area of disagreement between methods concerned genes with low differential expression. They were listed as grain filling in the control set but were not selected with the SVD method. These unselected genes are not any less important than those identified with SVD, they simply exhibit small changes in expression level during grain filling – changes that may be insignificant due to the presence of errors. In many cases regulatory genes have small changes in expression level, while target genes further along in the cascade have larger changes. The increased sensitivity of pattern detection will improve our ability to extract these target genes before using them to search for regulatory genes with other methods. Almost all of these genes with a weak grain-filling pattern were originally part of hierarchical clustering nodes with very low internal correlation (average pair-wise correlation). A more stringent classification that excluded such nodes would have resulted in a more concordant set of gene expression profiles.
The unselected set might be misclassified in the earlier study [1], possibly carrying out roles important in the grain filling process but sites physically distant from the grain body itself. Their expression profiles did not follow a pattern similar to that of known grain filling genes, and during vegetative growth, their expression levels are consistently higher. These genes, in general, lacked promoter elements common to grain filling genes. They also had conserved promoter elements that were not found in grain filling genes. If functional in rice, their light repressed elements would explain the higher expression in root, which grows in dark conditions. It is possible that the higher expression levels observed during stem and leaf senescence are due to suppression of photosynthesis activity. Rice is a monocot plant and there are portions of stem that are etiolated due to blockage of light from permanent leaf encirclement. During senescence, the light sensitivity of stem and leaf is biochemically reduced. This may result in a de facto etiolated state also explaining the elevated gene expression. The misclassification of these genes was due to the combined effects of including nodes with low internal correlation and information loss from hierarchical clustering. It should also be noted that compared to the set of novel genes and the set of agreed-upon genes, a greater fraction, 0.3 vs. 0.107 & 0.115 respectively, of these unselected genes have potentially unreliable probe sets. This unreliability stems from the inability to compile a full set of unique probes for these genes, and is indicated by the Probe Set ID suffixes 'r' and 'i', indicating sequences for which it was not possible to pick a full set of unique probes or for which there are fewer than fifteen probes.
When using hierarchical clustering to classify gene expression profiles, there are several drawbacks to consider. Generally, microarray data is information-rich, with multiple dimensions of variability. The ordering of genes produced by hierarchical clustering reduces this variability to a single dimension, which may not accurately reflect the differences between expression profiles. As a result, closeness in this single dimension may not reflect similarities occurring in a higher dimensional space. These factors impact difficult-to-classify profiles more significantly. In Zhu et al. (2003) [1] this lead to grain-filling genes, with less obvious expression profiles, being grouped with a mixture of other profiles, resulting in the selection of unreliable patterns over better candidates. The SOM ordering used to influence the hierarchical clustering ordering helped with this problem, but there are other ways to improve classification accuracy. To avoid these pitfalls, a more stringent selection criterion could have been used with the hierarchical clustering results to build a core set, followed by a profile ranking based on correlation with the core set. The second round of selection would help to recover profiles with a weaker pattern, which would have been randomly ordered by hierarchical clustering. Another way to avoid these pitfalls would be to take advantage of the many "fuzzy" clustering algorithms, which generate non-exclusive assignment of genes to clusters [12,13].
While exploring this use of SVD, there were a few caveats learned which concern the contribution of noise to the pattern spectrum. The matrix that is decomposed by SVD is usually a dissimilarity matrix like the covariance matrix. The singular values, wi, are typically used to indicate the significance of each right singular vector to the dataset. The first n vectors that cumulatively account for greater than 90% of the dataset's variation are sometimes used to describe the dataset and reduce its dimensionality. The rest of the right singular vectors are then considered noise. This interpretation is not always correct and should be tempered by a study of the right singular vectors themselves. In the situation where the dataset contains significant additive noise or where the means are not centered, the previous assumption could result in one ignoring informative patterns exhibited by the right singular vectors with relatively low singular values. The primary signal would represent this noise (unconformable pattern) and mask the other patterns. An observation of the primary right singular vector's pattern would indicate a relatively constant level for all samples, poorly classifying experiments or correlating with differentially expressed genes. Although possible, there was no need to filter out strong noise from the dataset and recalculate the SVD. This condition was dealt with by focusing on right singular vectors that correlate with our conceptual grain-filling pattern, regardless of their singular value's magnitude. These "grain filling" right singular vectors were then used to classify the genes in our dataset. In fact, a classification of genes using the right singular vector with the largest singular value was of low quality.
As the coefficients for each right singular vector are used to classify genes and the genes in each class should ideally have coefficients different from genes in other classes, the challenge to identify a vector that produces a good classification can be simplified by measurement of the entropy for each vector's coefficient distribution. Vectors with the lowest entropy, even if they have a small singular value, have the most ordered coefficient distribution and may be quite useful in classifying genes into distinct groups. We will follow up on this idea in future applications of SVD to RNA dynamics.
SVD can be used to reduce the dimensionality of a data set, but our method uses the singular vectors generated by the decomposition to identify patterns that may relate to grain filling in rice. In this way, we attempt to avoid overlooking any dimensions of expression profile variance. A gene ranking based on similarity to interesting feature-vectors allows recovery of profiles with weaker but relevant grain filling patterns. This method selected genes with greater differential expression than the questionable set presented by clustering. The newly identified genes are important because they represent genes that have a stronger pattern of grain filling, which were not easily visually identified from the hierarchical clustering. It is likely that if the previous method only relied on SOM, more of these genes would have been identified. SVD provides much information about patterns of variability in a dataset rather than a rigid assignment of genes to clusters. This added perspective, plus the ability to amplify or attenuate specific patterns in the dataset, complements the classifications given by commonly used clustering techniques.
Conclusions
We conclude that SVD is a useful alternative method that complements widely used clustering methods for studying function of genes. The SVD identified grain-filling related genes, providing additional, valuable candidate genes for improving grain composition and yield.
Methods
Datasets used
The dataset comprised expression levels of 491 genes in 33 samples, with emphasis on the 17 samples directly related to grain filling [1]. The complete dataset used is available at http://www.blackwell-science.com/products/journals/suppmat/PBI/PBI006/PBI006sm.htm. Based on their sequence annotation and functional classification [14], the 491 genes were selected because their products are presumably involved in or associated with three major pathways of nutrient partitioning: the synthesis and transport of fatty acids, carbohydrates, and proteins. The 17 grain filling related tissue samples include panicle 1–3 cm, panicle 4–7 cm, panicle 8–14 cm, panicle 15–20 cm, seed 0 day, seed 2 day, seed 4 day, seed 7 day, seed 9 day, seed (soft dough), seed (hard dough), embryo, endosperm, seed coat (milk stage), aleurone, and seed (milk stage). A complete description of the experimental protocols used to generate this dataset can be found in Zhu et al (2003) [1].
Data normalization
In our matrix A' each row corresponded to a different gene and each column corresponded to one of 17 different conditions. The aij cell in A' was the expression level of gene i under condition j. The data in A' was transformed to the n × m matrix A according to the protocol in Zhu et al. (2002) [1]. During this transformation values of aij less than 5 were set equal to 5 and log2-transformed. Next, the expression vectors were median-centered and normalized such that the sum of squares for each expression vector was equal to one. In efforts to validate our results, we also investigated gene expression level in a wider range of samples, including the 17 mentioned above, totaling 33 samples. The normalization applied to this broader set was the same as that described for the set of 17, above. Note that the difference in sample number will affect the median centering and normalization steps, making smaller deviations from the median less obvious.
Data decomposition
The SVD theorem (Press et al., 1992) is stated in eq1 [15]. U (n × q) and V (q × q) contain orthogonal vectors, and W (q × q) is a diagonal matrix of coefficients or singular values,
A = UWVT [1]
denoted w1, w2, ... wq. q is the rank of A, and is generally the smaller of the two dimensions n and m. The decomposition was performed using the commercial software package S-PLUS™ (Insightful Co., Seattle, WA) according to Golub and van Loan (1996) [16]. The rows of VT, or V transposed, are the right singular vectors, vj. Each right singular vector, alone or in combination with other vectors, describes a pattern of variation in A that could be indicative of a biological process. The columns of U are the left singular vectors, uj. Each coefficient, uij, indicates the relative contribution of pattern vj to the expression profile of gene i. The singular value wi indicates the relative contribution of pattern vi to all gene expression patterns in A. The square of the singular values divided by the sum of singular values squares defines the relative variance for each singular value. This relative variance indicates how much of the variance in A is explained by a particular singular vector. The expression profile of any gene can be written as a linear combination of these singular vectors and the singular values in W.
Pattern recognition
The right singular vectors that match our preconception of a grain filling pattern of expression, for example, low expression during panicle development and increasing expression during grain development, were identified after A was decomposed. For each interesting pattern, vj, the genes, gi, were sorted by uij and the top 80th percentile were selected. These top scorers were compared to 98 genes previously identified as grain filling-related nutrient partitioning genes by Zhu et al., which they used as a template for selecting other genes and transcription factors involved in grain filling. In Zhu et al., the 98 genes were manually selected by visualization of a hierarchical clustering informed by a SOM grouping of the 491 potential nutrient partitioning genes (Figures 5,6). The quality of the ordering given by uj was assessed by plotting the percent of the 98 found having a percentile greater than p for all p less than 1. Similarly, the percent of those genes selected that are in the set of 98, for all p, is plotted.
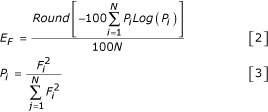
We observed the entropy (E) of various distributions during our study, and the generalized formula we used is shown in Equations 2 and 3 for a vector F, containing N scalars.
Promoter analysis
After genes were classified, their promoter sequences were identified to check if pattern similarity could be related to conserved cis elements. The statistically significant elements were identified with a PERL script and annotated with the PLACE database [17]. The PERL script identified motifs among promoter sequences for a given set of genes. Those elements that matched to an annotated cis-acting regulatory DNA element from the PLACE database were then presented. We limited our investigation to elements located within 2 KB of the transcriptional start site and that had an e-value less than 3E-02. At the time of publication, not all probe sets could be associated with high quality assembled upstream sequences.
Authors' Contributions
AA participated in the design of the study, carried out the computational analyses and drafted the manuscript. MH contributed to the promoter analysis. WC participated in the design of the study and discussion. TZ conceived of the study, and participated in its design and coordination. All authors read and approved the final manuscript.
Supplementary Material
Contributor Information
Abraham Anderson, Email: aanderson@diversa.com.
Matthew Hudson, Email: mhudson@diversa.com.
Wenqiong Chen, Email: wenchen@diversa.com.
Tong Zhu, Email: tong.zhu@syngenta.com.
References
- Zhu T, Budworth P, Chen W, Provart N, Chang HS, Guimil S, Estes B, Zou G, Wang X. Transcriptional Control of Nutrient Partitioning During Rice Grain Filling. Plant Biotechnol J. 2003;1:59–70. doi: 10.1046/j.1467-7652.2003.00006.x. [DOI] [PubMed] [Google Scholar]
- Eisen MB, Spellman PT, Brown PO, Botstein D. Cluster analysis and display of genome-wide expression patterns. Proc Natl Acad Sci USA. 1998;95:14863–14868. doi: 10.1073/pnas.95.25.14863. [DOI] [PMC free article] [PubMed] [Google Scholar]
- Kohonen T. Self-Organization and Associative Memory. 2. Springer-Verlag Telos; 1989. [Google Scholar]
- Holter NS. Fundamental patterns underlying gene expression profiles: Simplicity from complexity. Proc Natl Acad Sci USA. 2000;97:9409–9414. doi: 10.1073/pnas.150242097. [DOI] [PMC free article] [PubMed] [Google Scholar]
- Alter O, Brown PO, Botstein D. Singular value decomposition for genome-wide expression data processing and modeling. Proc Natl Acad Sci USA. 2000;18:10101–10106. doi: 10.1073/pnas.97.18.10101. [DOI] [PMC free article] [PubMed] [Google Scholar]
- Dewey GT, Galas DJ. Dynamic models of gene expression and classification. Funct Integr Genomics. 2001;1:269–278. doi: 10.1007/s101420000035. [DOI] [PubMed] [Google Scholar]
- Everitt BS, Dunn G. Applied Multvariate Data Analysis. Arnold, London; 2001. [Google Scholar]
- Kagaya Y, Ohmiya K, Hattori T. RAV1, a novel DNA-binding protein, binds to bipartite recognition sequence through two distinct DNA-binding domains uniquely found in higher plants. Nucleic Acids Res. 1999;27:470–478. doi: 10.1093/nar/27.2.470. [DOI] [PMC free article] [PubMed] [Google Scholar]
- Cordes S, Deikman J, Margossian LJ, Fischer RL. Interaction of a developmentally regulated DNA-binding factor with sites flanking two different fruit-ripening genes from tomato. Plant Cell. 1989;1:1025–1034. doi: 10.1105/tpc.1.10.1025. [DOI] [PMC free article] [PubMed] [Google Scholar]
- Gubler F, Kalla R, Roberts JK, Jacobsen JV. Gibberellin-regulated expression of a myb gene in barley aleurone cells: evidence for Myb transactivation of a high-pl alpha-amylase gene promoter. Plant Cell. 1995;7:1879–1891. doi: 10.1105/tpc.7.11.1879. [DOI] [PMC free article] [PubMed] [Google Scholar]
- Degenhardt J, Tobin EM. A DNA binding activity for one of two closely defined phytochrome regulatory elements in an Lhcb promoter is more abundant in etiolated than in green plants. Plant Cell. 1996;8:31–41. doi: 10.1105/tpc.8.1.31. [DOI] [PMC free article] [PubMed] [Google Scholar]
- Theodoridis S, Koutroumbas K. Pattern Recognition. Academic Press, San Diego, CA; 1999. [Google Scholar]
- Gasch AP, Eisen MB. Exploring the conditional coregulation of yeast expression through fuzzy k-means clustering. Genome Biol. 2002;3:research0059.1–0059.22. doi: 10.1186/gb-2002-3-11-research0059. [DOI] [PMC free article] [PubMed] [Google Scholar]
- Goff SA, Ricke D, Lan TH, Presting G, Wang R, Dunn M, Glazebrook J, Sessions A, Oeller P, Varma H, et al. A Draft Sequence of the Rice Genome (Oryza sativa L. ssp. Japonica) Science. 2002;296:92–100. doi: 10.1126/science.1068275. [DOI] [PubMed] [Google Scholar]
- Press WH, Teukolsky SA, Vetterling W, Flannery BP. Numerical recipes in C: the art of scientific computing. 2. Cambridge University Press, Cambridge; 1992. [Google Scholar]
- Golub G, Van Loan C. Matrix Computations. Johns Hopkins University Press, Baltimore, MD; 1996. [Google Scholar]
- Higo K, Ugawa Y, Iwamoto M, Korenaga T. Plant cis-acting regulatory DNA elements (PLACE) database. Nucleic Acids Res. 1999;27:297–300. doi: 10.1093/nar/27.1.297. [DOI] [PMC free article] [PubMed] [Google Scholar]
Associated Data
This section collects any data citations, data availability statements, or supplementary materials included in this article.


