Abstract
GenePublisher, a system for automatic analysis of data from DNA microarray experiments, has been implemented with a web interface at http://www.cbs.dtu.dk/services/GenePublisher. Raw data are uploaded to the server together with a specification of the data. The server performs normalization, statistical analysis and visualization of the data. The results are run against databases of signal transduction pathways, metabolic pathways and promoter sequences in order to extract more information. The results of the entire analysis are summarized in report form and returned to the user.
INTRODUCTION
Recent years have seen an explosion in the number of published methods for microarray data analysis (reviewed in 1). While many of these methods compete for the best way to analyse the same data, a general consensus can be extracted: (i) normalization should use signal-dependent transformation of data; (ii) expression should be estimated using a global background and not using a locally estimated background; (iii) a statistical analysis that takes into account replicate variation and multiple testing must be performed.
Thus, it is possible to devise a general analysis strategy, using proven peer-reviewed methods, that will be appropriate for many, if not most, microarray data. Such a general analysis strategy can be automated, saving the user time. In addition, the analysis can be followed up with further bioinformatic analysis of the resulting genes found to be differentially expressed with statistical significance. Standard chips, such as those offered by Affymetrix, can be pre-annotated with various databases to help the biological interpretation of the results.
Other efforts at automating analysis and pre-annotating chips like NetAffx (2) and ExpressionProfiler (3) are available on the web. What is novel about our approach is that the entire analysis from submission of raw data to generation of a formatted report is performed automatically without user intervention. This report can then be a starting point for further analysis tailored to the problem at hand or it can be used to suggest experiments for verification of the results. GenePublisher does not check for spatial bias on the array surface. That should be checked during image analysis and processing.
The purpose of GenePublisher is not to replace thorough explorative analysis that has been tailored to the biological problem and the organism used. Automatic analysis cannot compete against this. Rather, it is to offer a rapid first analysis that will help both the novice and experienced user in the interpretation and planning of further experiments.
MATERIALS AND METHODS
Initial processing
The web server takes as input gzip (www.gzip.org) compressed CEL files from an Affymetrix experiment or a ‘genetable’ of raw image analysis intensities from a number of experiments performed with other array equipment [referred to as spot quantitation matrix in the MIAME standard (4) and defined there as a tab-delimited ascii file].
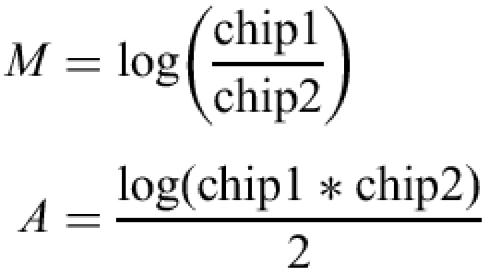
The initial data analysis including normalization, background correction, expression index calculation and visualization of chip-to-chip variation is performed using the affy package of Bioconductor (www.bioconductor.org, manuscript in preparation). By default, qspline (5) is used for normalization, Li-Wong (6) used for expression index calculation, and a global background is calculated using bg.adjust in the affy package. For genetables, only qspline normalization is performed. M versus A plots are used to visualize chip-to-chip variation before and after normalization:
where log is the logarithm base 2.
Statistical analysis
After initial processing, the R statistical programming environment is used to perform a statistical analysis. Principal component analysis and hierarchical clustering is performed on the chips to visualize any obvious structure in the data. A t-test is performed on each gene if the user has specified only two categories whereas an analysis of variance is performed if the user has specified more than two categories. After a Bonferroni correction for multiple testing with a user-specified cutoff, the list of genes with significant differential expression is output, and log fold changes calculated. A correspondence analysis (7) is performed between significant genes and experiments, attempting to capture associations between particular genes and experiments.
Classifier
A general classifier is built from the data and the categorization of the data given by the user in the input. A K nearest neighbor classifier, available as knn.cv as part of the R project, is run with a leave-one-out cross-validation in order to estimate its performance. Distance between neighbors is calculated as Euclidian distance between chips, each consisting of as many measurements as there are probe sets on the chip. So the Euclidian distance is calculated in multidimensional space where the number of dimensions equals the number of genes on the chip. To avoid overfitting of the classifier, no selection of genes is performed. No training or selection of parameters is performed with this method, except for the choice of K neighbors. GenePublisher by default runs one classifier for K=1 and one classifier for K=3. The numbers of K=1 and K=3 are chosen to accommodate small datasets with few replicates among each category and to avoid vote ties which could result from an even number of K.
Annotation
If the chip specified is an Affymetrix chip already implemented in GenePublisher, the list of differentially expressed genes is annotated with description of the genes and links to the LocusLink database, as well as Gene Ontology (www.geneontology.org) annotation (8). If the chip used is not standard, any annotation included in column 2 of the genetable will be used instead.
Linking to other databases
The genes found significant in the statistical analysis are linked to a number of databases in order to aid the biological interpretation of the results. Any genes matching the KEGG database of metabolic pathways (9) are shown as well as genes matching the TRANSPATH database of signal transduction pathways (10). For genes participating in more than one pathway, only one pathway is shown.
For those genes where a gene ontology number has not been assigned and the function has not been inferred by homology to another protein, an attempt is made at predicting the function using the ProtFun (11) method. ProtFun predicts the function, not based on homology, but based on properties of the protein sequence as well as predicted features such as post-translational modification. This analysis requires that the full amino acid sequence is available. For all genes on a chip, those labeled ‘unknown’ or labeled as originating from a cDNA sequencing project are extracted from GenBank, and the amino acid sequence parsed from the GenBank entry. ProtFun is then used to predict the function based on the parsed amino acid sequence.
Clustering
ClustArray, a Unix command-line tool for clustering of array data was implemented in C++. It allows different choices of clustering algorithm and distance metric. GenePublisher by default runs a hierarchical clustering based on the WPGMA method (12) on the top ranking genes. A K-means clustering is also run on the top ranking genes. The optimal number of clusters K is chosen as the one which results in the smallest ratio of within-cluster to between-cluster variance. Previously, figure of merit has been used to select K (13). The distance between genes is calculated as vector angle distances [non-centric correlation coefficient (14)] of log fold changes:
where ai is the log fold change of gene a in experiment i relative to the average of its expression in the control experiments. ClustArray automatically chooses a color scale to capture the spectrum of variation in the data.
Promoter databases
A database of human upstream regions (5000 bp) was created using the annotated genes in ENSEMBL [version 9.30 (15)] using the BioPython package (www.biopython.org) where each sequence was screened and masked for interspersed repeats with RepeatMasker (Smit,A.F.A. and Green,P., http://ftp.genome.washington.edu/RM/RepeatMasker.html). The upstream regions were matched to Affymetrix human chips (HU6800, HG_U95Av2 and HG-U133A) via the accession numbers listed for each probeset.
A promoter database for Saccharomyces cerevisiae was constructed for the Affymetrix expression chip YG_S98 which contains probe spots for ∼9000 different sequences. From the Affymetrix documentation, which includes references on each of the 9336 probe sets on the chip, a total of 8475 sequences were identified as belonging to S.cerevisiae choromosomes I to XVI. Of the remaining 861 sequences most are either mitochondrial sequences or sequences from other organisms, included on the chip for reference purposes. The 500 bp region located directly upstream from each of the 8475 sequences (most often the open reading frame), was extracted from GenBank entries NC_001133 through NC_001148. This resulted in a database containing 8475 upstream regions, of which 8190 were unique. The redundancy was primarily caused by those few instances in which several probesets exist for the same sequence.
Promoter analysis
Promoters are scanned for known and unknown regulatory elements using three different methods that use different strategies:
The software program saco_ patterns (16) identifies patterns significantly overrepresented in the upstream regions relative to a background set of upstream regions from the same organism. saco_ patterns looks for conserved (identical) patterns in sequences, it does not allow for degeneration of the pattern.
The Gibbs sampler (17) looks for overrepresentation of degenerate patterns which it tries to capture with a weight matrix description. The Gibbs sampler starts with a new random matrix every time and is non-deterministic, meaning that it may give different results every time it is run. A Python script is used to compare the frequency of occurrence of the resulting matrices in the positive set compared to a negative background set which consists of all other upstream regions for the organism. The P-value of overrepresentation in one set against the other is calculated using the hypergeometric distribution.
The known transcription factor binding sites in the public version of the TRANSFAC database (18) are matched against the same upstream regions. Factor matrices with hits more than 95% of the maximal score of the matrix are recorded.
All of the above algorithms were embedded in Python, gawk and shell scripts that perform the necessary database handling, statistical analysis and result table generation.
LaTeX report generation
The results of all the analysis methods are summarized in a LaTeX report automatically formatted based on the analysis performed and parameters chosen. The report is converted to Portable Document Format (PDF) and returned to the user via the web interface. Also returned to the user is a table of normalized intensities and P-values of all genes in all experiments.
Implementation
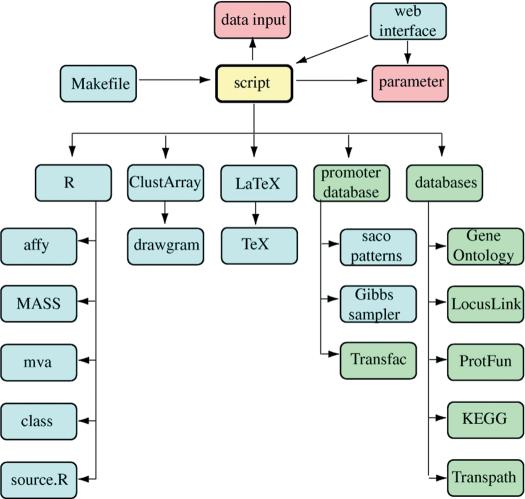
GenePublisher version 1.0 was implementated under SGI Irix in a Unix Bourne shell script that integrates individual modules implemented in R, C, C++, gawk, Perl and Python. The GenePublisher script reads a parameter file (Fig. 1) and can be run directly from the command line, from a Unix Makefile that allows partial execution or from a web server. The Makefile command ‘make report’ performs a complete analysis, but the analysis can also be broken down into smaller targets: ‘make checkfiles normalization bonferroni cluster annotation protfun KEGG transpath promoter latex’. Makefile, script, parameter, ClustArray and saco_patterns are available from the author upon request. They require installation and customization of all third party packages and databases by an experienced Unix system administrator.
Figure 1.
Overview of the GenePublisher system. The shell script calls all other programs and databases and coordinates their execution. The script reads a parameter file with user adjustable parameters and reads the data input. The script, in turn, can be called via a Makefile or via a web interface.
RESULTS
An example of a report generated from a set of chips from an HIV infection experiment [three replicate HIV-infected cultures of T cells versus three replicate control cultures without HIV (3)] is available for download from the server web site. Selected output is shown here as well.
Classifier
The results of leave-one-out cross-validation of two K nearest neighbor classifiers are shown in Table 1. The first classifier uses K=1, the second uses K=3. Classifier performance is, in both cases, 100%. The ability to classify a sample from an in vitro cell culture as being infected with HIV or not is of no practical interest, but if the samples had been taken from cancer patients versus normal patients, or from different stages of a cancer, the automatically built classifier would have given an interesting indication of the potential for classifying such samples using the simplest classifier possible. Because no adjustment of parameters takes place in this classifier, it is not unreasonable to use leave-one-out cross-validation, which otherwise can be a deceptive test of an overfitted model.
Table 1. Predictions of the K nearest neighbor classifier.
| Chip (K=3) | Assigned category | Predicted category (K=1) | Predicted category |
|---|---|---|---|
| Ctrl1 | A | A | A |
| Ctrl2 | A | A | A |
| Ctrl3 | A | A | A |
| HIV1 | B | B | B |
| HIV1 | B | B | B |
| HIV1 | B | B | B |
KEGG and TRANSPATH
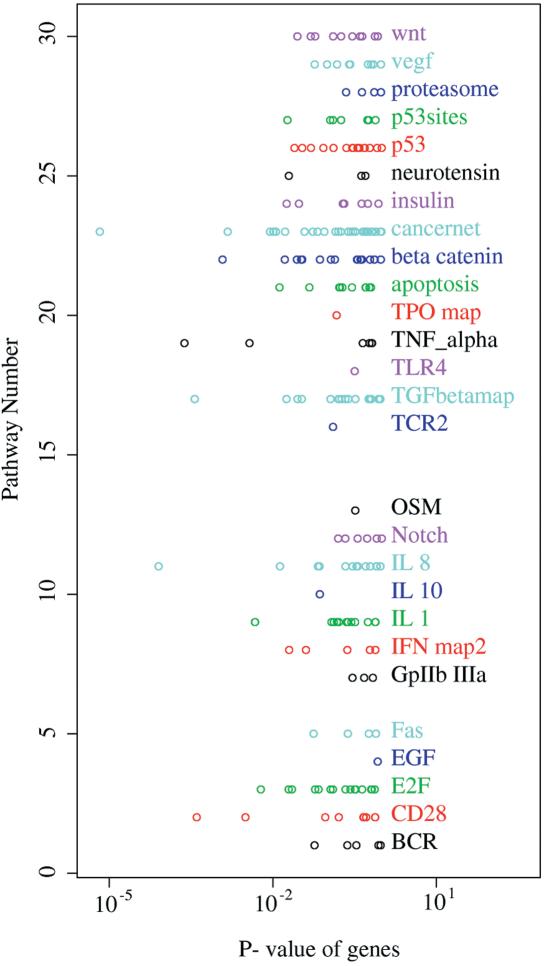
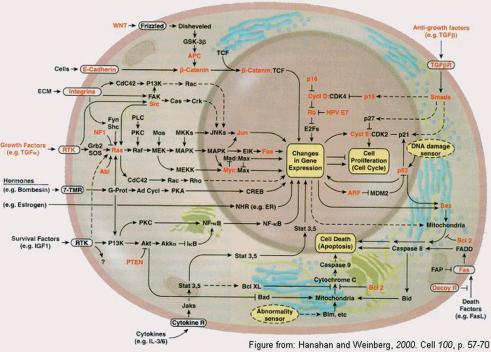
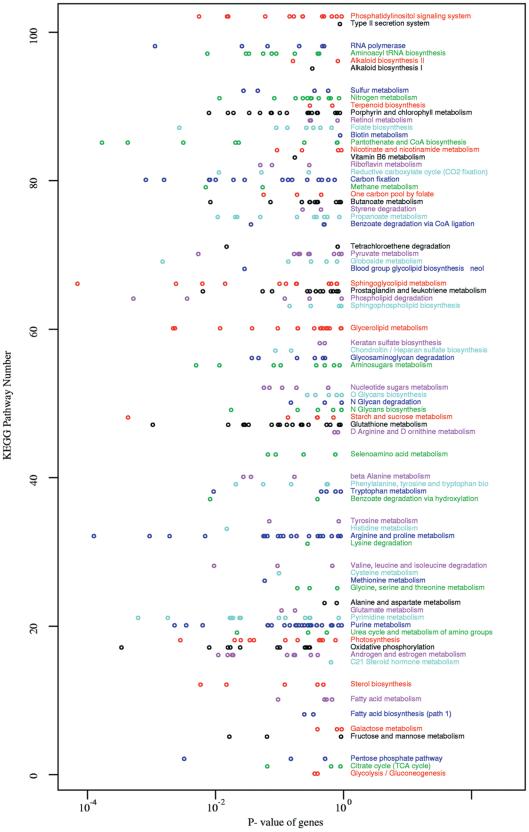
The top ranking genes above the significance cutoff are searched against local installations of the public KEGG and TRANSPATH databases of metabolic pathways and signal tranduction pathways. The purpose of this search is to report if one or more components of a pathway are significantly up- or downregulated. The results of this analysis is shown in table format (see report on server web site). In addition, all genes on the chip are searched against the same pathways and plotted according to their P-value and the pathway in which they occur. The purpose of this is to reveal whether more than one gene in a pathway is significantly affected in the experiment. Some of the affected genes may have a P-value just below the cutoff. Especially for metabolic pathways in bacteria, where several genes may be regulated in coordination, this can be a very useful tool. For the experiment used in this report, HIV infected T cells, the most significantly affected signal transduction gene is the downregulation of Fas receptor involved in apoptosis (cancer pathway, Figs 2 and 3). The most significantly affected metabolic pathway (Fig. 4) is sphingoglycolipid metabolism, where the gene encoding arylsulfatase is upregulated.
Figure 2.
A list of all signal transduction pathways in which genes were found on the chip. The x-axis shows the unadjusted P-value of each gene assigned to each pathway. Low P-values indicate differential expression. Pathways with differential expression should stand out from the background level.
Figure 3.
The cancernet pathway from TRANSPATH. The significantly regulated Fas receptor is found in the lower right corner of the cell.
Figure 4.
A list of all KEGG pathways in which genes were found on the chip. The x-axis shows the unadjusted P-value of each gene assigned to each pathway. Low P-values indicate differential expression. Pathways with differential expression should stand out from the background level.
Promoter analysis
A K-means clustering of the top ranking significant genes is performed for different values of K, in order to identify the clustering that optimizes the ratio of between-cluster variance to within-cluster variance. For the number of clusters, K, with the highest ratio, all genes in each cluster are analysed in their upstream regions in order to identify conserved elements.
Three tables are generated, one consisting of the output of saco_patterns, if any, one consisting of the output from the Gibbs sampler (Table 2) and one showing matches to the TRANSFAC database.
Table 2. Weight matrices describing Gibbs patterns in upstream regions of K-means clusters.
| Base | 1 | 2 | 3 | 4 | 5 | 6 | 7 | 8 | 9 | 10 | 11 |
|---|---|---|---|---|---|---|---|---|---|---|---|
| Cluster number 1 | |||||||||||
| HYP -2.869441 i=6, m=748, N=4428, n=19 | |||||||||||
| Consensus: GAGGCTGAGGC | |||||||||||
| Found in genes 56 49 49 22 89 27 27 44 44 44 44 | |||||||||||
| A | 0 | 94 | 0 | 0 | 0 | 13 | 0 | 88 | 0 | 0 | 0 |
| C | 0 | 0 | 0 | 6 | 94 | 0 | 0 | 0 | 0 | 0 | 69 |
| G | 100 | 6 | 100 | 94 | 0 | 19 | 100 | 13 | 100 | 100 | 0 |
| T | 0 | 0 | 0 | 0 | 6 | 69 | 0 | 0 | 0 | 0 | 31 |
| Cluster number 2 | |||||||||||
| HYP -2.594074 i=11, m=941, N=4447, n=38 | |||||||||||
| Consensus: GAGGCTGAGGC | |||||||||||
| Found in genes 46 46 5 5 5 68 9 9 9 90 90 84 84 51 51 14 14 29 54 54 80 | |||||||||||
| A | 0 | 83 | 13 | 0 | 0 | 3 | 10 | 100 | 0 | 0 | 0 |
| C | 3 | 0 | 0 | 0 | 93 | 20 | 3 | 0 | 0 | 7 | 67 |
| G | 97 | 17 | 87 | 100 | 0 | 37 | 87 | 0 | 100 | 90 | 0 |
| T | 0 | 0 | 0 | 0 | 7 | 40 | 0 | 0 | 0 | 3 | 33 |
The hypergeometric sample statistics is given as the logarithm of the P-value, where i is the number of times the matrix matches the positive set above threshold, m is the number of times the matrix matches the negative set above threshold, and N and n are the sizes of the negative and positive sets, respectively. For each pattern, the genes in which it was found are listed.
Acknowledgments
ACKNOWLEDGEMENTS
We are grateful to the R project and Bioconductor Consortium for making such useful software available to the public. This work was funded by the Danish National Research Foundation, the Danish Biotechnology Instrument Center and the Wallenberg Foundation.
REFERENCES
- 1.The Chipping Forecast II (2002) Nature Genet., 32. [Google Scholar]
- 2.Liu G., Loraine,A.E., Shigeta,R., Cline,M., Cheng,J., Valmeekam,V., Sun,S., Kulp,D. and Siani-Rose,M.A. (2003) NetAffx: Affymetrix probesets and annotations. Nucleic Acids Res., 31, 82–86. [DOI] [PMC free article] [PubMed] [Google Scholar]
- 3.Brazma A., Parkinson,H., Sarkans,U., Shojatalab,M., Vilo,J., Abeygunawardena,N., Holloway,E., Kapushesky,M., Kemmeren,P., Lara,G.G. et al. (2003) ArrayExpress—a public repository for microarray gene expression data at the EBI. Nucleic Acids Res., 31, 68–71. [DOI] [PMC free article] [PubMed] [Google Scholar]
- 4.Brazma A., Hingamp,P., Quackenbush,J., Sherlock,G., Spellman,P., Stoeckert,C., Aach,J., Ansorge,W., Ball,C.A., Causton,H.C. et al. (2001) Minimum information about a microarray experiment (MIAME)—toward standards for microarray data, Nature Genet., 29, 365–371. [DOI] [PubMed] [Google Scholar]
- 5.Workman C., Jensen,L.J., Jarmer,H., Berka,R., Saxild,H.H., Gautier,L., Nielsen,C., Nielsen,H.B., Brunak,S. and Knudsen,S. (2002) A new non-linear method for reducing variance between DNA microarray experiments. Genome Biol., 3, research0048.1–0048.16. [DOI] [PMC free article] [PubMed] [Google Scholar]
- 6.Li C. and Wong,W.H. (2001) Model-based analysis of oligonucleotide arrays: Expression index computation and outlier detection. Proc. Natl Acad. Sci. USA, 98, 31–36. [DOI] [PMC free article] [PubMed] [Google Scholar]
- 7.Fellenberg K., Hauser,N.C., Brors,B., Neutzner,A., Hoheisel,J.D. and Vingron,M. (2001) Correspondence analysis applied to microarray data. Proc. Natl Acad. Sci. USA, 98, 10781–10786. [DOI] [PMC free article] [PubMed] [Google Scholar]
- 8.The Gene Ontology Consortium (2000) Gene Ontology: tool for the unification of biology. Nature Genet., 25, 25–29. [DOI] [PMC free article] [PubMed] [Google Scholar]
- 9.Kanehisa M., Goto,S., Kawashima,S. and Nakaya,A. (2002) The KEGG databases at GenomeNet. Nucleic Acids Res., 30, 42–46. [DOI] [PMC free article] [PubMed] [Google Scholar]
- 10.Krull M., Voss,N., Choi,C., Pistor,S., Potapov,A. and Wingender,E. (2003) TRANSPATH: an integrated database on signal transduction and a tool for array analysis. Nucleic Acids Res., 31, 97–100. [DOI] [PMC free article] [PubMed] [Google Scholar]
- 11.Jensen L.J., Gupta,R., Blom,N., Devos,D., Tamames,J., Kesmir,C., Nielsen,H., Staerfeldt,H.H., Rapacki,K., Workman,C. et al. (2002) Ab initio rediction of human orphan protein function from post-translational modifications and localization features. J. Mol. Biol., 319, 1257–1265. [DOI] [PubMed] [Google Scholar]
- 12.Sokal R.R. and Sneath,P.H.A. (1963) Principles of Numerical Taxonomy, Freeman, San Francisco. [Google Scholar]
- 13.Yeung K.Y., Haynor,D.R. and Ruzzo,W.L.(2001) Validating clustering for gene expression data. Bioinformatics, 17, 309–318. [DOI] [PubMed] [Google Scholar]
- 14.Eisen M.B., Spellman,P.T., Brown,P.O. and Botstein,D. (1998) Cluster analysis and display of genome-wide expression patterns. Proc. Natl Acad. Sci. USA, 95, 14863–14868. [DOI] [PMC free article] [PubMed] [Google Scholar]
- 15.Hubbard T., Barker,D., Birney,E., Cameron,G., Chen,Y., Clark,L., Cox,T., Cuff,J., Curwen,V., Down,T. et al. (2002) The Ensembl genome database project. Nucleic Acids Res., 30, 38–41. [DOI] [PMC free article] [PubMed] [Google Scholar]
- 16.Jensen L.J. and Knudsen,S. (2000) Automatic discovery of regulatory patterns in promoter regions based on whole cell expression data and functional annotation. Bioinformatics, 16, 326–333. [DOI] [PubMed] [Google Scholar]
- 17.Lawrence C.E., Altschul,S.F., Boguski,M.S., Liu,J.S., Neuwald,A.F. and Wootton,J.C. (1993) Detecting subtle sequence signals: a Gibbs sampling strategy for multiple alignment. Science, 262, 208–214. [DOI] [PubMed] [Google Scholar]
- 18.Matys V., Fricke,E., Geffers,R., Gossling,E., Haubrock,M., Hehl,R., Hornischer,K., Karas,D., Kel,A.E., Kel-Margoulis,O.V. et al. (2003) TRANSFAC: transcriptional regulation, from patterns to profiles. Nucleic Acids Res., 31, 374–378. [DOI] [PMC free article] [PubMed] [Google Scholar]


