

Abstract
Pseudomonas aeruginosa is an opportunistic pathogen that plays a major role in lung function deterioration in cystic fibrosis patients. To identify critical host responses during infection, we have used high-density DNA microarrays, consisting of 1,506 human cDNA clones, to monitor gene expression in the A549 lung pneumocyte cell line during exposure to P. aeruginosa. We have identified host genes that are differentially expressed upon infection, several of which require interaction with P. aeruginosa and the expression of the major subunit of type IV pili, PilA. Differential expression of genes involved in various cellular functions was identified, and we selected the gene encoding the transcription factor interferon regulatory factor 1 (IRF-1) for further analysis. The levels of the IRF-1 transcript increased 3- to 4-fold in A549 cells after adherence by P. aeruginosa. A similar increase of IRF-1 mRNA was observed in A549 cells exposed to wild-type P. aeruginosa when compared to an isogenic, nonpiliated strain. However, this difference was abolished when serum was present during the incubation of bacteria. Exposure of A549 cells to purified P. aeruginosa lipopolysaccharide did not result in a significant increase in IRF-1 mRNA. Although the P. aeruginosa-induced increased IRF-1 expression depends on the presence of bacterial adhesin, our findings do not preclude the possibility that other bacterial products are responsible for IRF-1 activation, which is enhanced by bacterial adherence to cells. These data show that microarray technology can be an important tool for studying the complex interplay between bacterial pathogens and host.
The infection of a host by a pathogenic microorganism initiates complex cascades of events that influence the immediate and long-term outcome of this interaction. One of the most important initial signaling events in the host leads to the mobilization of innate host defense mechanisms, which often results in rapid clearance of the pathogen and limits further spread beyond the site of infection. Specific bacterial products or relatively conserved bacterial factors, such as Gram-negative outer membrane lipopolysaccharides (LPS) or components of the major Gram-positive cell wall may serve as recognition signals at the site of infection. Although it is assumed that the various signaling pathways activated in the host are directed toward the recruitment of defense mechanisms, it is equally likely that some of the host responses activated by the pathogen are ineffective or outright beneficial to survival in the host. A robust but ineffective immune response is typical of several chronic bacterial infections and it is particularly here that one may discover a complex interplay between pathogen recognition and host response, as well as subversions of the host functions, which results in a prolonged bacterial infection.
The opportunistic pathogen Pseudomonas aeruginosa causes a variety of infections in the nosocomial setting. It also is responsible for serious respiratory infections of patients with cystic fibrosis (CF) (1, 2). The pathogenesis of the airway infection in CF follows a pattern of initial colonization by nonmucoid variants of P. aeruginosa together with transient infections by Haemophilus influenzae and Staphylococcus aureus. After a variable length of time, chronic lung disease develops, in which the bacterial population is almost exclusively mucoid P. aeruginosa (1). These patients also develop a neutrophil-dominated inflammatory response, which together with heavy bacterial load contributes to the progressive deterioration of lung function (3). One of the key questions related to the pathogenesis of CF includes the unexplained predisposition of such patients to P. aeruginosa infection including the establishment of the chronic colonization in an individual with an otherwise normal immune capacity.
An important advance toward understanding of the disease state in CF would be to fully elucidate the molecular mechanisms that operate in respiratory airways during the initial colonization of the respiratory tract by P. aeruginosa. It has been previously demonstrated that P. aeruginosa is capable of attaching to respiratory mucus and to respiratory epithelial cells (4, 5). It is this latter interaction, mediated specifically by surface-associated or secreted bacterial products, which is very likely recognized by the host and leads to the recruitment of the innate host defense mechanism. Previous work also has shown that bacterial components can cause induction of cationic antimicrobial peptides in the lungs and their activity may be inhibited by the milieu of the airway surface fluid (6). Moreover, bacterial-induced production of inflammatory cytokines lead to the recruitment of neutrophils and may further exacerbate the disease state of the CF lung (7). Activation of transcription of the mucin genes in the respiratory tract in response to the presence of bacteria may contribute to the disease state by accumulation of viscous mucus in the airways (8). It is very difficult to determine the total number of signaling molecules elaborated by the bacterium, and concomitantly the number of signaling pathways that lead to a transcriptional response is equally difficult to estimate. Here we describe the first step in attempting to define the epithelial cell response resulting from the interaction with P. aeruginosa. The RNA fraction isolated from cultured type II pneumocytes (A549 cells) was used to generate fluorescently labeled probes that were hybridized to high-density DNA arrays consisting of 1,506 human cDNA clones. Differences in gene expression were identified by pair-wise hybridization of probes generated from A549 cells before and after adherence by P. aeruginosa. Our results show that attachment of P. aeruginosa to A549 cells results in increased transcript levels of a number of genes present on the array. Although the functions of a majority of the P. aeruginosa-responsive genes are unknown, several known signaling molecules were activated, many of them have not been previously shown to play a role in bacterial respiratory infections. One such gene, encoding the interferon regulatory factor 1 (IRF-1) is activated by adhering P. aeruginosa and suggests that bacterial adherence may play an important role in activating a part of a pathway previously shown to play an important role during the response of cells to infection by a variety of viruses. Our work shows that high-density cDNA arrays have a potential of becoming an important tool in understanding the complex interaction between pathogenic bacteria and their host.
Materials and Methods
Cell Lines and Bacterial Infections.
The human lung carcinoma A549 cell line ATCC CCL 165 (9) was obtained from the American Type Culture Collection. The cells were grown in RPMI medium 1640 (Life Technologies, Grand Island, NY) supplemented with 10% fetal bovine serum, 24 mM Hepes, 2 mM l-glutamine, and 50 μg/ml gentamicin and incubated at 37°C in 5% CO2. Cells that were passaged 81–90 times were used for all experiments. Where indicated, before infection, the cells were washed two or three times in Hanks' balanced salt solution (HBSS) and incubated for 12–14 h in serum-free RPMI medium 1640 supplemented with 24 mM Hepes and 2 mM l-glutamine. The A549 cells were inoculated with either P. aeruginosa strain PAK or the nonpiliated derivative PAK-NP (10). The bacteria were grown overnight in Luria–Bertani broth, gently washed two times with PBS, and added to the A549 monolayer to give a multiplicity of infection of 50:1 bacterial to A549 cells.
RNA Isolation.
After infection at the times indicated, the media were removed from the monolayer and the cells were immediately lysed in solution D (4.0 M guanidinium thiocyanate/25 mM sodium citrate/0.5% Sarkosyl/0.1 M 2-mercaptoethanol). The total cellular RNA fraction was isolated as described (11). In brief, RNA was extracted from the lysed cells by addition of 0.1 vol of 2.0 M sodium acetate, followed by an equal volume of water-saturated phenol, and finally 0.1 vol of chloroform/isoamyl alcohol (49:1). After centrifugation to separate the organic and aqueous phases, the RNA was precipitated from the aqueous phase by isopropyl alcohol.
Fluorescent Probe Labeling.
Cye-dye-labeled first-strand cDNA was synthesized by reverse transcription (RT). The RT reaction was essentially accomplished as described by Geiss and coworkers (12), except that, initially, 400 pmol of oligo(dT)25 was annealed to 20 μg of total RNA and 1 ng of green fluorescent protein control poly(A)+ RNA. All other labeling, purification, and hybridization steps are as described.
Microarray Construction and Analysis.
The microarrays used in this study contained the identical cDNA clones and were constructed as described (12). The microarrays were built by using a Molecular Dynamics Generation II Array printer. After hybridization, the arrays were imaged by using a Generation II scanning confocal fluorescent microscope (Molecular Dynamics).
Image processing, data normalization, and error analysis are important issues for successful use of microarrays. As pointed out previously, a focus of the data analysis should be to generate both expression ratios and estimates of uncertainties in these ratios (13, 14). We have developed custom array analysis software (E. Hammersmark and R.E.B., unpublished work) to provide estimates of error in the ratios for each independent analysis. In brief, the software identifies the spots in a composite image constructed from the normalized sum of both color channels and extracts the intensity data from both color channels by integrating in a circle around each spot center. The local background value and the background variance was calculated by measuring the intensity in several locations around each spot. The error in the ratio was estimated by determining the ratio in several regions of the spot and calculating a standard deviation. This error estimate allows deletion of low-confidence spot data based on a single spot on the array. Replicate images are analyzed independently to produce expression ratios and error estimates in these ratios. Replicate analyses were combined to produce mean ratios and error estimates in the mean.
RT-PCR Analysis.
RT-PCR quantitation was used to verify the microarray data. Generally, several concentrations, ranging from 500 to 50 ng, of template RNA was used in a single-round RT reaction, containing 3.3 μM random decamers (Ambion), 0.3 mM dNTPs, 1× first-strand buffer, 10 mM DTT, 40 units of RNasin ribonuclease inhibitor (Promega), and 200 units of Moloney murine leukemia virus reverse transcriptase (GIBCO/BRL). The reaction was incubated at 42°C for 1 h.
The multiplex PCR was done using 2 μl of the RT reaction mixture as template, 10 pmol each of gene-specific primers, 0.4 μM QuantumRNA 18S internal standards (Ambion), 5% DMSO, 1× Taq buffer, 1.5 mM MgCl2, and 1 unit of Taq DNA polymerase (GIBCO/BRL). The PCR products were resolved on a 2% agarose gel, stained with SYBR green I stain (FMC BioProducts), and fluorimaged on a STORM 840 fluorimager/phosphorimager (Molecular Dynamics). The bands were quantitated by using imagequant (version 1.2, Molecular Dynamics) software.
Results
Expression Microarray Analysis of Interaction of Epithelial Cells with P. aeruginosa.
The transcriptional response of the human lung carcinoma cell line A549 during interaction with P. aeruginosa was examined by hybridization of fluorescently labeled cDNA probes to microarrays. Previous work had shown that the adherence of P. aeruginosa to A549 cells increased over a period of 1–3 h whereas 90% of the A549 cells remained viable during this period (5). Therefore, the relative transcript profiles were compared in a time-course experiment in which A549 cells were either briefly exposed to P. aeruginosa strain PAK (time 0) or incubated with bacteria for 3 h before RNA isolation.
In each experiment, total RNA was used as template for synthesis of Cy3- or Cy5-dCTP-labeled cDNA probes and hybridized to a microarray containing 1,506 human cDNA elements. Each microarray consisted of a duplicate set of cDNA elements and therefore yielded two measurements of relative gene expression. To control for labeling differences in each experiment, duplicate reactions were carried out where the fluorescent dyes were switched during synthesis. Each pair of corresponding probes were hybridized to a separate microarray. A false-color image of one such experiment is shown (Fig. 1). The fluorescence intensity of each element was measured, normalized, and averaged as described in Materials and Methods. To identify elements with reproducible hybridization signals, the relative error of each was plotted against the sum intensity (Fig. 2A). A cut-off value was determined, resulting in 680 genes selected for further analysis (Fig. 2B). Of this subset, 22 genes displayed a >2-fold increase in the levels of transcript during a 3-h exposure to P. aeruginosa. Only two genes were found to be significantly down-regulated more than 2-fold after incubation with bacteria.
Figure 1.

False-color image of microarray used to analyze transcript levels in cultured A549 cells after incubation with P. aeruginosa. Total RNA was extracted from A549 cells immediately (0 time point) or 3 h after addition of P. aeruginosa PAK. Each RNA sample was used as a template for synthesis of cDNA probes, which were incorporated with either Cy3- or Cy5-dCTP. The probes were mixed and hybridized to a microarray slide. The slides were scanned in a dual-laser scanning confocal microscope (Molecular Dynamics). The 0 time point was labeled with Cy3-dCTP (green) and the 3-h sample was labeled with Cy5-dCTP (red).
Figure 2.
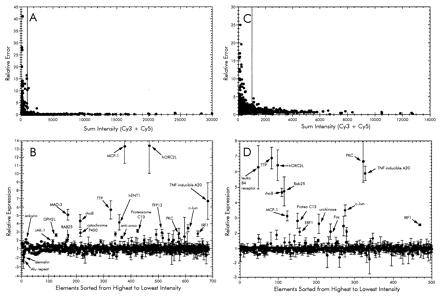
Analysis of microarray data from time-course infection (A and B) and adherence-mediated activation (PAK vs. PAK-NP; C and D) experiments. (A and C) Sum fluorescence intensities of both Cy3 and Cy5 plotted as a function of the relative error of the ratios from each element. The cut-off value for each was set to a sum intensity of 1,000. Those elements showing an intensity value above the cut-off were sorted from highest to lowest intensity and then plotted in the lower graphs (B and D) reflecting the relative ratios of each. The expression ratios in the time-course experiment were calculated such that genes showing increased expression at 3 h have values >1 and those with signals higher in the 0-h sample are less than −1 (B). This was accomplished by calculating the negative inverse of the 3:0 h ratio when the value was <1. Similarly, the expression ratio in the adherence activation was calculated so that increased expression during infection with wild type P. aeruginosa PAK is >1 and PAK-NP is less than −1 (D).
A list of these selected genes is shown in Table 1. Included in the up-regulated genes were those encoding several transcription factors such as IkB-α (MAD3), epithelial-specific transcription factor (ESE-1), and IRF-1. Several inflammatory response genes, namely monocyte chemotactic protein MCP-1 and the tumor necrosis factor α-induced protein A20 also were up-regulated. The DPH2L gene product involved in the conversion of histidine residues to diphthamide in elongation factor 2 also was found to be up-regulated. This modification is a prerequisite for P. aeruginosa exotoxin A-mediated ADP-ribosylation (15). Several genes that displayed altered expression, such as rhoB GTPase, JAK-1, c-Jun, and MAD-3, have been implicated to play roles in a variety of signal transduction pathways. These apparently participate in the mechanism of epithelial cell sensing of external bacteria.
Table 1.
Summary of expression data from microarray analysis
| Gene identification | Time course* | Adhesion dependence† | I.M.A.G.E. number |
|---|---|---|---|
| Human origin recognition complex protein 2 (hORC2L) | 13.4 (±3.33) | 6.4 (±1.00) | 380263 |
| Monocyte chemotactic protein 1 (MCP-1) | 13.3 (±2.03) | 3.1 (±0.32) | 768561 |
| Tumor necrosis factor-α-inducible DNA-binding protein A20 | 6.7 (±2.21) | 5.9 (±0.46) | 770670 |
| Tris-tetraproline (TTP) | 5.7 (±1.10) | 6.9 (±0.70) | 810900 |
| GTP-binding protein rhoB | 4.3 (±0.78) | 4.7 (±0.28) | 768370 |
| c-Jun | 3.5 (±0.41) | 3.5 (±0.36) | J04111‡ |
| Proteosome subunit C13 | 3.1 (±0.19) | 2.8 (±0.49) | 724860 |
| Urokinase-type plasminogen activator | 2.9 (±0.39) | 2.6 (±0.63) | 714106 |
| Protein kinase C, ETA type (PKC) | 2.8 (±0.61) | 6.7 (±1.34) | 380245 |
| Folylpolyglutamate synthetase | 2.7 (±0.63) | 2.5 (±0.63) | 810158 |
| IRF-1 | 2.5 (±0.35) | 2.6 (±0.06) | 740476 |
| Anti-oncogene | 2.4 (±0.17) | 1.9 (±0.30) | 161993 |
| Ras-related protein RAB25 | 2.1 (±0.26) | 4.7 (±0.94) | 811690 |
| IκB-α (MAD3) | 5.1 (±0.64) | NC | 825201 |
| Placental equilibrative nucleoside transporter 1 (hENT1) | 4.2 (±0.92) | NC | 668861 |
| Dioxin-inducible cytochrome P450 | 2.9 (±0.42) | NC | 782760 |
| Transcription factor TEL | 2.8 (±0.24) | NC | 668872 |
| Diphtheria toxin resistance protein (DPH2L) | 2.6 (±0.15) | NC | 826792 |
| Tissue factor pathway inhibitor 2 (TFPI2) | 2.3 (±0.52) | NC | 726086 |
| Ankyrin motif | 2.1 (±0.09) | NC | 782315 |
| Epithelial-specific transcription factor (ESE-1) | 2.1 (±0.77) | NC | 770910 |
| JAK-1 | 1.9 (±0.21) | NC | 713193 |
| Erythrocyte membrane protein band 4.9 (dematin) | −2.0 (±0.65) | NC | 362577 |
| Alu repeat-containing sequence | −2.3 (±0.92) | NC | 784841 |
| Leukotriene b4 receptor | NC | 6.3 (±1.40) | 363832 |
| c-Fos | NC | 2.1 (±0.50) | 811015 |
| ERF-1 | NC | 2.1 (±0.25) | 768299 |
NC, no change, IMAGE, Integrated Molecular Analysis of Genomes and Expression consortium.
Time-course ratios were calculated 3 hr/0 hr or −0 hr/3 hr incubations; relative error is in parentheses.
Adhesion dependence ratios were calculated PAK/PAK-NP incubations; relative error is in parentheses.
GenBank accession number.
Contribution of Bacterial Adhesion to A459 Responses.
Because the adherence of P. aeruginosa in this in vitro model depends on the expression of type IV pili (4, 5), the transcript profiles in A549 were compared from cells that were incubated with either wild-type or an isogenic, nonpiliated and therefore nonadherent mutant of P. aeruginosa. This comparison was used to determine whether any of the differentially regulated genes identified in the time-course experiment were the result of specific epithelial cell interactions with the P. aeruginosa adhesin.
After the analysis of the microarray data, genes corresponding to 500 cDNA elements that displayed hybridization signal above background levels during incubation with wild-type or pilA mutant PAK were selected for further analysis (Fig. 2 C and D). This comparison resulted in the identification of 16 genes that had a 2-fold or greater increased expression when the A549 monolayer was cocultured with wild-type PAK compared to those exposed to PAK-NP (Table 1). Of these, we identified 13 genes that were up-regulated in both the time-course and mutant PAK experiments. Another 11 genes that were up-regulated in the time course displayed no difference when the A549 cells were exposed to either PAK strain.
IRF-1 Induction by P. aeruginosa Infection.
One of the microarray elements that indicated differential expression in both experiments corresponded to the gene for IRF-1. This transcription factor has been shown to mediate the expression of IFN-responsive genes (16). The mRNA levels of IRF-1 expression reproducibly increased in response to P. aeruginosa exposure, and this increase depended on the expression of the major subunit of type IV pili by the bacteria (Fig. 3). The average increase in transcript levels was ≈2.5-fold in both experiments (Table 1).
Figure 3.
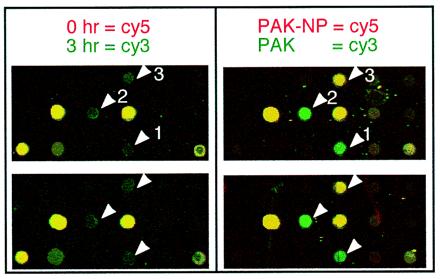
Close-up image of the IRF-1 containing region of microarray. Identical portions from several microarrays used during a time-course infection and an adhesion-dependence experiments are shown. Several genes represented in these images are IRF-1 (arrow 1), c-Jun (arrow 2), and TFPI2 (arrow 3).
To verify the induction of IRF-1 by P. aeruginosa coculture, we determined the levels of IRF-1 message in the samples by RT-PCR. The RT-PCR data support the observed increase in IRF-1 transcription during the time-course experiment and quantification by this alternative method showed that IRF-1 was induced 3-fold (Fig. 4A). Comparable results were obtained regardless of the presence of serum during bacterial incubation.
Figure 4.
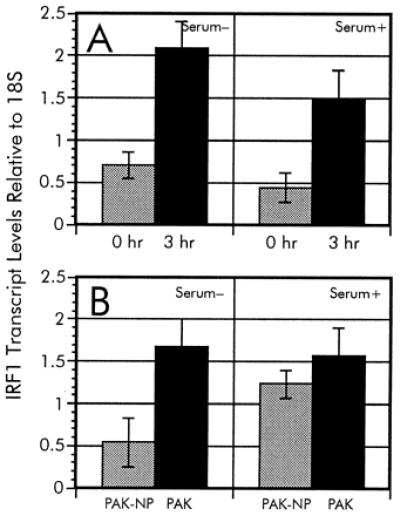
RT-PCR analysis of IRF-1 expression during P. aeruginosa infection. The relative ratios of IRF-1 transcripts from the time-course analysis (A) as well as adherence-mediated activation (B) were determined in serum-free and serum-supplemented culture media. To verify the differential regulation of IRF-1 during infection by P. aeruginosa, we used RT-PCR as described in Materials and Methods. Multiplex PCR were accomplished by using an IRF-1-specific [TCCACCTCTCACCAAGAACC and AAGTCCAGCTTCTCTGCACC] primer pair along with QuantumRNA 18S primer/competimer mix (Ambion). The relative ratios of IRF-1 levels were normalized to the 18S rRNA standard.
Because IRF-1 is involved in regulation of the IFN-responsive genes, we examined additional elements present on the microarray that represent genes implicated in similar signaling pathways. The microarray contained six elements that are part of the IFN-signaling pathway and is summarized in Table 2. No signal was detected from two other array elements corresponding to the genes for encoding IFN-responsive factors IRF-3 and IRF-4. Additionally, the gene encoding the transcription factor ISGF3-γ, as well as two IFN-induced genes with unknown functions, was found to be unchanged or modestly reduced. These results suggest that the increased levels of IRF-1 message result from a signal that does not follow the entire IFN response pathway.
Table 2.
Microarray analysis of IFN-γ-regulated genes
| Gene identification | Relative expression* |
|---|---|
| IRF-1 | 2.5 (±0.35) |
| IRF-3 | Not detected |
| IRF-4 | Not detected |
| ISGF3-γ | 1.3 (±0.06) |
| IFN-induced 17-kDa/15-kDa protein | −1.2 (±0.07) |
| IFN-inducible peptide | −1.5 (±0.22) |
Ratios were calculated 3 hr/0 hr or −0 hr/3 hr incubations; relative error is in parentheses.
The adherence-dependent increase of IRF-1 transcription also was verified by using RT-PCR. The relative ratio of IRF-1 in A549 cultures exposed to wild-type P. aeruginosa PAK in serum-free media was 4.4-fold higher than in cocultures with the nonadhering mutant P. aeruginosa PAK-NP (Fig. 4B), which is comparable to the induction observed during the time-course experiment. These results indicate that the induction of IRF-1 is strongly influenced by the ability of P. aeruginosa to adhere to the cells. However, upon serum addition in the culture medium, the A549 cells had elevated levels of IRF-1 transcript during incubation with either wild-type or pilA mutant PAK (Fig. 4B). This suggests that the adherence-mediated regulation of IRF-1 can be abolished by the presence of a factor (or factors) supplied in serum.
Effect of P. aeruginosa LPS on Expression of IRF-1.
One of the more potent stimulators of mammalian-signaling pathways is bacterial LPS (17). Factors such as LPS-binding protein (LBP) and soluble CD14 are serum components that have been shown to enhance these signaling pathways. Therefore, the effects on IRF-1 levels in A549 cells during exposure to purified P. aeruginosa LPS in the presence and absence of serum were examined. We estimated an equivalent LPS concentration to whole P. aeruginosa by using the formula of 1 μg of LPS equal to 109 cells (R. Ernst and S. Miller, personal communication). As shown in Fig. 5, no significant change in IRF-1 mRNA expression was observed when the A549 cells were exposed to purified LPS isolated from P. aeruginosa PAK grown in Luria–Bertani broth (18) at a whole bacterial cell equivalent (25 ng/ml) or 10-fold higher concentration. This lps induction result is in contrast to the 3-fold increase in IRF-1 transcripts after incubation with P. aeruginosa cells. Similar results were observed in the presence or absence of serum in the culture medium. It is therefore conceivable that the induction of IRF-1 message requires direct adhesion of P. aeruginosa. However, we cannot rule out the possibility that the adhesion-dependent activation of IRF-1 expression is primarily due to LPS and that pili-mediated adhesion abrogates the requirement for stimulating factors in the serum, namely LPS-binding protein or soluble CD14.
Figure 5.
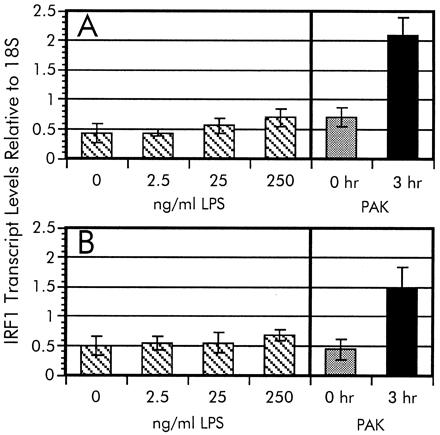
LPS induction of IRF-1. The dosage-dependent LPS activation of IRF-1 transcription was measured in serum-free (A) and serum-supplemented (B) A549 cell cultures. Relative levels of IRF-1 transcripts were measured by RT-PCR as described in the legend to Fig. 4. The IRF-1 mRNA intensity of each signal from A549 cells exposed to various LPS concentrations were normalized to the 18S rRNA standard. The data from the time-course experiment (Fig. 4A) are included for comparison.
Discussion
Parallel analysis of gene expression provides a new tool for studying interplay of signals and transcriptional responses in complex biological systems (19). Here we show that the interaction between P. aeruginosa and A549 cells can be used as a model for the natural colonization of the respiratory surface by this pathogen and provide information about the response pathways involved. In the analysis reported here, we used a microarray consisting of 1,506 elements representing ≈1.5% of the protein coding capacity of the human genome. Although this is only a small fraction, useful information about a particular pathway can be obtained because differential transcription of a gene also would reflect alterations in the pathways in which this gene is involved.
One of the outcomes of the microarray analysis was the discovery that adherence of P. aeruginosa to epithelial cells leads to increased transcription of the gene for IRF-1. IRF-1 has been shown to play a key role in viral-mediated signaling as well as various steps involved in innate host defense mechanisms. Our data suggest that IRF-1 is expressed in respiratory epithelial cells and the activation is strongly influenced by bacterial adhesion.
IRF-1 has been shown to be a key factor in the IFN-mediated antiviral response in a variety of cells (20). Although present at low levels in most cell types, IRF-1 is induced by treatment with IFN and cytokines (21). In addition to IRF-1, the response to viral infections in most cells also requires the activity of the IFN-stimulated gene factor 3 (ISGF3) (22). We show in Table 2 that bacteria specifically induces the transcription of IRF-1 without affecting the steady-state levels of the p48 subunit of ISGF3 (ISGF3-γ). These findings suggest that the response in A549 cells to bacterial adhesion differs from the IFN-induced antiviral pathway. This conclusion is based on several observations. First, several genes represented on the microarrays that have been previously shown to be IFN responsive were not activated. Second, the levels of ISGF3-γ mRNA are not altered in response to bacteria. Finally, it has been recently demonstrated that IFN-α can transcriptionally activate IRF-1 through an ISGF3-independent signaling pathway (23). Unless the steady-state levels of ISGF3-γ are already sufficient to coordinate transcriptional activation with the increased levels of IRF-1, we conclude that the bacterial-induced pathway is distinct from those induced during viral infections.
IRF-1 expression may be activated by a variety of P. aeruginosa effector products that require bacteria–epithelial cell contact. Such candidates may include several proteins secreted by the contact-dependent type III secretion pathways, where expression of the pilus adhesin is required for intracellular delivery of the secreted proteins (24, 25). Finally, we cannot exclude the possibility, that the adherence of bacteria activates a signaling pathway, which is the direct consequence of the interaction between the adhesin and its epithelial cell receptors. Pilus-mediated signaling has been demonstrated in Escherichia coli (26–28) and may represent a second function for most bacterial adhesins. Induction of IL-8 by a variety of P. aeruginosa surface ligands, including type IV pili, also has been demonstrated (29).
Alternatively, adhesion-dependent signaling between bacteria and epithelial cells may be due to a yet unspecified P. aeruginosa product, whereby adhesion serves to enhance the signaling effect by concentrating the bacteria on the epithelial cellular surface. One such candidate is LPS, which is an integral component of the bacterial outer membrane. We show that the mRNA levels for IRF-1 are not significantly influenced by purified P. aeruginosa LPS at an approximate concentration present in the number of whole bacteria used during coculture. However it is difficult to directly compare the effect of purified LPS and LPS released from bacteria during contact with epithelial cells. Any number of other molecules produced by P. aeruginosa, including LPS, therefore remain as potential candidates for signals that lead to enhanced transcription of IRF-1 by adhering bacteria.
Increase in the synthesis of a transcription factor, such as IRF-1, leads to the activation of expression of target genes which may be necessary for the recognition of an infecting pathogen and activation of host defense mechanisms. One of the targets of IRF-1 is the gene encoding the inducible nitric oxide synthase, iNOS. Nitric oxide appears to be an important signaling molecule during several stages of bacterial infections and in fact has been shown to be present at high levels in sputa from CF patients with disease exacerbation (30). Induced synthesis of iNOS synthase by macrophages is essential for these cells to elicit a cytopathic response to bacteria and a variety of intracellular pathogens (31). Another important consequence of bacterial stimulation of iNOS is autotoxicity, which can lead to the destruction of epithelial cells. This latter mechanism has been implicated in the mechanism of action of Bordetella pertussis tracheal cytotoxin (32). Alternatively, the observed IRF-1 activation may represent a mechanism of host defense diversion by P. aeruginosa. One of the targets of IRF-1 is the gene for secretory leukocyte protease inhibitor (SLPI), where IRF-1 represses its expression, thus decreasing the synthesis of this important inflammatory modulator (33). Interference with the synthesis of SLPI may enhance the tissue damage by the leukocyte proteases in the infected tissues. Protease-induced damage is the major contributor to the lung pathology observed during infections of CF patients (34).
Identification of the targets of IRF-1 should provide the missing information about the consequences of the adhesion-dependent activation of the host defense mechanisms operating through the IRF-1 pathway, which in turn may provide important new insights into the pathogenesis of P. aeruginosa infections in humans.
Acknowledgments
We thank members of the University of Washington Center for Expression Array Analysis, especially Michael G. Katze and Jim Mullins, for helpful discussions and input; Robert Ernst and Samuel Miller for P. aeruginosa LPS samples, and members of the Lory laboratory for critical reading of this manuscript. This work has been supported by a research grant from the Cystic Fibrosis Foundation. J.K.I. is a Cystic Fibrosis Foundation Postdoctoral Fellow.
Abbreviations
- CF
cystic fibrosis
- IRF-1
IFN regulatory factor 1
- RT
reverse transcription
- LPS
lipopolysaccharide
Footnotes
This paper was submitted directly (Track II) to the PNAS office.
Article published online before print: Proc. Natl. Acad. Sci. USA, 10.1073/pnas.160140297.
Article and publication date are at www.pnas.org/cgi/doi/10.1073/pnas.160140297
References
- 1.Govan J R, Deretic V. Microbiol Rev. 1996;60:539–574. doi: 10.1128/mr.60.3.539-574.1996. [DOI] [PMC free article] [PubMed] [Google Scholar]
- 2.Gilligan P H. Clin Microbiol Rev. 1991;4:35–51. doi: 10.1128/cmr.4.1.35. [DOI] [PMC free article] [PubMed] [Google Scholar]
- 3.Konstan M W, Berger M. Pediatr Pulmon. 1997;24:137–142. doi: 10.1002/(sici)1099-0496(199708)24:2<137::aid-ppul13>3.0.co;2-3. ; discussion 159–161. [DOI] [PubMed] [Google Scholar]
- 4.Cervin M A, Simpson D A, Smith A L, Lory S. Microbiol Pathogen. 1994;17:291–299. doi: 10.1006/mpat.1994.1075. [DOI] [PubMed] [Google Scholar]
- 5.Chi E, Mehl T, Nunn D, Lory S. Infect Immun. 1991;59:822–828. doi: 10.1128/iai.59.3.822-828.1991. [DOI] [PMC free article] [PubMed] [Google Scholar]
- 6.Smith J J, Travis S M, Greenberg E P, Welsh M J. Cell. 1996;85:229–236. doi: 10.1016/s0092-8674(00)81099-5. [DOI] [PubMed] [Google Scholar]
- 7.DiMango E, Zar H J, Bryan R, Prince A. J Clin Invest. 1995;96:2204–2210. doi: 10.1172/JCI118275. [DOI] [PMC free article] [PubMed] [Google Scholar]
- 8.Li J D, Dohrman A F, Gallup M, Miyata S, Gum J R, Kim Y S, Nadel J A, Prince A, Basbaum C B. Proc Natl Acad Sci USA. 1997;94:967–972. doi: 10.1073/pnas.94.3.967. [DOI] [PMC free article] [PubMed] [Google Scholar]
- 9.Lee K K, Doig P, Irvin R T, Paranchych W, Hodges R S. Mol Microbiol. 1989;3:1493–1499. doi: 10.1111/j.1365-2958.1989.tb00135.x. [DOI] [PubMed] [Google Scholar]
- 10.Saiman L, Ishimoto K, Lory S, Prince A. J Infect Dis. 1990;161:541–548. doi: 10.1093/infdis/161.3.541. [DOI] [PubMed] [Google Scholar]
- 11.Chomczynski P, Sacchi N. Anal Biochem. 1987;162:156–159. doi: 10.1006/abio.1987.9999. [DOI] [PubMed] [Google Scholar]
- 12.Geiss G K, Bumgarner R E, An M C, Agy M B, van't Wout A B, Hammersmark E, Carter V S, Upchurch D, Mullins J I, Katze M G. Virology. 2000;266:8–16. doi: 10.1006/viro.1999.0044. [DOI] [PubMed] [Google Scholar]
- 13.Chen J J, Wu R, Yang P C, Huang J Y, Sher Y P, Han M H, Kao W C, Lee P J, Chiu T F, Chang F, et al. Genomics. 1998;51:313–324. doi: 10.1006/geno.1998.5354. [DOI] [PubMed] [Google Scholar]
- 14.Ermolaeva O, Rastogi M, Pruitt K D, Schuler G D, Bittner M L, Chen Y, Simon R, Meltzer P, Trent J M, Boguski M S. Nat Genet. 1998;20:19–23. doi: 10.1038/1670. [DOI] [PubMed] [Google Scholar]
- 15.Foley B T, Moehring J M, Moehring T J. J Biol Chem. 1995;270:23218–23225. doi: 10.1074/jbc.270.39.23218. [DOI] [PubMed] [Google Scholar]
- 16.Taniguchi T, Harada H, Lamphier M. J Cancer Res Clin Oncol. 1995;121:516–520. doi: 10.1007/BF01197763. [DOI] [PubMed] [Google Scholar]
- 17.Kielian T L, Blecha F. Immunopharmacology. 1995;29:187–205. doi: 10.1016/0162-3109(95)00003-c. [DOI] [PubMed] [Google Scholar]
- 18.Ernst R K, Yi E C, Guo L, Lim K B, Burns J L, Hackett M, Miller S I. Science. 1999;286:1561–1565. doi: 10.1126/science.286.5444.1561. [DOI] [PubMed] [Google Scholar]
- 19.Brown P O, Botstein D. Nat Genet. 1999;21:33–70. doi: 10.1038/4462. [DOI] [PubMed] [Google Scholar]
- 20.Kimura T, Nakayama K, Penninger J, Kitagawa M, Harada H, Matsuyama T, Tanaka N, Kamijo R, Vilcek J, Mak T W, et al. Science. 1994;264:1921–1924. doi: 10.1126/science.8009222. [DOI] [PubMed] [Google Scholar]
- 21.Der S D, Zhou A, Williams B R G, Silverman R H. Proc Natl Acad Sci USA. 1998;95:15623–15628. doi: 10.1073/pnas.95.26.15623. [DOI] [PMC free article] [PubMed] [Google Scholar]
- 22.Kimura T, Kadokawa Y, Harada H, Matsumoto M, Sato M, Kashiwazaki Y, Tarutani M, Tan R S, Takasugi T, et al. Gene Cells. 1996;1:115–124. doi: 10.1046/j.1365-2443.1996.08008.x. [DOI] [PubMed] [Google Scholar]
- 23.Haque S J, Williams B R. J Biol Chem. 1994;269:19523–19529. [PubMed] [Google Scholar]
- 24.Kang P J, Hauser A R, Apodaca G, Fleiszig S M, Wiener-Kronish J, Mostov K, Engel J N. Mol Microbiol. 1997;24:1249–1262. doi: 10.1046/j.1365-2958.1997.4311793.x. [DOI] [PubMed] [Google Scholar]
- 25.Hauser A R, Fleiszig S, Kang P J, Mostov K, Engel J N. Infect Immun. 1998;66:1413–1420. doi: 10.1128/iai.66.4.1413-1420.1998. [DOI] [PMC free article] [PubMed] [Google Scholar]
- 26.Godaly G, Proudfoot A E, Offord R E, Svanborg C, Agace W W. Infect Immun. 1997;65:3451–3456. doi: 10.1128/iai.65.8.3451-3456.1997. [DOI] [PMC free article] [PubMed] [Google Scholar]
- 27.Godaly G, Frendeus B, Proudfoot A, Svensson M, Klemm P, Svanborg C. Mol Microbiol. 1998;30:725–735. doi: 10.1046/j.1365-2958.1998.01104.x. [DOI] [PubMed] [Google Scholar]
- 28.Abraham S N, Jonsson A B, Normark S. Curr Opin Microbiol. 1998;1:75–81. doi: 10.1016/s1369-5274(98)80145-8. [DOI] [PubMed] [Google Scholar]
- 29.DiMango E, Ratner A J, Bryan R, Tabibi S, Prince A. J Clin Invest. 1998;101:2598–2605. doi: 10.1172/JCI2865. [DOI] [PMC free article] [PubMed] [Google Scholar]
- 30.Francoeur C, Denis M. Inflammation. 1995;19:587–598. doi: 10.1007/BF01539138. [DOI] [PubMed] [Google Scholar]
- 31.MacMicking J, Xie Q W, Nathan C. Annu Rev Immun. 1997;15:323–350. doi: 10.1146/annurev.immunol.15.1.323. [DOI] [PubMed] [Google Scholar]
- 32.Flak T A, Goldman W E. Am J Respir Crit Care Med. 1996;154:S202–S206. doi: 10.1164/ajrccm/154.4_Pt_2.S202. [DOI] [PubMed] [Google Scholar]
- 33.Nguyen H, Teskey L, Lin R T, Hiscott J. Oncogene. 1999;18:5455–5463. doi: 10.1038/sj.onc.1202924. [DOI] [PubMed] [Google Scholar]
- 34.Berger M. Clin Rev Allergy. 1991;9:119–142. doi: 10.1007/978-1-4612-0475-6_8. [DOI] [PubMed] [Google Scholar]