

Abstract
Neurotrophins influence the epigenetic shaping of the vertebrate nervous system by regulating neuronal numbers during development and synaptic plasticity. Here we attempt to determine whether these growth factors can also regulate neurotransmitter plasticity. As a model system we used the selection between noradrenergic and cholinergic neurotransmission by paravertebral sympathetic neurons. Developing sympathetic neurons express the neurotrophin receptors TrkA and TrkC, two highly related receptor tyrosine kinases. Whereas the TrkA ligand nerve growth factor (NGF) has long been known to regulate both the survival and the expression of noradrenergic traits in sympathetic neurons, the role of TrkC and of its ligand neurotrophin-3 (NT3) has remained unclear. We found that TrkC expression in the avian sympathetic chain overlaps substantially with that of choline acetyltransferase. In sympathetic chain explants, transcripts of the cholinergic marker genes choline acetyltransferase and vasoactive intestinal polypeptide were strongly enriched in the presence of NT3 compared with NGF, whereas the noradrenergic markers tyrosine hydroxylase and norepinephrine transporter were reduced. The transcription factor chicken achaete scute homolog 1 was coexpressed with cholinergic markers. The effects of NT3 are reversed and antagonized by NGF. They are independent of neuronal survival and developmentally regulated. These results suggest a role for NT3 as a differentiation factor for cholinergic neurons and establish a link between neurotrophins and neurotransmitter plasticity.
Neurons of the paravertebral sympathetic chain represent an especially useful paradigm for the study of molecular signals controlling neuronal cell death (1), catecholamine biosynthesis (2), and the neurotransmitter phenotype (3, 4). Nerve growth factor (NGF) is the best-understood secreted molecule acting on sympathetic neurons. Its antiapoptotic function necessitates the activation of the receptor tyrosine kinase TrkA which is expressed at the appropriate time by virtually all paravertebral sympathetic neurons. Mice carrying a deletion either in the Ngf or in the TrkA gene essentially lack a peripheral sympathetic nervous system (5, 6). Sympathetic neurons also express TrkC, a homolog of TrkA, which binds the NGF-related growth factor neurotrophin-3 (NT3) with high selectivity (7, 8). However, in contrast to TrkA−/− animals, no reduction in the number of sympathetic neurons was observed in mice lacking TrkC (8, 9). This finding was initially somewhat surprising, as in vitro studies indicated that NT3 promotes the survival of early embryonic sympathetic neurons, and Nt3−/− mice have about half the usual number of paravertebral sympathetic neurons. This apparent discrepancy could be reconciled by a series of biochemical, cell culture, and genetic experiments indicating that NT3 activates TrkA in addition to TrkC (9–12).
Besides their role as a model system for the regulation of neuronal survival, sympathetic neurons of mammals and birds have also been used extensively to study another developmental phenomenon controlled by diffusible growth factors: neurotransmitter plasticity. A series of studies initiated in the 1970s demonstrated that in the absence of any effect on neuronal survival, extracellular signals can determine the phenotype of neurons as either noradrenergic or cholinergic in the rat (for a review, see refs. 3 and 4). Sympathetic neurons are neural crest derivatives, and the early developmental acquisition of catecholaminergic properties by neural crest cells is controlled by signaling molecules in the neural tube, notochord, and dorsal aorta (13, 14). In both mammals and birds a subpopulation subsequently transdifferentiates to acquire a cholinergic phenotype. This neurotransmitter switch requires the coordinated regulation of various genes that allow the synthesis, storage, and reuptake of transmitters. Although cholinergic characteristics are already weakly expressed in sympathetic chains before target innervation in birds and rodents (15, 16), contact with certain tissues, in particular sweat glands of rodent foot pads, plays the essential instructive role for the differentiation of initially catecholaminergic to cholinergic neurons (3).
In vitro experiments have shown that this switch can be triggered by cholinergic differentiation factors, which are released by cholinergic target tissues. Candidate cholinergic differentiation factor proteins include leukemia inhibitory factor (LIF), ciliary neuronotrophic factor (CNTF), cardiotrophin-1 (CT-1), and oncostatin M (3, 4). However, recent experiments with mice carrying mutations in genes coding for these cytokines or for their receptors have raised questions about the role of these factors in vivo. Therefore it is possible that growth factors other than these cytokines also play a role in the cholinergic switch of catecholaminergic neurons. As the role of the NT3-specific receptor TrkC in sympathetic neurons is still unclear, we set out to correlate its expression with neurotransmitter markers in chick sympathetic neurons and to analyze the effects of its ligand on neurotransmitter differentiation.
Materials and Methods
In Situ Hybridization and Immunohistochemistry.
Eviscerated embryos were fixed in 4% paraformaldehyde for 2 h, cryoprotected in sucrose, and embedded in Tissue Tek (Sakura, Tokyo, Japan). Serial sections were cut (12 μm) and frozen. Thawed sections were fixed in ethanol for 10 min and air-dried. In situ hybridization was performed with single-strand RNA probes from the 3′ untranslated region for chick TRKC and from the coding sequence of chick choline acetyltransferase gene (CHAT) (17) as described previously (18). For immunocytochemistry, endogenous peroxidase was blocked by 80% methanol/0.6% H2O2 for 10 min at room temperature. Sections were washed in PBS and boiled (5–10 sec) in citrate buffer in a microwave oven set at 900 W. Subsequently they were treated twice with the Biotin Blocking System (Dako) and with PBS/1% BSA/30% serum/0.2% Triton X-100 for 45 min. Rabbit antibodies were applied in PBS/BSA 1%/10% serum/0.2% Triton X-100 overnight at 4°C: ChAT Ab5042 (Chemicon) (1:300), serum 2017 (1:1000) (19), TrkC serum 798 (Santa Cruz Biotechnology), purified IgG CTC (1:1500) (20), and tyrosine hydroxylase (TH) (Pel-Freez Biologicals; 1:300). Samples were washed for 30 min at 37°C in PBS and incubated with a biotinylated secondary antibody in PBS (Vector Laboratories; 1:200) for 90 min at 37°C. Staining was amplified by a biotin-avidin-peroxidase complex (Vector-ABC Kit, 90 min at 37°C) and visualized with 3,3′-diaminobenzidine (0.66 mg/ml; Polysciences) in Tris buffer with 0.03% H2O2.
Cultures of Sympathetic Explants.
The lumbosacral part of the paravertebral sympathetic chain was dissected from E12 (HH stage 37/38, ref. 21) or E7.5 (HH stage 31) chicken embryos (White Leghorn, Hoelzl Farm, Moosburg, Germany), washed with PBS, and transferred to 12-well tissue culture plates (Falcon) previously coated with polyornithine (Sigma) and laminin (Life Technologies, Grand Island, NY). Two or three chains (6–10 ganglia per chain) were incubated per well in 2 ml of culture medium consisting of Ham's F-14 (Life Technologies) supplemented with 0.1 mg/ml apotransferrin, 16 μg/ml putrescine, 6 ng/ml progesterone, 8 ng/ml sodium selenite, 100 μg/ml penicillin G, 60 μg/ml streptomycin sulfate (all reagents from Sigma) (22), and 10 ng/ml recombinant human NGF (Genentech), NT3 (Amgen Biologicals), or CNTF (Regeneron Pharmaceuticals, Tarrytown, NY). The culture plates were centrifuged (1000 × g for 1 min in a Heraeus Omnifuge) to facilitate attachment of the ganglia in the wells. After 4 days of incubation at 37°C in a 3% CO2 atmosphere, the medium was removed. The ganglia were taken up in lysis buffer, and material from six individual wells was combined for the isolation of total RNA (RNeasy kit; Qiagen, Chatsworth, CA).
Semiquantitative Reverse Transcription-Coupled PCR.
RNA (0.3–1 μg) was dissolved in 30 μl of H2O, and the following was added: 2.5 μl of 1 M Tris (pH 7.4), 20 μl of 25 mM MgCl2, 2 μl of RNase-free DNase (10 units/μl) (Roche Molecular Biochemicals), and 0.5 μl of RNasin (40 units/μl) (Promega). The mixture was incubated for 20 min at 37°C and subsequently split into two parts. In one part, RNA was reverse-transcribed using oligo(dT) primers (Life Technologies) and Moloney murine leukemia virus reverse transcriptase (Superscript II; Life Technologies) at 45°C for 1 h. The other part was incubated in the same mixture without the enzyme and was later used as a control for DNA contamination in the PCR. The cDNA was purified (PCR purification kit; Qiagen) and used as a template for PCR in a 60-μl reaction volume containing 1× PCR buffer containing 1.5 mM MgCl2 (Perkin–Elmer), 0.2 mM dNTPs, and 0.1 μM of each primer. A “hot start” was performed manually by adding 1.5 units of AmpliTaq (Perkin–Elmer) after an initial incubation of 5 min at 95°C in a thermocycler (Perkin–Elmer, 9700). For each culture experiment the housekeeping gene glyceraldehyde-3-phosphate dehydrogenase (GAPDH) was amplified with 17 and 20 cycles to normalize the cDNA content of the samples. Equal cDNA amounts were subsequently used for the amplification of marker genes. Amplification was performed for 18–40 cycles (95°C for 30 sec, 62°C for 30 sec, and 72°C for 30 sec). The linear range of amplification was determined for each primer set. For the semiquantitative determination of relative gene expression levels, 10-μl samples of the amplificates were collected during the PCR after the completion of three different cycle numbers in the linear range. The amplicons were analyzed on a 1% agarose gel stained with SYBR-Green (Biomol, Plymouth Meeting, PA). Pictures of the gels were taken with a digital imaging system (EASY; Herolab, Wiesloch, Germany) in the linear range of the camera. Band intensities were determined by area integration (ImageQuant, version 3; Molecular Dynamics). For each culture experiment, relative gene expression levels in differentially treated cultures were determined for at least two cycle numbers and subsequently averaged to obtain a value for this gene in this particular cell culture experiment. The ratios provided in the text derive from the combination of the gene expression ratios observed in three to five independent cell culture experiments. The primers (5′ to 3′) and cycle numbers were as follows: GAPDH, GGCTGCTAAGGCTGTGGGGA, TATCAGCCTCTCCCACCTCC (cycles 17–20); norepinephrine transporter (NET) (ref 23) (GenBank AF237673), CGTAGGGATCTCATGGCACC, CACCAGCTTGTGGCCCAAGG (cycles 23–29); CHAT (ref. 17), TGTAAAGATCTCCGGCAGTTCC, AACATTAGGTCTGCTACGGCGG (cycles 36–40); TRKA (ref. 24), CCCCTCATCATGGTCTTCGA, TGTGGATGTCCTGGATGCGC (cycles 24–30); TRKC (ref. 25), ATGCTGCCTATCCGCTGGAT, ACAGGTTGTCGTTTTGTGGG (cycles 24–30); TH (ref. 26), TGAACGGCAGCAGCATCAGG, ATATCCGCCACGCATCTTCG (cycles 23–29); P75NTR (ref. 27), TCGGTCCTAACAGGGCTACG, ATCCCGTGGCCTCTCTTTGG (cycles 25–31); vasoactive intestinal polypeptide (VIP; ref. 28), GCGCCCATGGGTCCTTAAAG, AGAGGTCCAATGGGAGGTGG (cycles 28–34); chicken paired-like homeobox 2a (cPHOX2A; J.-F. Brunet, personal communication), GAGGCGTCCGCCTACGATTT, ACCCGCTCCAACTCCTTCAG (cycles 36–40); and chicken achaete scute homolog 1 (CASH-1; ref. 29), CGCCTCTTCTGCGTTTGGAC, TCCTCCCTGACCAGTTTGGG (cycles 30–34).
Terminal Deoxynucleotidyltransferase-Mediated dUTP End Labeling (TUNEL) and BrdUrd Labeling of Sympathetic Explants.
E12 sympathetic chains were cultured as described above in the presence NGF or NT3 for 4 days in Labtec Permanox chamber slides (Nunc-Nalgene). Subsequently cultures were washed, and fresh medium containing NGF or NT3 was added for 1 day. TUNEL staining was performed with an in situ cell death labeling kit (Roche Diagnostics). Ganglia were permeabilized by two 15-min treatments at room temperature in 0.1% Triton/0.1% sodium citrate. For the detection of proliferation, ganglia were incubated with 10 μM BrdUrd (Sigma) for 4 h. Subsequently cellular DNA was denatured by treatment with 2 M HCl. BrdUrd incorporation was visualized by immunostaining with a BrdUrd-specific monoclonal antibody (1:20; BioScience Products). The number of BrdUrd-positive or TUNEL-positive nuclei per ganglion was counted under a Axiophot microscope attached to a 100-W AttoArc lamp (Zeiss).
Results
At E16 gene expression of ChAT and TrkC was analyzed by in situ hybridization and immunohistochemistry in chick paravertebral sympathetic ganglia. The expression patterns of the two genes were patchy and overlapped substantially (Fig. 1 A and B). Immunohistochemical staining revealed strong expression of TH compared with the weaker signals observed for both TrkC and ChAT. TrkC immunoreactivity was located mostly in ChAT and not in TH expression domains (Fig. 1 C–F). On consecutive sections numerous cells were detected expressing TrkC and ChAT but not TH (Fig. 1 G–I). Similar results were obtained with antibodies recognizing the tyrosine kinase domain of TrkC (Fig. 1D) or the extracellular domain (Fig. 1H) and with two different ChAT antisera (Fig. 1 C and G). Hence the expression of TrkC appears to be correlated with cholinergic properties at this embryonic stage.
Figure 1.
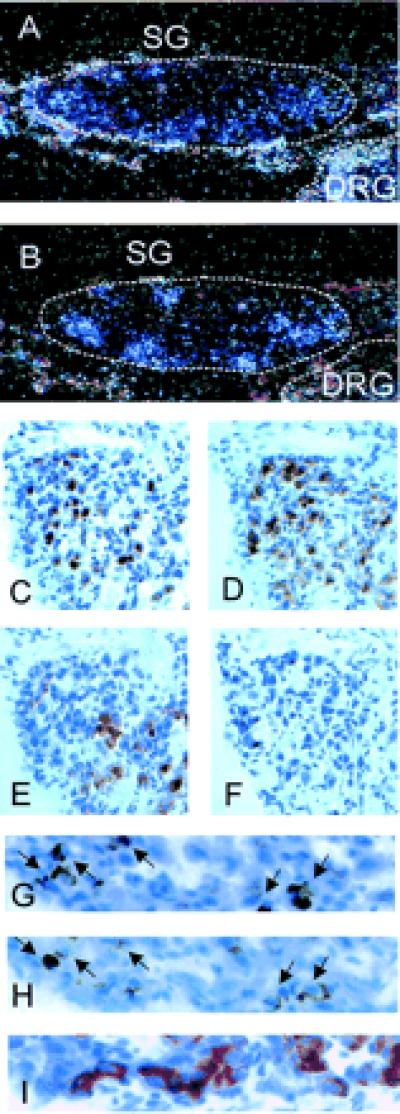
Correlation of the expression of TrkC, ChAT, and TH in E16 sympathetic ganglia. In situ hybridization of serial sections from sympathetic ganglia (SG) with probes specific for TRKC (A) and CHAT (B) reveals a substantial overlap in the local distribution of transcripts. Dorsal root ganglia (DRG) are positive for TRKC but negative for CHAT. Immunohistochemical analysis of serial sections confirms that at the same developmental stage neurons expressing cholinergic markers are not randomly distributed but tend to form clusters. Note that within such a cell cluster TrkC (C) immunoreactivity is strong in areas of ChAT expression (D), compared with areas with strong TH immunoreactivity (E). (F) Negative control without primary antibody. At higher magnification many cells were identified as positive for TrkC (H) and ChAT (G) and negative for TH (I). (A and B, × 125; C–F, × 250; G–I, × 750.)
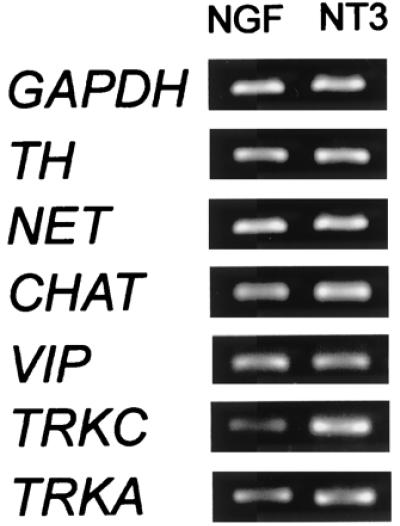
To address a potential role of NT3 in the acquisition of cholinergic properties, sympathetic chains were isolated at E12, when most neurons are postmitotic and have established contact with their prospective target tissue (30). At this stage TrkC is present (31), and noradrenergic and cholinergic markers are expressed in a broadly overlapping population of cells. Ganglia were cultured in defined medium in the presence of neurotrophic factors at a concentration of 10 ng/ml. After 4 days, massive neurite outgrowth was observed from NGF-treated explants. NT3-treated ganglia displayed less neuritic growth. In the absence of neurotrophins, ganglia degenerated (data not shown). Gene expression in the explanted ganglia was investigated by reverse transcription-coupled PCR. We first analyzed the expression of the genes encoding the neurotrophin receptors TrkA and TrkC and the common neurotrophin receptor p75NTR (Fig. 2A). Strong differential expression was found for TRKA and TRKC. Transcripts for p75NTR were equally distributed. We next compared the expression levels of the noradrenergic markers TH and NET and of the cholinergic markers CHAT and VIP (Fig. 2B). Again, strong differences were observed between NGF-treated and NT3-treated cultures. This finding indicates that cholinergic markers are strongly enriched in NT3-treated compared with NGF-treated explants.
Figure 2.
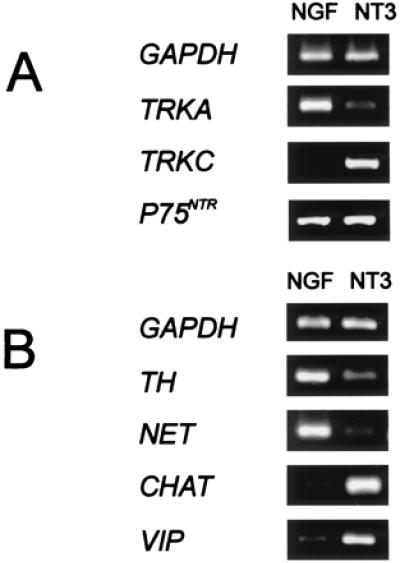
Differential gene expression of sympathetic explants. E12 explants were cultured for 4 days, and relative gene expression levels were determined by reverse transcription-coupled PCR. Amplification of GAPDH was used to normalize the cDNA content of the samples. Photographs are representative examples. Ratios of >20 indicate very strong differences, which were not resolved. (A) Neurotrophin receptor genes. Primer sets used for the amplification of TRKA and TRKC correspond to sequences from the intracellular domains encoding the full-length tyrosine kinases (24, 25). Consistently strong differences between NGF-treated and NT-3-treated cultures were observed for TRKA and TRKC (gene expression ratios 5 ± 2:1, 1:>20). The neurotrophin receptor P75NTR gene was expressed at similar levels (1:1). (B) Neurotransmitter marker genes. Transcript levels for the noradrenergic markers NET (>20:1) and TH (5 ± 2:1) were higher in NGF-treated explants compared with explants with NT3. In contrast, transcripts of the cholinergic marker genes CHAT (1:>20) and VIP (1:15 ± 3) were enriched in NT3-treated compared with NGF-treated sympathetic neurons.
The effects of NT3 were then compared with those of CNTF, known to promote the expression of cholinergic markers in rat and avian sympathetic neurons (32, 33). CHAT and VIP transcripts-treated cultures were enriched in CNTF-treated compared with NGF (Fig. 3A). VIP gene expression levels were similar in NT3- and CNTF-treated cultures. At least 2-fold higher CHAT expression levels were consistently observed in NT3-treated compared with CNTF-treated explants. Therefore NT3 induced cholinergic differentiation at least as potently as did CNTF.
Figure 3.
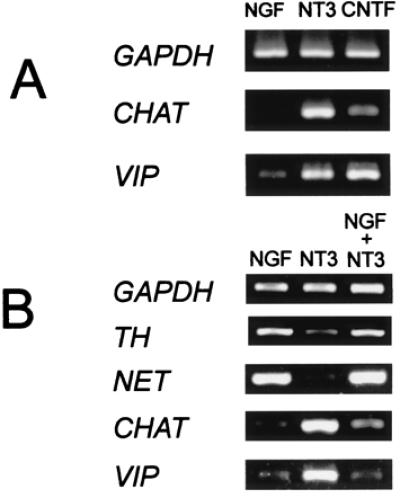
(A) The effects CNTF and NT3 are similar. Compared with NGF treatment, NT3 (15 ± 2:1) and CNTF (18 ± 6:1) had similar effects on VIP expression levels. CHAT levels were consistently higher with NT3 (>20:1) compared with CNTF (15 ± 2:1). (B) NGF effects are dominant over those of NT3. When E12 explants were cultured with a combination of NGF and NT3 (10 ng/ml each), the gene expression pattern closely resembled that observed with NGF alone. Expression of noradrenergic markers (TH, 5 ± 2:1:6 ± 3; NET, >20:1:>20) was increased compared with NT3-treated cultures, and cholinergic markers (CHAT, 1:>20:1; VIP, 1:15 ± 2:1) were not abundant.
In vivo, sympathetic neurons are exposed to both NGF and NT3. When cultures were treated with a combination of the two factors, the effects of NGF were dominant over those of NT3 for all genes analyzed (Fig. 3B), including TRKA and TRKC (1:8 ± 2 and 15 ± 2:1 in NT3 versus NT3 + NGF; data not shown).
NT3 might act as a selective survival factor for a TrkC-positive cholinergic subpopulation of cells. Alternatively, it could perform a survival-independent function as a differentiation factor. To discriminate between these possibilities, explants were first kept for a period of 4 days with NGF or NT3. Subsequently, the medium was changed, and the same neurotrophin was either reapplied or replaced by the other for the following 4 days (Fig. 4). Gene expression patterns were very similar for cells grown with the same neurotrophin for 4 or 8 days (data not shown). In the cultures where neurotrophins had been switched, cholinergic markers were induced by NT3 in previously noradrenergic NGF cultures (Fig. 4). In the cultures switched from NT3 to NGF, expression of cholinergic markers was reduced, whereas noradrenergic markers were up-regulated (Fig. 4).
Figure 4.
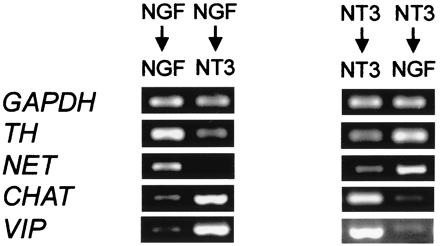
Switch experiments. E12 sympathetic explants were cultured with NGF or NT3 for 4 days in parallel cultures. Subsequently the ganglia were either kept for 4 further days with the same neurotrophin reapplied, or factors were switched. In cultures in which NT3 had replaced NGF, TH (5 ± 3:1) and NET (8 ± 2:1) expression levels were strongly reduced, while at the same time CHAT (1:10 ± 3) and VIP (1:8 ± 3) levels were elevated compared with cells kept with NGF for 8 consecutive days. The reverse phenomenon was observed when previously NT3-treated cells were switched to NGF. In this case TH (1:5 ± 2) and NET (1:12 ± 2) transcripts were induced, whereas CHAT (8 ± 2:1) and VIP (12 ± 2:1) expression levels decreased compared with cultures continuously grown with NT3.
To explore the possibility that these changes in gene expression levels were linked to cell death and proliferation in the explants, TUNEL and BrdUrd labeling experiments were performed (Table 1). No significant changes in the number of BrdUrd-positive nuclei were observed between switched and control cultures. Fewer apoptotic nuclei were observed in the presence of NGF compared with NT3, consistent with the stronger survival-promoting effect of NGF on sympathetic neurons. Although less cell death was observed in the presence of NGF in switched cultures, the differences in control cultures were not significant.
Table 1.
Cell death and proliferation in sympathetic explants
| Treatment | BrdUrd | TUNEL |
|---|---|---|
| NGF → NGF | 24.2 ± 11.3 (n = 30) | 9.0 ± 7.9 (n = 56) |
| NGF → NT3 | 30.5 ± 10.6 (n = 42) | 15.8 ± 6.8 (n = 56) |
| NT3 → NT3 | 26.3 ± 7.2 (n = 36) | 30.4 ± 16.8 (n = 19) |
| NT3 → NGF | 26.6 ± 5.6 (n = 51) | 22.5 ± 15.4 (n = 36) |
E12 ganglia were cultured for 4 days in the presence of NGF or NT3 (10 ng/ml). Subsequently the same factor was added again or was replaced by the other. Twenty-four hours later explants were fixed and the number of TUNEL-positive or BrdUrd-positive nuclei per ganglion was determined.
Therefore in our experiments with E12 sympathetic neurons, NT3 promoted cholinergic differentiation. However, previous experiments have shown that the same neurotrophin promotes catecholaminergic differentiation of neural crest cells at earlier developmental stages (34). This finding suggests that the effects of NT3 might depend on the developmental stage. To test this hypothesis, we isolated sympathetic chains from E7.5 embryos, when the ganglia have just formed. In contrast to the strong differences observed at E12, very similar expression patterns were observed in NT3-treated and NGF-treated cultures at E7.5 (Fig. 5). Hence, early sympathetic cells respond similarly to NGF and NT3, and a dichotomy between NT3 and NGF signaling develops between E7.5 and E12, coinciding with embryonic stages when sympathetic neuroblasts leave the cell cycle, begin to extend axons, and finally establish contacts with their target tissue.
Figure 5.
NT3 and NGF effects on early sympathetic neurons. E7.5 sympathetic explants were grown for 4 days with NGF or NT3. All markers analyzed were expressed at similar levels in the two cultures. Although there was a discernible trend for TRKC (and in some experiments for cholinergic markers) to be slightly elevated in NT3-treated compared with NGF-treated cultures, the differences were less than 2-fold.
In an attempt to correlate the expression of transcription factors with the neurotransmitter status at E12, we compared the transcript levels of two genes known to be functional in the acquisition of catecholaminergic properties by neural crest cells: cPHOX2A, the chicken ortholog of rodent paired-like homeobox 2a (35), and CASH-1, the chicken ortholog of Mash-1 (29). cPHOX2A was enriched in NGF-treated cultures, whereas the converse was observed for CASH-1 (Fig. 6).
Figure 6.
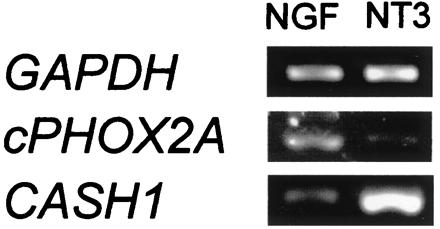
Expression of transcription factor genes. Transcription factor genes are differentially expressed in NT3- and NGF-treated explant cultures from E12 sympathetic ganglia. cPHOX2A transcripts, encoding a chicken homolog of the mouse paired-like homeobox transcription factors Phox2a, are more abundant in NGF-treated cultures (5 ± 2:1). Expression levels of the chicken achaete scute homolog CASH-1 (corresponding to mouse Mash-1) are higher in NT3-treated neurons (1:8 ± 2).
Discussion
The main result of this study is that NT3 dramatically enhances the expression of cholinergic marker genes in sympathetic neurons compared with NGF. Its effects are independent of neuronal survival, reversible, and strongly developmentally regulated. These results suggest a role for neurotrophins as mediators of neurotransmitter plasticity.
Our study employs explants of sympathetic chick ganglia cultured in defined medium. In general the development of the neurotransmitter phenotype is very similar in the sympathetic nervous system of rodents and birds. In both classes a population of ChAT-positive and VIP-positive and TH-negative cholinergic neurons develops at advanced developmental stages from catecholaminergic cells. Small differences in the timing of marker expression and in the influence exerted by the target tissue have been reported (reviewed in ref. 4). However, these apparent species differences might as easily be explained by differences in the response of secretomotor neurons in the rodent superior cervical ganglion and sudomotor neurons in the thoracolumbar paravertebral sympathetic chain (4). Bird embryos provide a particularly useful experimental system, because there is a large population of cholinergic neurons (36). Furthermore, the sympathetic chain can easily be dissected from avian embryos, allowing the collection of sufficient material to perform experiments with techniques of molecular biology. In contrast, the total number of neurons and the proportion of cholinergic cells are small in the classic rodent paradigm, the superior cervical ganglion (36).
The culture conditions in our experiments were identical to those used in a previous study with sensory neurons, where the differential gene expression pattern in explants of E8 dorsal root ganglia cultured with NGF or NT3 strictly reflected the expression pattern in NGF-dependent and NT3-dependent subpopulations in vivo (22). Our gene expression data are in good agreement with previous in vivo results. For instance, TH and the transcription factor cPHOX2A (37) were enriched in NGF-treated cultures, and we consistently observed a coregulation of the cholinergic markers VIP and ChAT. Likewise the catecholaminergic marker TH was always found to be coregulated with the NET gene, a highly specific marker for noradrenergic neurons (23, 38). Most importantly, our in vitro results are in accordance with the codistribution of ChAT and TrkC in vivo, and with the negative correlation between TH and TrkC expression domains (see Fig. 1). ChAT and TH are coexpressed in many neurons at earlier stages (E7), and only several days (E18) after the period analyzed by us (E12–E16) do the two markers completely segregate in vivo (16). Our study focuses on intermediate time points to approach molecular mechanisms underlying this segregation process. During this transition period we expect this process to be incomplete for many markers. We consistently found immunoreactivities for TrkC and ChAT in vivo to be strongly correlated but not perfectly overlapping.
Two observations may help to explain why the correlation between NT3 and the cholinergic phenotype of sympathetic neurons has not been established before. First, NT3 has massive effects on a wide variety of neural crest derivatives during early development, which may complicate the analysis of mice carrying a deletion in the Nt3 locus at later developmental stages, when the cholinergic phenotype is determined. This complication might explain why, in an initial analysis of cholinergic innervation of the sweat glands in NT3−/− animals, no change was observed (39). It is also worth pointing out that the small proportion of rodent cholinergic neurons, by comparison with avian ganglia, may prevent the detection of changes in this subpopulation. In TrkC−/− animals the cholinergic sympathetic population has not yet been analyzed. Second, at least in vitro, the neuropoietic cytokines affect cholinergic differentiation in a manner similar to that of NT3. Yet, in vivo, analysis of mice lacking Cntf, Lif, or both provided no evidence for a necessary role for these genes (3). Therefore cholinergic differentiation in vivo might be controlled by the concerted activity of several growth factors, and redundancy may mask the effects in animals with targeted deletions in single genes. In this context it is interesting to note that recently the RET gene was shown to be selectively expressed in cholinergic avian neurons (40). Because this gene encodes the tyrosine kinase receptor for glial cell line derived neurotrophic factor (GDNF) members of the GDNF family might also be functional in cholinergic differentiation.
Whether NT3 is present in the sweat glands of foot pads, the classical cholinergic target tissue, is currently not known. However, NT3 is expressed in developing and adult vasculature, the most likely cholinergic target tissue of avian sympathetic neurons (41). In addition, NT3 is expressed in muscle and skin tissue (42), as well as in early in sympathetic ganglia (42, 43) and, later, during neurite outgrowth from the ganglia, in blood vessels and sympathetic target tissue (44–46). Because cholinergic markers are already expressed in sympathetic chains during this outgrowth period, it is conceivable that NT3 supports the maintenance of early cholinergic marker expression in vivo before and during target contact.
The neurotrophin receptors TrkA, TrkC, and p75NTR are all expressed in sympathetic neurons throughout development (24, 47–49). NT3 appears to act on a population of cells expressing both TRKA and TRKC. Transcripts of both genes were detected in NT3-treated sympathetic ganglia. It is most likely that the expression of TrkA in these cultures and its activation by NGF or NT3 are prerequisites for the survival of the cells. More than 90% of E12 sympathetic chick neurons can be kept alive with NGF and about 40% with saturating concentrations of NT3. No significant additive increase in the number of surviving cells was observed in cultures treated with a combination of NGF and NT3 compared with NGF alone (unpublished data). That NT3-responsive neurons also react to NGF is demonstrated by two results. First, the effect of NT3 on cholinergic marker gene expression is abolished by NGF, and second, in cultures first treated with NT3, NET and TH expression was restored by NGF. Because the reverse effect is also observed, many of the TrkA-positive cells must also retain low levels of TrkC and therefore the capacity to respond to NT3. In conclusion, our results obtained with E12 neurons are consistent with NGF and NT3 acting on a population of cells expressing both receptors. This population responds differently to both factors with remarkable plasticity.
The coexpression of TRKC transcripts and cholinergic markers strongly implies that NT3 acts via TrkC to promote cholinergic differentiation. It appears then that the way in which cells interpret signals originating from NT3/TrkC is very different from the way in which they interpret NGF/TrkA signals, which initiate neuronal survival and the accumulation of noradrenergic markers. This dichotomy between TrkA and TrkC signaling in sympathetic neurons is surprising in view of the high degree of identity between the two receptors in their intracellular, signaling domains (24). Direct antagonistic interference of the effects of NGF and NT3 was evident in our experiments, when sympathetic neurons were treated with a combination of the two neurotrophins. More generally, antagonism might play an important role in the biology of neurotrophins. In particular, NGF demonstrates a death-promoting or -preventing activity, depending on whether it binds to TrkA or p75NTR (50).
It is important to define the intracellular signaling components of cholinergic differentiation, and we think that the differential expression of the transcription factors Cash-1 and cPhox2a in NT3-treated versus NGF-treated explants may represent a useful lead in this task. cPHOX2A is a chicken homolog of the mouse homeodomain genes Phox2a/b, which are expressed in all noradrenergic central and peripheral neurons (51, 52). Consistent with these reports, cPHOX2A was coexpressed with noradrenergic markers in our experiments. In contrast, CASH-1 (29) was coexpressed with cholinergic markers. This finding was not expected, because all central and peripheral noradrenergic structures are affected in mice with a targeted mutation of the ortholog gene Mash-1 (53). However, Mash-1, in contrast to Phox2a/b, seems to activate noradrenergic marker genes only indirectly, and rather confers neurogenic competence on neural crest cells (54). Our finding that at later stages CASH-1 is a marker for cells undergoing cholinergic differentiation is consistent with this role as a competence factor, which at this stage is a hallmark of cells differentiating further from the catecholaminergic to the cholinergic phenotype. Therefore both a growth factor (NT3) and a transcription factor (Cash-1) seem to serve first a function in catecholaminergic differentiation at early stages and subsequently in cholinergic differentiation at later stages of sympathetic development.
In conclusion, this study describes a hitherto unknown function of the neurotrophin NT3 as a differentiation factor for cholinergic sympathetic neurons. Neurotrophins thus appear to mediate yet another crucial aspect of epigenetic variability, in addition to the regulation of cell numbers and of synaptic plasticity.
Acknowledgments
We thank H. Müller and C. Cap for technical assistance and E. Casademunt and K. L. Tucker for comments on the manuscript. We are grateful to F. Lefcort, J.-F. Brunet, U. Ernsberger, M. Epstein, and P. Tsoulfas for providing reagents and sequences. We are indebted to Y.-A. Barde for many helpful discussions and his continuous support.
Abbreviations
- NGF
nerve growth factor
- NT3
neurotrophin-3
- Cash-1
chicken achaete scute homolog-1
- ChAT
choline acetyltransferase
- CNTF
ciliary neuronotrophic factor
- NET
norepinephrine transporter
- Phox2a
paired-like homeobox 2a
- TH
tyrosine hydroxylase
- VIP
vasoactive intestinal polypeptide
- En
embryonic day n
- GAPDH
glyceraldehyde-3-phosphate dehydrogenase
- TUNEL
terminal deoxynucleotidyltransferase-mediated dUTP end labeling
Footnotes
This paper was submitted directly (Track II) to the PNAS office.
Data deposition: The sequence reported in this paper has been deposited in the GenBank database (accession no. AF237673).
Article published online before print: Proc. Natl. Acad. Sci. USA, 10.1073/pnas.160080697.
Article and publication date are at www.pnas.org/cgi/doi/10.1073/pnas.160080697
References
- 1.Levi-Montalcini R, Booker B. Proc Natl Acad Sci USA. 1960;46:384–391. doi: 10.1073/pnas.46.3.384. [DOI] [PMC free article] [PubMed] [Google Scholar]
- 2.Thoenen H, Angeletti P U, Levi-Montalcini R, Kettler H. Proc Natl Acad Sci USA. 1971;68:1598–1602. doi: 10.1073/pnas.68.7.1598. [DOI] [PMC free article] [PubMed] [Google Scholar]
- 3.Francis N J, Landis S C. Annu Rev Neurosci. 1999;22:541–566. doi: 10.1146/annurev.neuro.22.1.541. [DOI] [PubMed] [Google Scholar]
- 4.Ernsberger U, Rohrer H. Cell Tissue Res. 1999;297:339–361. doi: 10.1007/s004410051363. [DOI] [PubMed] [Google Scholar]
- 5.Crowley C, Spencer S D, Nishimura M C, Chen K S, Pitts-Meek S, Armanini M P, Ling L H, McMahon S B, Shelton D L, Levinson A D, et al. Cell. 1994;76:1001–1011. doi: 10.1016/0092-8674(94)90378-6. [DOI] [PubMed] [Google Scholar]
- 6.Smeyne R J, Klein R, Schnapp A, Long L K, Bryant S, Lewin A, Lira S A, Barbacid M. Nature (London) 1994;368:246–249. doi: 10.1038/368246a0. [DOI] [PubMed] [Google Scholar]
- 7.Wyatt S, Piñón L G P, Ernfors P, Davies A M. EMBO J. 1997;16:3115–3123. doi: 10.1093/emboj/16.11.3115. [DOI] [PMC free article] [PubMed] [Google Scholar]
- 8.Tessarollo L, Tsoulfas P, Donovan M J, Palko M E, Blair-Flynn J, Hempstead B L, Parada L F. Proc Natl Acad Sci USA. 1997;94:14776–14781. doi: 10.1073/pnas.94.26.14776. [DOI] [PMC free article] [PubMed] [Google Scholar]
- 9.Fagan A M, Zhang H, Landis S, Smeyne R J, Silos-Santiago I, Barbacid M. J Neurosci. 1996;16:6208–6218. doi: 10.1523/JNEUROSCI.16-19-06208.1996. [DOI] [PMC free article] [PubMed] [Google Scholar]
- 10.Wyatt S, Davies A M. J Cell Biol. 1995;130:1435–1446. doi: 10.1083/jcb.130.6.1435. [DOI] [PMC free article] [PubMed] [Google Scholar]
- 11.Belliveau D J, Krivko I, Kohn J, Lachance C, Pozniak C, Rusakov D, Kaplan D, Miller F D. J Cell Biol. 1997;136:375–388. doi: 10.1083/jcb.136.2.375. [DOI] [PMC free article] [PubMed] [Google Scholar]
- 12.Huang E J, Wilkinson G A, Fariñas I, Backus C, Zang K L, Wong S L, Reichardt L F. Development (Cambridge, UK) 1999;126:2191–2203. doi: 10.1242/dev.126.10.2191. [DOI] [PMC free article] [PubMed] [Google Scholar]
- 13.Groves A K, George K M, Tissier-Seta J-P, Engel J D, Brunet J-F, Anderson D J. Development (Cambridge, UK) 1995;121:887–901. doi: 10.1242/dev.121.3.887. [DOI] [PubMed] [Google Scholar]
- 14.Reissmann E, Ernsberger U, Francis-West P H, Rueger D, Brickell P M, Rohrer H. Development (Cambridge, UK) 1996;122:2079–2088. doi: 10.1242/dev.122.7.2079. [DOI] [PubMed] [Google Scholar]
- 15.Schafer M K, Schutz B, Weihe E, Eiden L E. Proc Natl Acad Sci USA. 1997;94:4149–4154. doi: 10.1073/pnas.94.8.4149. [DOI] [PMC free article] [PubMed] [Google Scholar]
- 16.Ernsberger U, Patzke H, Rohrer H. Mech Dev. 1997;68:115–126. doi: 10.1016/s0925-4773(97)00135-4. [DOI] [PubMed] [Google Scholar]
- 17.Yamada T, Placzek M, Dodd J, Jessell T M. Cell. 1991;64:635–647. doi: 10.1016/0092-8674(91)90247-v. [DOI] [PubMed] [Google Scholar]
- 18.Schnurch H, Risau W. Development (Cambridge, UK) 1993;119:957–968. doi: 10.1242/dev.119.3.957. [DOI] [PubMed] [Google Scholar]
- 19.Johnson C D, Epstein M L. J Neurochem. 1986;46:968–976. doi: 10.1111/j.1471-4159.1986.tb13064.x. [DOI] [PubMed] [Google Scholar]
- 20.Lefcort F, Clary D O, Rusoff A C, Reichardt L F. J Neurosci. 1996;16:3704–3713. doi: 10.1523/JNEUROSCI.16-11-03704.1996. [DOI] [PMC free article] [PubMed] [Google Scholar]
- 21.Hamburger V, Hamilton H L. J Morphol. 1951;88:49–92. [PubMed] [Google Scholar]
- 22.Friedel R H, Schnurch H, Stubbusch J, Barde Y A. Proc Natl Acad Sci USA. 1997;94:12670–12675. doi: 10.1073/pnas.94.23.12670. [DOI] [PMC free article] [PubMed] [Google Scholar]
- 23.Pacholczyk T, Blakely R D, Amara S G. Nature (London) 1991;350:350–354. doi: 10.1038/350350a0. [DOI] [PubMed] [Google Scholar]
- 24.Schröpel A, Von Schack D, Dechant G, Barde Y-A. Mol Cell Neurosci. 1995;6:544–556. doi: 10.1006/mcne.1995.0006. [DOI] [PubMed] [Google Scholar]
- 25.Garner A S, Large T H. Neuron. 1994;13:457–472. doi: 10.1016/0896-6273(94)90360-3. [DOI] [PubMed] [Google Scholar]
- 26.Carrier A, Devignes M-D, Renoir D, Auffray C. J Neurochem. 1993;61:2215–2224. doi: 10.1111/j.1471-4159.1993.tb07462.x. [DOI] [PubMed] [Google Scholar]
- 27.Heuer J G, Fatemie-Nainie S, Wheeler E F, Bothwell M. Dev Biol. 1990;137:287–304. doi: 10.1016/0012-1606(90)90255-h. [DOI] [PubMed] [Google Scholar]
- 28.Talbot R T, Dunn I C, Wilson P W, Sang H M, Sharp P J. J Mol Endocrinol. 1995;15:81–91. doi: 10.1677/jme.0.0150081. [DOI] [PubMed] [Google Scholar]
- 29.Jasoni C L, Walker M B, Morris M D, Reh T A. Development (Cambridge, UK) 1994;120:769–783. doi: 10.1242/dev.120.4.769. [DOI] [PubMed] [Google Scholar]
- 30.Devay P, Qu X, Role L. Dev Biol. 1994;162:56–70. doi: 10.1006/dbio.1994.1066. [DOI] [PubMed] [Google Scholar]
- 31.Dechant G, Tsoulfas P, Parada L F, Barde Y-A. J Neurosci. 1997;17:5281–5287. doi: 10.1523/JNEUROSCI.17-14-05281.1997. [DOI] [PMC free article] [PubMed] [Google Scholar]
- 32.Saadat S, Sendtner M, Rohrer H. J Cell Biol. 1989;108:1807–1816. doi: 10.1083/jcb.108.5.1807. [DOI] [PMC free article] [PubMed] [Google Scholar]
- 33.Ernsberger U, Sendtner M, Rohrer H. Neuron. 1989;2:1275–1284. doi: 10.1016/0896-6273(89)90312-7. [DOI] [PubMed] [Google Scholar]
- 34.Zhang J M, Dix J, Langtimm-Sedlak C J, Trusk T, Schroeder B, Hoffmann R, Strosberg A D, Winslow J W, Sieber-Blum M. J Neurobiol. 1997;32:262–280. [PubMed] [Google Scholar]
- 35.Pattyn A, Morin X, Cremer H, Goridis C, Brunet J F. Development (Cambridge, UK) 1997;124:4065–4075. doi: 10.1242/dev.124.20.4065. [DOI] [PubMed] [Google Scholar]
- 36.Smith J, Vyas S, Garcia-Arraras J E. J Neurosci Res. 1993;34:346–356. doi: 10.1002/jnr.490340312. [DOI] [PubMed] [Google Scholar]
- 37.Stanke M, Junghans D, Geissen M, Goridis C, Ernsberger U, Rohrer H. Development (Cambridge, UK) 1999;126:4087–4094. doi: 10.1242/dev.126.18.4087. [DOI] [PubMed] [Google Scholar]
- 38.Lorang D, Amara S G, Simerly R B. J Neurosci. 1994;14:4903–4914. doi: 10.1523/JNEUROSCI.14-08-04903.1994. [DOI] [PMC free article] [PubMed] [Google Scholar]
- 39.Elshamy W M, Linnarsson S, Lee K F, Jaenisch R, Ernfors P. Development (Cambridge, UK) 1996;122:491–500. doi: 10.1242/dev.122.2.491. [DOI] [PubMed] [Google Scholar]
- 40.Ernsberger U, Reissmann E, Mason I, Rohrer H. Mech Dev. 2000;92:169–177. doi: 10.1016/s0925-4773(99)00336-6. [DOI] [PubMed] [Google Scholar]
- 41.Scarisbrick I A, Jones E G, Isackson P J. J Neurosci. 1993;13:875–893. doi: 10.1523/JNEUROSCI.13-03-00875.1993. [DOI] [PMC free article] [PubMed] [Google Scholar]
- 42.Schecterson L, Bothwell M. Neuron. 1992;9:449–463. doi: 10.1016/0896-6273(92)90183-e. [DOI] [PubMed] [Google Scholar]
- 43.Verdi J M, Groves A K, Fariñas I, Jones K, Marchionni M A, Reichardt L F, Anderson D J. Neuron. 1996;16:515–527. doi: 10.1016/s0896-6273(00)80071-9. [DOI] [PMC free article] [PubMed] [Google Scholar]
- 44.Fariñas I, Wilkinson G A, Backus C, Reichardt L F, Patapoutian A. Neuron. 1998;21:325–334. doi: 10.1016/s0896-6273(00)80542-5. [DOI] [PMC free article] [PubMed] [Google Scholar]
- 45.Francis N, Farinas I, Brennan C, Rivas-Plata K, Backus C, Reichardt L, Landis S. Dev Biol. 1999;210:411–427. doi: 10.1006/dbio.1999.9269. [DOI] [PubMed] [Google Scholar]
- 46.Tojo H, Takami K, Kaisho Y, Nakata M, Abe T, Shiho O, Igarashi K. Neurosci. 1996;71:221–230. doi: 10.1016/0306-4522(95)00445-9. [DOI] [PubMed] [Google Scholar]
- 47.Von Holst A, Lefcort F, Rohrer H. Eur J Neurosci. 1997;9:2169–2177. doi: 10.1111/j.1460-9568.1997.tb01383.x. [DOI] [PubMed] [Google Scholar]
- 48.Zhang D, Yao L, Bernd P. J Neurobiol. 1994;25:1517–1532. doi: 10.1002/neu.480251205. [DOI] [PubMed] [Google Scholar]
- 49.Tafreshi A P, Zhou X F, Rush R A. Neuroscience. 1998;83:373–380. doi: 10.1016/s0306-4522(97)00385-0. [DOI] [PubMed] [Google Scholar]
- 50.Frade J M, Rodríguez-Tébar A, Barde Y A. Nature (London) 1996;383:166–168. doi: 10.1038/383166a0. [DOI] [PubMed] [Google Scholar]
- 51.Tiveron M C, Hirsch M R, Brunet J F. J Neurosci. 1996;16:7649–7660. doi: 10.1523/JNEUROSCI.16-23-07649.1996. [DOI] [PMC free article] [PubMed] [Google Scholar]
- 52.Pattyn A, Morin X, Cremer H, Goridis C, Brunet J F. Nature (London) 1999;399:366–370. doi: 10.1038/20700. [DOI] [PubMed] [Google Scholar]
- 53.Guillemot F, Lo L-C, Johnson J E, Auerbach A, Anderson D J, Joyner A L. Cell. 1993;75:463–476. doi: 10.1016/0092-8674(93)90381-y. [DOI] [PubMed] [Google Scholar]
- 54.Edlund T, Jessell T M. Cell. 1999;96:211–224. doi: 10.1016/s0092-8674(00)80561-9. [DOI] [PubMed] [Google Scholar]