Abstract
It recently was reported that Duchenne muscular dystrophy (DMD) patients and mdx mice have elevated levels of caveolin-3 expression in their skeletal muscle. However, it remains unknown whether increased caveolin-3 levels in DMD patients contribute to the pathogenesis of DMD. Here, using a genetic approach, we test this hypothesis directly by overexpressing wild-type caveolin-3 as a transgene in mice. Analysis of skeletal muscle tissue from caveolin-3- overexpressing transgenic mice reveals: (i) a dramatic increase in the number of sarcolemmal muscle cell caveolae; (ii) a preponderance of hypertrophic, necrotic, and immature/regenerating skeletal muscle fibers with characteristic central nuclei; and (iii) down-regulation of dystrophin and β-dystroglycan protein expression. In addition, these mice show elevated serum creatine kinase levels, consistent with the myo-necrosis observed morphologically. The Duchenne-like phenotype of caveolin-3 transgenic mice will provide an important mouse model for understanding the pathogenesis of DMD in humans.
Caveolae are 50- to 100-nm vesicular invaginations of the plasma membrane that participate in vesicular trafficking events and signal transduction processes (1–5). Caveolin, a 21- to 24-kDa integral membrane protein, is a principal component of caveolae membranes in vivo (6–10). Caveolin is only the first member of a new gene family; as a consequence, caveolin has been retermed caveolin-1 (11).
The mammalian caveolin gene family consists of caveolins 1, 2, and 3 (3, 11–13). Caveolins 1 and 2 are coexpressed and form a hetero-oligomeric complex (14) in many cell types, with particularly high levels in adipocytes, whereas expression of caveolin-3 is muscle-specific and found in both cardiac and skeletal muscle, as well as smooth muscle cells (15). It has been proposed that caveolin family members function as scaffolding proteins (16) to organize and concentrate specific lipids (cholesterol and glyco-sphingolipids; refs. 17–19) and lipid-modified signaling molecules (Src-like kinases, H-Ras, eNOS, and G proteins; refs. 17 and 20–24) within caveolae membranes.
Expression of caveolin-3 is induced during the differentiation of skeletal myoblasts, and caveolin-3 is localized to the muscle cell plasma membrane (sarcolemma) where it forms a complex with dystrophin and its associated glycoproteins (15). Under certain conditions caveolin-3 can be physically separated from the dystrophin complex (25). This indicates that although caveolin-3 is dystrophin-associated, it is not absolutely required for the biogenesis of the dystrophin complex (25).
Caveolin-3 is most closely related to caveolin-1 based on protein sequence homology; caveolin-1 and caveolin-3 are ≈65% identical and ≈85% similar (for an alignment see ref. 13). However, caveolin-3 mRNA is expressed predominantly in muscle tissue types (skeletal muscle, diaphragm, and heart) (13). Identification of a muscle-specific member of the caveolin gene family has implications for understanding the role of caveolins in different muscle cell types, as previous morphological studies have demonstrated that caveolae are abundant in these cells. This indicates that muscle cell caveolae may play an important role in muscle membrane biology.
Duchenne muscular dystrophy (DMD) is one of the most common and severe muscle disorders, caused by a deficiency of dystrophin, the protein product of the DMD gene. Several morphological and biochemical observations seemingly implicate caveolae and caveolin-3 in the pathogenesis of DMD. Dystrophin has been localized to plasma membrane caveolae in smooth muscle cells by using immuno-electron microscopy techniques (26). In addition, previous studies using electron microscopy and freeze-fracture techniques have shown that there are an increased number of caveolae in the skeletal muscle of DMD patients, but not in other forms of neuronally based muscular dystrophies examined (27). In accordance with an increased number of caveolae in DMD patients, it recently was reported that mdx mice (an animal model of DMD, with a dystrophin deficiency) have increased levels of caveolin-3 expression in their skeletal muscle (by ≈2- to 3-fold) (28). We recently have obtained similar results with muscle biopsies from DMD patients; thus, up-regulation of caveolin-3 expression occurs in humans with DMD (29).
Tight regulation of caveolin-3 expression appears essential for maintaining normal muscle homeostasis, as loss of caveolin-3 expression results in a different form of muscular dystrophy (limb-girdle muscular dystrophy, type 1C) (30). Similarly, the liver responds in a limited number of ways to a variety of distinct environmental pathogens/toxins, producing either hepatocellular carcinoma or cirrhosis–end-stage liver disease. Thus, both of these conditions (Cav-3 up-regulation or down-regulation) may lead to pathological outcomes, indicating that homeostasis is indeed a delicate balance. This concept of deficiency vs. overdose occurs repeatedly in many medical disorders. For example, if the levels of the hormone erythropoietin are low, this will result in anemia (because of decreased red cell production). In contrast, if the levels of erythropoietin are too high this will result in overproduction of red blood cells, predisposing the individual to a high risk of stroke.
It remains unknown whether increased caveolin-3 levels in DMD patients contribute to the pathogenesis of DMD. Here, using a genetic approach, we test this hypothesis by overexpressing wild-type caveolin-3 as a transgene in mice.
Materials and Methods
Materials.
Antibody sources were as follow: anti-caveolin-3 IgG [mAb, clone 26 (15); gift of Roberto Campos-Gonzalez, Transduction Laboratories, Lexington, KY; (15)]; anti-β-dystroglycan IgG (mAb, NCL-b-DG; NovoCastra, Newcastle, U.K.); anti-dystrophin IgG (mAb, NCL-DYS3; NovoCastra); anti-alpha2 chain of merosin IgG (mAb, 1922; Chemicon); anti-spectrin IgG (mAb, NCL-SPEC1; NovaCastra and rabbit pAb, S1515; Sigma-Aldrich). In addition, a well-characterized rabbit polyclonal antibody directed against dystrophin was the generous gift of Eduardo Bonilla (Columbia University, New York) and was as described (31).
Generation of Caveolin-3 Transgenic Mice.
The full-length untagged cDNA encoding rodent caveolin-3 was subcloned into the EcoRI site of the multiple cloning site (MCS) region of the transgenic expression vector pCAGGS (gift of Armin Rehm, Ploegh Laboratory, Harvard Medical School, Boston, ref. 32). In the pCAGGS vector, the cytomegalovirus (CMV) enhancer and the chicken β-actin promoter sequence are located upstream of the MCS region. In addition, a rabbit β-globin poly(A) sequence is located downstream from the MCS region (see Fig. 1A). The resulting plasmid, pCAGGS-Cav-3, was digested SalI and HindIII to isolate the transgenic cassette consisting of the CMV enhancer, the chicken β-actin promoter, the caveolin-3 cDNA, and the rabbit β-globin poly(A) sequence. The isolated region was purified for pronuclear injection into mouse embryos from FVB mice (Taconic Farms). Mouse embryos (fertilized one-cell zygotes) were injected and implanted in female CD-1 mice (Charles River Breeding Laboratories) at the Transgenic Mouse Facility at Einstein. Caveolin-3 transgenic mice were identified by slot blot analysis using genomic DNA prepared from mouse tails. A fragment containing the rabbit β-globin poly(A) sequence, obtained by digesting the pCAGGS vector with EcoRI and HindIII, was radio-labeled and used as the probe for slot blot analysis. Caveolin-3- positive founder transgenic mice then were back-crossed at least three times with C57BL/6 mice (Jackson Laboratories). Positive mice comprising the F4 generation were subjected to detailed analyses.
Figure 1.
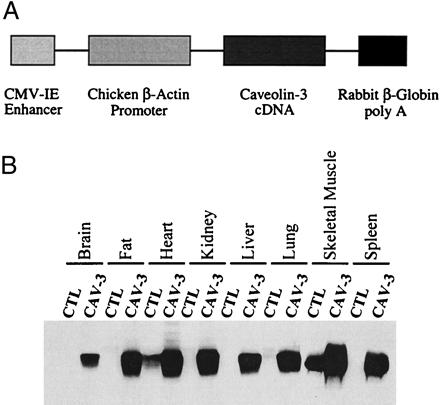
Construction and expression of a transgenic vector encoding caveolin-3. (A) The caveolin-3 transgenic expression cassette. The full-length untagged cDNA encoding caveolin-3 was subcloned into the expression vector pCAGGS. Note that in the pCAGGS-Cav-3 construct, the CMV enhancer and the chicken β-actin promoter sequence are located upstream the caveolin-3 cDNA, whereas the rabbit β-globin poly(A) sequence is located downstream of the caveolin-3 cDNA. The CMV enhancer/β-actin promoter sequences are expected to drive constitutive expression of caveolin-3 in a wide variety of tissue types. (B) Western blot analysis. The expression of caveolin-3 in normal control mice (CTL) and caveolin-3 transgenic mice (CAV-3) is shown. Protein lysates were prepared from a variety of mouse tissues. Immunoblotting was performed with a mono-specific antibody probe that recognizes only caveolin-3 (mAb 26). Note that in normal control mice caveolin-3 is expressed only in heart and skeletal muscle. In contrast, caveolin-3 transgenic mice express caveolin-3 in all tissues examined and demonstrate elevated levels of caveolin-3 in heart and skeletal muscle. Each lane contains an equal amount of total protein.
The muscular dystrophy phenotype was first observed in 3- to 4-week-old male mice; we have now analyzed male mice that are up to 15 months old and they retain the same phenotype. For all experiments described herein, each experiment was repeated at least twice, and four mice were analyzed in a given experimental group.
Immunoblot Analysis.
Mouse tissues were harvested, minced with a scissors, homogenized in a polytron tissue grinder for 30 sec at a medium-range speed, and solubilized in a buffer containing 10 mM Tris⋅HCl (pH 8.0), 150 mM NaCl, 5 mM EDTA, 1% Triton X-100, and 60 mM octyl-glucoside for 45 min at 4°C. In addition, samples were centrifuged at 13,000 × g for 10 min at 4°C to remove insoluble proteins (33). Soluble proteins were resolved by SDS/PAGE (12.5% or 8% acrylamide) and transferred to nitrocellulose membranes.
Immunohistochemistry.
Formalin-fixed, paraffin-embedded murine tissue sections were deparaffinized, rehydrated, quenched with hydrogen peroxide, and treated for 5 min with a solution of 1% SDS in Tris-buffered saline (100 mM Tris, pH 7.4/138 mM NaCl/27 mM KCl), as described (14, 15, 34). The sections then were incubated with anti-caveolin-3 IgG (mAb 26; diluted 1:800 in PBS containing 1% BSA) overnight at 4°C. After washing, immunoreactivity was detected by using a Dako LSAB2 Kit and the DAB Plus System (Dako) according to the manufacturer's recommended procedures.
Histological and Histochemical Analysis.
Muscle tissue sections were subjected to hematoxylin/eosin staining, modified Gomori's trichrome staining, and NADH-tetrazolium reductase staining, essentially as described (35).
Immunostaining of Murine Skeletal Muscle Tissue Sections.
Samples were isolated from the extensor digitorum longus, the soleus, and the gastrocnemius muscle, rapidly frozen in liquid nitrogen-cooled isopentane, sectioned, and stored in liquid nitrogen. Unfixed serial sections (4 μm thick) of frozen muscle were incubated for 1 h at room temperature with the primary antibody: anti-caveolin-3 IgG, anti-anti-β-dystroglycan IgG, anti-merosin IgG, anti-spectrin IgG, or with anti-dystrophin IgG; antibodies were diluted ≈1,000-fold in PBS. Sections were washed three times in PBS (10 min each) and incubated for 1 h at room temperature with the secondary antibody: FITC-conjugated goat anti-mouse antibody (5 μg/ml). After washing, sections were mounted with slow-Fade anti-fade reagent and examined by confocal microscopy (14, 15, 34). For propidium iodide staining, sections were incubated for 30 min at room temperature with RNase (10 μg/ml) and for 10 min at room temperature with propidium iodide (20 μg/ml), before incubation with the primary antibody (36).
Transmission Electron Microscopy.
Mouse skeletal muscle tissue sections were fixed with glutaraldehyde, postfixed with OsO4, and stained with uranyl acetate and lead citrate. Samples were examined under a JEOL 1200EX transmission electron microscope and photographed at a magnification of ×25,000 (37–39). Caveolae were identified by their characteristic flask shape, size (50–100 nm), and location at or near the plasma membrane (40).
Creatine Kinase Assay.
Creatine kinase activity was measured from EDTA-treated blood samples by using the creatine kinase EC 2.7.3.2 UV test kit (Sigma) according to the manufacturer's instructions.
Results
Expression of Caveolin-3 in Mice as a Transgene.
To achieve broad expression of caveolin-3 in mice as a transgene, the cDNA for caveolin-3 was inserted into a vector (pCAGGS) driven by the CMV enhancer and the chicken β-actin promoter, followed by the rabbit β-globin polyadenylation signal (Fig. 1A; ref. 32).
Positive mice harboring the caveolin-3 transgene were identified by slot blot analysis of their genomic DNA, using the rabbit β-globin sequence as a probe. To confirm expression of the caveolin-3 protein, their organs were harvested and subjected to Western blot analysis using a caveolin-3 specific mAb probe. Fig. 1B shows that high levels of caveolin-3 transgene expression were observed in brain, fat, heart, kidney, liver, lung, skeletal muscle tissue, and spleen. In contrast, normal control mice lacking the caveolin-3 transgene show expression of caveolin-3 in only heart and skeletal muscle, consistent with its known pattern of muscle-specific expression. Quantitation revealed that in caveolin-3-positive transgenic mice, caveolin-3 is overexpressed ≈3- to 5-fold in heart and skeletal muscle, relative to endogenous caveolin-3 levels.
To examine transgene expression of caveolin-3 at the microscopic level, paraffin sections were prepared and immunostained with anti-caveolin-3 IgG. Positive staining was visualized by using a peroxidase-based approach. Using this technique, the wide overexpression of the caveolin-3 transgene in brain, fat, heart, kidney, liver, lung, skeletal muscle tissue, and spleen also was observed morphologically at the cellular level, as compared with normal control mice lacking the caveolin-3 transgene (Fig. 2). It is important to note that overexpression of caveolin-3 was uniformly distributed.
Figure 2.
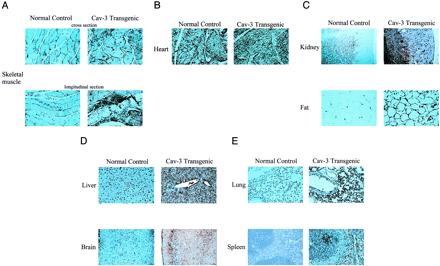
Immunohistochemical analysis of the tissue distribution of caveolin-3 in normal control mice and caveolin-3 (Cav-3) transgenic mice. Paraffin-embedded tissue sections were prepared and immunostained with anti-caveolin-3 IgG. After extensive washing, bound primary antibodies were visualized by using a peroxidase-based detection method (see Materials and Methods). Note that in normal control mice, caveolin-3 expression is essentially confined to striated muscle tissues [skeletal muscle (A) and heart (B)]. In contrast, in caveolin-3 transgenic mice, caveolin-3 is widely expressed in a variety of different tissues: kidney, fat (C); liver, brain (D); lung, spleen (E). In skeletal muscle (A) and in the heart (B), note that caveolin-3 transgenic mice exhibit overexpression of caveolin-3 when compared with the endogenous expression observed in normal control mice.
Electron microscopic analysis of skeletal muscle fibers revealed that the number of plasmalemmal caveolae was also dramatically increased in caveolin-3-positive transgenic mice (Fig. 3). This is consistent with previous observations demonstrating that recombinant expression of caveolin-3 in cultured cells is sufficient to drive caveolae formation (41).
Figure 3.
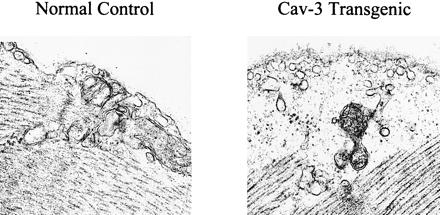
Up-regulation of skeletal muscle caveolae organelles in caveolin-3 (Cav-3) transgenic mice. Transmission electron micrographs of skeletal muscle tissue sections from normal control mice and caveolin-3 transgenic mice are shown. Note that overexpression of caveolin-3 in the transgenic mice (Right) results in the formation of an increased number of caveolae when compared with normal control mice (Left).
Overexpression of Caveolin-3 in Skeletal Muscle Fibers Induces a Muscular Dystrophy Phenotype.
To identify a possible phenotype associated with transgenic overexpression of caveolin-3, tissue sections from these mice were hematoxylin/eosin-stained and examined by light microscopy. Interestingly, no pathological changes were observed, with the exception of skeletal muscle tissue (Fig. 4 and data not shown). It is important to stress that several pathologists carefully assessed the other tissues where caveolin-3 is expressed and did not observe any noticeable pathologic changes.
Figure 4.
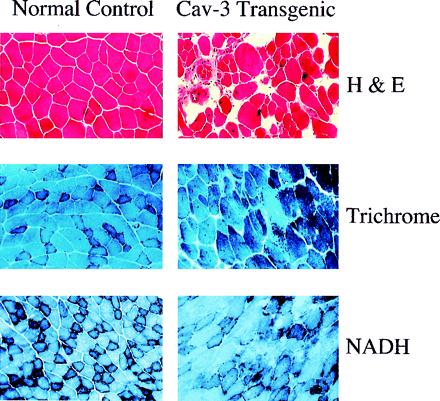
Histological and histochemical analysis of skeletal muscle fibers from caveolin-3 (Cav-3) transgenic mice. Muscle tissue sections from normal control mice (Left) and caveolin-3 transgenic mice (Right) were stained with hematoxylin and eosin (H&E) (Top), modified Gomori's trichrome (Middle), or NADH-tetrazolium reductase (Bottom). Note that muscle tissue sections from caveolin-3 transgenic mice exhibit dramatic variability in the size of muscle fibers, an elevated number of necrotic fibers and regenerating muscle fibers (i.e., fibers with centrally located nuclei), and significant proliferation of connective tissue.
Hematoxylin/eosin staining of skeletal muscle from caveolin-3-positive transgenic mice revealed a number of pathological changes that often are associated with muscular dystrophy (Fig. 4 Top). These included the presence of numerous hypertrophic fibers, regenerating and immature fibers with their characteristic central nuclei, necrotic fibers, and an increase in the connective tissue component within the muscle. The involvement of both slow and fast muscle fibers was demonstrated by using trichrome and NADH staining techniques (Fig. 4 Middle and Bottom).
To better visualize the number of fibers with central nuclei, skeletal muscle tissue sections were doubly stained with anti-caveolin-3 IgG (to demarcate the sarcolemma, aka, the muscle cell plasma membrane) and propidium iodide (to demarcate the nuclei) (Fig. 5A). Quantitation of these images reveals that ≈82% of the muscle fibers in caveolin-3-positive transgenic mice contain central nuclei, whereas only ≈0.5% of the fibers in normal control mice lacking the caveolin-3 transgene contain central nuclei (Fig. 5B). These results indicate that the bulk of the skeletal muscle fibers in caveolin-3 transgenic mice are immature or are undergoing regeneration.
Figure 5.
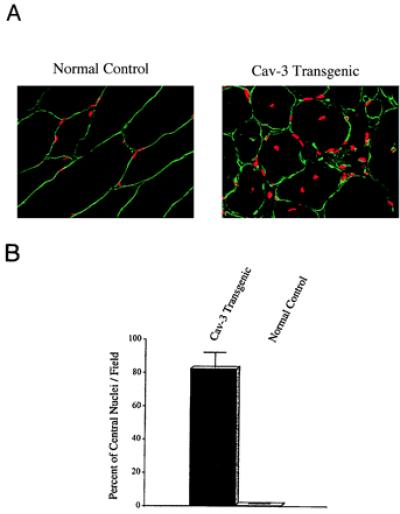
Caveolin-3 (Cav-3) transgenic mice exhibit an elevated number of skeletal muscle fibers with centrally located nuclei. (A) Immunocytochemistry. Skeletal muscle tissue sections from normal control mice (Left) and caveolin-3 transgenic mice (Right) were immunostained with anti-caveolin-3 IgG to reveal the muscle fiber sarcolemma (plasma membrane) and counterstained with propidium iodide to visualize the nuclei. The resulting merged images are shown to better allow visualization of the position of the nuclei with respect to the plasma membrane. (B) Quantitation of central nucleation. The number of muscle fibers with central nuclei is represented as percentage of the total muscle fibers analyzed. Note that in caveolin-3 transgenic mice ≈82% of the muscle fibers contain central nuclei, whereas ≈0.5% of muscle fibers from normal control mice exhibit central nuclei. These values were determined by examining the morphology of muscle fibers from > 30 different fields.
In addition to the muscle biopsy, serum creatine kinase levels are used clinically to diagnose muscular dystrophy. As creatine kinase is a cytosolic muscle enzyme, elevated serum creatine kinase levels indicate lysis or necrosis of muscle fibers, with subsequent release of the enzyme into the blood. Interestingly, caveolin-3-positive transgenic mice show a ≈4- to 5-fold increase in serum creatine kinase levels (Fig. 6), consistent with the skeletal muscle fiber necrosis observed in tissue sections (Fig. 4). These morphological and biochemical data clearly indicate that transgenic overexpression of caveolin-3 in skeletal muscle induces a muscular dystrophy phenotype.
Figure 6.
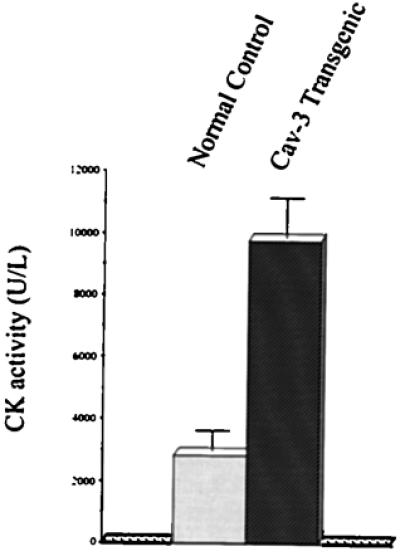
Caveolin-3 (Cav-3) transgenic mice have elevated levels of serum creatine kinase (CK), consistent with myo-necrosis. Creatine kinase activity was measured in serum from normal control mice and caveolin-3 transgenic mice by using a standard colorimetric assay. Note that caveolin-3 transgenic mice exhibit elevated serum creatine kinase activity (≈4- to 5-fold), as compared with normal control mice. Values represent the average of eight measurements (performed in duplicate) from four different control mice and four different caveolin-3 transgenic mice.
Down-Regulation of Dystrophin and Dystrophin-Associated Proteins in Caveolin-3-Positive Transgenic Mice.
What is the mechanism by which caveolin-3 overexpression induces a muscular dystrophy phenotype? Because caveolin-3 is found associated with dystrophin and dystrophin-associated glycoproteins at the level of the sarcolemma (15, 42), one possibility is that overexpression of caveolin-3 disrupts the normal processing or stoichiometry of the dystrophin complex, leading to its degradation. To test this hypothesis, we next examined the status of dystrophin and dystrophin-associated glycoproteins (e.g., β-dystroglycan) in these mice.
Western blot analysis of lysates prepared from skeletal muscle tissue revealed that caveolin-3-positive transgenic mice contain virtually undetectable levels of dystrophin and dramatically reduced levels of β-dystroglycan (≈3- to 4-fold reduction), whereas they overexpress caveolin-3 by ≈3- to 5-fold (Fig. 7A). Virtually identical results were obtained by immunocytochemistry, indicating that both dystrophin and β-dystroglycan are down-regulated in these caveolin-3-positive transgenic animals (Fig. 7B).
Figure 7.
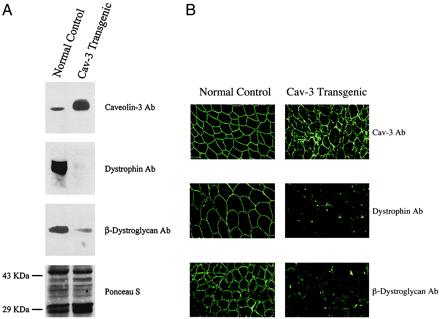
Down-regulation of dystrophin and β-dystroglycan in skeletal muscle tissue from caveolin-3 (Cav-3) transgenic mice. (A) Western blot analysis. Protein lysates of skeletal muscle tissue were prepared from normal control mice and caveolin-3 transgenic mice. After SDS/PAGE and transfer to nitrocellulose, immunoblotting was performed with monospecific antibodies directed against caveolin-3, dystrophin, and β-dystroglycan. Note that expression of dystrophin and β-dystroglycan is dramatically reduced in skeletal muscle from caveolin-3 transgenic mice. Each lane contains an equal amount of total protein. Visual inspection of the Ponceau S-stained blot of these muscle lysates was used to confirm equal protein loading. Note that the overall pattern of the proteins expressed does not change in caveolin-3 transgenics. (B) Immunocytochemistry. Skeletal muscle tissue sections were prepared from normal control mice (Left) and caveolin-3 transgenic mice (Right). After immuno-staining with antibodies directed against caveolin-3 (Top), dystrophin (Middle), and β-dystroglycan (Bottom), samples were observed under a confocal microscope. Note that β-dystroglycan and dystrophin are expressed at significantly lower levels in caveolin-3 transgenic mice.
In contrast, staining for merosin and spectrin was normal in both control mice and caveolin-3 transgenic mice (data not shown). Labeling for spectrin was used to monitor membrane integrity. In fact, fibers that show negative labeling for both dystrophin and spectrin are considered damaged, whereas fibers that are negative only for dystrophin but positive for spectrin reflect true abnormalities of dystrophin expression (43, 44). Thus, it appears that overexpression of caveolin-3 in skeletal muscle can induce a muscular dystrophy phenotype, in part by disrupting the dystrophin complex.
External Rotation of the Hind Paws in Caveolin-3 Transgenic Mice.
To examine the walking patterns of wild-type and caveolin-3 transgenic mice, we performed hind-paw footprint analysis (45, 46). Analysis of the tracks indicated that the hind paws of caveolin-3 transgenic mice were externally rotated as compared with normal controls (Fig. 8). Such external rotation is known to be caused by muscle degeneration with tendon retraction and is not uncommonly observed in patients with DMD.
Figure 8.
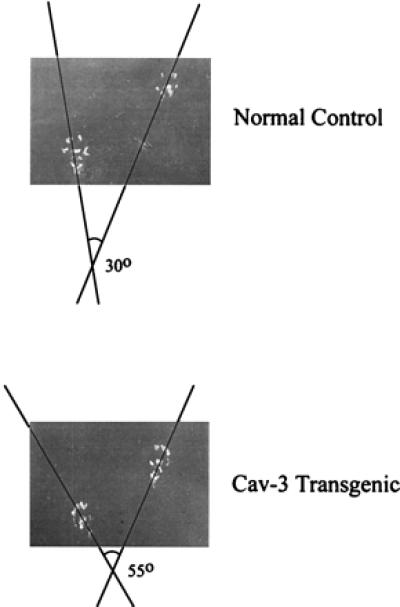
External rotation of the hind paws in caveolin-3 (Cav-3) transgenic mice. Note that the hind paws of caveolin-3 transgenic mice are externally rotated as compared with normal controls. No bony abnormalities were observed (not shown). A representative footprint pattern from a normal and caveolin-3 transgenic mouse are shown.
Discussion
Here, we have overexpressed wild-type caveolin-3 as a transgene in mice. Analysis of skeletal muscle tissue from caveolin-3-overexpressing transgenic mice revealed: (i) a dramatic increase in sarcolemmal caveolae; (ii) hypertrophic, necrotic, and regenerating skeletal muscle fibers with central nuclei; and (iii) down-regulation of dystrophin and β-dystroglycan protein expression. One possibility is that overexpression of caveolin-3 disrupts the normal processing or stoichiometry of the dystrophin complex, leading to its degradation. Our current results support this hypothesis. In addition, these mice show elevated serum creatine kinase levels, consistent with the myo-necrosis observed morphologically.
Caveolin-3 is clearly functional in these transgenic mice, as it induces the up-regulation of the formation of caveolae, as seen by electron microscopy in Fig. 3. Fractionation experiments using muscle from these transgenic mice also show that caveolin-3 is correctly targeted to the caveolae fraction (data not shown). It is important to note that we also have derived caveolin-1 transgenic mice that overexpress caveolin-1 under the control of the same promoter and they overexpress high levels of caveolin-1 in muscle (not shown). However, these mice do not show a muscular dystrophy phenotype or any other discernible phenotype. These results demonstrate that the effects we observed may be caveolin-3-specific.
Caveolin-3, mdx Mice, and DMD.
In the mdx mouse, a mutation within the dystrophin gene leads to the expression of a truncated labile protein that fails to attach to the sarcolemma (47, 48). The result is a dystrophin deficiency associated with a secondary deficiency of dystrophin-associated proteins (49). However, the affected mice do not show significant necrosis in most muscles, although new regenerating fibers retain central nuclei after reaching maturity (49). In particular, mdx mice do not show proliferation of connective tissue that is the typical marker of dystrophic muscle in DMD and in other primitive myopathies that are caused by a deficiency of other components of the dystrophin-protein complex. It remains unresolved why the dystrophin deficiency of the mdx mouse results in only a mild muscular dystrophy phenotype.
In our caveolin-3 transgenic mice, dystrophin is severely deficient, whereas merosin appears normally expressed (data not shown). Further, we observed a significant proliferation of connective tissue associated with degeneration and regeneration of muscle fibers. These observations lead to the conclusion that caveolin-3 transgenic mice behave more as a Duchenne-like dystrophy than other known dystrophic mouse models. Thus, the Duchenne-like phenotype of caveolin-3 transgenic mice will provide an important direction for understanding of pathogenesis of DMD in humans.
Acknowledgments
We thank members of the Lisanti laboratory, especially Dr. Federica Sotgia, for helpful discussions. We are very grateful to Dr. Eduardo Bonilla (Columbia University) for his expertise in the harvesting of skeletal muscle tissue, Dr. David Weinstein (Albert Einstein) for help with hind-paw footprint analysis, and Rachel Tucker and Iqbal Habib (Immuno-histochemistry Lab of Montefiore Medical Center) for expert assistance. F.G. was the recipient of a fellowship from Telethon-Italia (no. 470/bi). This work was supported by grants from the National Institutes of Health (to M.P.L.; RO1 AR-46792) and Telethon-Italia (to C.M.; no. 1111).
Abbreviations
- DMD
Duchenne muscular dystrophy
- CMV
cytomegalovirus
Footnotes
Article published online before print: Proc. Natl. Acad. Sci. USA, 10.1073/pnas.160249097.
Article and publication date are at www.pnas.org/cgi/doi/10.1073/pnas.160249097
References
- 1.Lisanti M P, Scherer P, Tang Z-L, Sargiacomo M. Trends Cell Biol. 1994;4:231–235. doi: 10.1016/0962-8924(94)90114-7. [DOI] [PubMed] [Google Scholar]
- 2.Couet J, Li S, Okamoto T, Scherer P S, Lisanti M P. Trends Cardiovasc Med. 1997;7:103–110. doi: 10.1016/S1050-1738(97)00001-7. [DOI] [PubMed] [Google Scholar]
- 3.Okamoto T, Schlegel A, Scherer P E, Lisanti M P. J Biol Chem. 1998;273:5419–5422. doi: 10.1074/jbc.273.10.5419. [DOI] [PubMed] [Google Scholar]
- 4.Engelman J A, Zhang X L, Galbiati F, Volonte D, Sotgia F, Pestell R G, Minetti C, Scherer P E, Okamoto T, Lisanti M P. Am J Hum Genet. 1998;63:1578–1587. doi: 10.1086/302172. [DOI] [PMC free article] [PubMed] [Google Scholar]
- 5.Smart E J, Graf G A, McNiven M A, Sessa W C, Engelman J A, Scherer P E, Okamoto T, Lisanti M P. Mol Cell Biol. 1999;19:7289–7304. doi: 10.1128/mcb.19.11.7289. [DOI] [PMC free article] [PubMed] [Google Scholar]
- 6.Glenney J R. J Biol Chem. 1989;264:20163–20166. [PubMed] [Google Scholar]
- 7.Glenney J R, Soppet D. Proc Natl Acad Sci USA. 1992;89:10517–10521. doi: 10.1073/pnas.89.21.10517. [DOI] [PMC free article] [PubMed] [Google Scholar]
- 8.Glenney J R. FEBS Lett. 1992;314:45–48. doi: 10.1016/0014-5793(92)81458-x. [DOI] [PubMed] [Google Scholar]
- 9.Rothberg K G, Heuser J E, Donzell W C, Ying Y, Glenney J R, Anderson R G W. Cell. 1992;68:673–682. doi: 10.1016/0092-8674(92)90143-z. [DOI] [PubMed] [Google Scholar]
- 10.Kurzchalia T, Dupree P, Parton R G, Kellner R, Virta H, Lehnert M, Simons K. J Cell Biol. 1992;118:1003–1014. doi: 10.1083/jcb.118.5.1003. [DOI] [PMC free article] [PubMed] [Google Scholar]
- 11.Scherer P E, Okamoto T, Chun M, Nishimoto I, Lodish H F, Lisanti M P. Proc Natl Acad Sci USA. 1996;93:131–135. doi: 10.1073/pnas.93.1.131. [DOI] [PMC free article] [PubMed] [Google Scholar]
- 12.Parton R G. Curr Opin Cell Biol. 1996;8:542–548. doi: 10.1016/s0955-0674(96)80033-0. [DOI] [PubMed] [Google Scholar]
- 13.Tang Z-L, Scherer P E, Okamoto T, Song K, Chu C, Kohtz D S, Nishimoto I, Lodish H F, Lisanti M P. J Biol Chem. 1996;271:2255–2261. doi: 10.1074/jbc.271.4.2255. [DOI] [PubMed] [Google Scholar]
- 14.Scherer P E, Lewis R Y, Volonte D, Engelman J A, Galbiati F, Couet J, Kohtz D S, van Donselaar E, Peters P, Lisanti M P. J Biol Chem. 1997;272:29337–29346. doi: 10.1074/jbc.272.46.29337. [DOI] [PubMed] [Google Scholar]
- 15.Song K S, Scherer P E, Tang Z-L, Okamoto T, Li S, Chafel M, Chu C, Kohtz D S, Lisanti M P. J Biol Chem. 1996;271:15160–15165. doi: 10.1074/jbc.271.25.15160. [DOI] [PubMed] [Google Scholar]
- 16.Sargiacomo M, Scherer P E, Tang Z-L, Kubler E, Song K S, Sanders M C, Lisanti M P. Proc Natl Acad Sci USA. 1995;92:9407–9411. doi: 10.1073/pnas.92.20.9407. [DOI] [PMC free article] [PubMed] [Google Scholar]
- 17.Li S, Song K S, Lisanti M P. J Biol Chem. 1996;271:568–573. [PubMed] [Google Scholar]
- 18.Murata M, Peranen J, Schreiner R, Weiland F, Kurzchalia T, Simons K. Proc Natl Acad Sci USA. 1995;92:10339–10343. doi: 10.1073/pnas.92.22.10339. [DOI] [PMC free article] [PubMed] [Google Scholar]
- 19.Fra A M, Masserini M, Palestini P, Sonnino S, Simons K. FEBS Lett. 1995;375:11–14. doi: 10.1016/0014-5793(95)95228-o. [DOI] [PubMed] [Google Scholar]
- 20.Li S, Okamoto T, Chun M, Sargiacomo M, Casanova J E, Hansen S H, Nishimoto I, Lisanti M P. J Biol Chem. 1995;270:15693–15701. doi: 10.1074/jbc.270.26.15693. [DOI] [PubMed] [Google Scholar]
- 21.Song K S, Li S, Okamoto T, Quilliam L, Sargiacomo M, Lisanti M P. J Biol Chem. 1996;271:9690–9697. doi: 10.1074/jbc.271.16.9690. [DOI] [PubMed] [Google Scholar]
- 22.Li S, Couet J, Lisanti M P. J Biol Chem. 1996;271:29182–29190. doi: 10.1074/jbc.271.46.29182. [DOI] [PMC free article] [PubMed] [Google Scholar]
- 23.Shaul P W, Smart E J, Robinson L J, German Z, Yuhanna I S, Ying Y, Anderson R G W, Michel T. J Biol Chem. 1996;271:6518–6522. doi: 10.1074/jbc.271.11.6518. [DOI] [PubMed] [Google Scholar]
- 24.Garcia-Cardena G, Oh P, Liu J, Schnitzer J E, Sessa W C. Proc Natl Acad Sci USA. 1996;93:6448–6453. doi: 10.1073/pnas.93.13.6448. [DOI] [PMC free article] [PubMed] [Google Scholar]
- 25.Crosbie R H, Yamada H, Venzke D P, Lisanti M P, Campbell K P. FEBS Lett. 1998;427:279–282. doi: 10.1016/s0014-5793(98)00442-6. [DOI] [PubMed] [Google Scholar]
- 26.North A J, Galazkiewicz B, Byers T J, Glenney J R, Small J V. J Cell Biol. 1993;120:1159–1167. doi: 10.1083/jcb.120.5.1159. [DOI] [PMC free article] [PubMed] [Google Scholar]
- 27.Bonilla E, Fishbeck K, Schotland D. Am J Pathol. 1981;104:167–173. [PMC free article] [PubMed] [Google Scholar]
- 28.Vaghy P L, Fang J, Wu W, Vaghy L P. FEBS Lett. 1998;431:125–127. doi: 10.1016/s0014-5793(98)00738-8. [DOI] [PubMed] [Google Scholar]
- 29.Repetto S, Bado M, Broda P, Lucania G, Masetti E, Sotgia F, Carbone I, Pavan A, Bonilla E, Cordone G, et al. Biochem Biophys Res Commun. 1999;261:547–550. doi: 10.1006/bbrc.1999.1055. [DOI] [PubMed] [Google Scholar]
- 30.Minetti C, Sotgia F, Bruno C, Scartezzini P, Broda P, Bado M, Masetti E, Mazzocco P, Egeo A, Donati M A, et al. Nat Genet. 1998;18:365–368. doi: 10.1038/ng0498-365. [DOI] [PubMed] [Google Scholar]
- 31.Chang H W, Bock E, Bonilla E. J Biol Chem. 1989;264:20831–20834. [PubMed] [Google Scholar]
- 32.Niwa H, Yamamura K, Miyazaki J. Gene. 1991;108:193–199. doi: 10.1016/0378-1119(91)90434-d. [DOI] [PubMed] [Google Scholar]
- 33.Scherer P E, Lisanti M P, Baldini G, Sargiacomo M, Corley-Mastick C, Lodish H F. J Cell Biol. 1994;127:1233–1243. doi: 10.1083/jcb.127.5.1233. [DOI] [PMC free article] [PubMed] [Google Scholar]
- 34.Engelman J A, Zhang X L, Galbiati F, Lisanti M P. FEBS Lett. 1998;429:330–336. doi: 10.1016/s0014-5793(98)00619-x. [DOI] [PubMed] [Google Scholar]
- 35.Mikel U V. Advanced Laboratory Methods in Histology and Pathology. Washington, DC: Armed Forced Institute of Pathology/American Registry of Pathology; 1994. [Google Scholar]
- 36.Pardue M L. Nucleic Acid Hybridization: A Pratical Approach. Oxford: IRL; 1995. [Google Scholar]
- 37.Sargiacomo M, Sudol M, Tang Z-L, Lisanti M P. J Cell Biol. 1993;122:789–807. doi: 10.1083/jcb.122.4.789. [DOI] [PMC free article] [PubMed] [Google Scholar]
- 38.Lisanti M P, Scherer P E, Vidugiriene J, Tang Z-L, Hermanoski-Vosatka A, Tu Y-H, Cook R F, Sargiacomo M. J Cell Biol. 1994;126:111–126. doi: 10.1083/jcb.126.1.111. [DOI] [PMC free article] [PubMed] [Google Scholar]
- 39.Engelman J A, Wycoff C C, Yasuhara S, Song K S, Okamoto T, Lisanti M P. J Biol Chem. 1997;272:16374–16381. doi: 10.1074/jbc.272.26.16374. [DOI] [PubMed] [Google Scholar]
- 40.Koleske A J, Baltimore D, Lisanti M P. Proc Natl Acad Sci USA. 1995;92:1381–1385. doi: 10.1073/pnas.92.5.1381. [DOI] [PMC free article] [PubMed] [Google Scholar]
- 41.Li S, Galbiati F, Volonte D, Sargiacomo M, Engelman J A, Das K, Scherer P E, Lisanti M P. FEBS Lett. 1998;434:127–134. doi: 10.1016/s0014-5793(98)00945-4. [DOI] [PubMed] [Google Scholar]
- 42.McNally E M, de Sá Moreira E, Duggan D J, Bönnemann C G, Lisanti M P, Lidov H G W, Vainzof M, Passos-Bueno M R, Hoffman E P, Zatz M, Kunkel L M. Hum Mol Gen. 1998;7:871–877. doi: 10.1093/hmg/7.5.871. [DOI] [PubMed] [Google Scholar]
- 43.Sewry C A, Wilson L A, Dux L, Dubowitz V, Cooper B J. Neuromuscular Disord. 1992;2:331–342. doi: 10.1016/s0960-8966(06)80004-0. [DOI] [PubMed] [Google Scholar]
- 44.Minetti C, Tanji K, Gasparo-Rippa P, Morreale G, Cordone G, Bonilla E. Neurology. 1994;6:1149–1152. doi: 10.1212/wnl.44.6.1149. [DOI] [PubMed] [Google Scholar]
- 45.Costa A C, Walsh K, Davisson M T. Physiol Behav. 1999;68:211–220. doi: 10.1016/s0031-9384(99)00178-x. [DOI] [PubMed] [Google Scholar]
- 46.Barlow C, Hirotsune S, Paylor R, Liyanage M, Eckhaus M, Collins F, Shiloh Y, Crawley J N, Ried T, Tagle D, Wynshaw-Boris A. Cell. 1996;86:159–171. doi: 10.1016/s0092-8674(00)80086-0. [DOI] [PubMed] [Google Scholar]
- 47.Bulfield G, Siller W G, Wight P A L, Moore K J. Proc Natl Acad Sci USA. 1984;81:1189–1192. doi: 10.1073/pnas.81.4.1189. [DOI] [PMC free article] [PubMed] [Google Scholar]
- 48.Ohlendieck K, Campbell K P. J Cell Biol. 1991;115:1685–1694. doi: 10.1083/jcb.115.6.1685. [DOI] [PMC free article] [PubMed] [Google Scholar]
- 49.Sicinski P, Geng Y, Ryder-Cook A S, Barnard E A, Darlison M G, Barnard P J. Science. 1989;244:1578–1580. doi: 10.1126/science.2662404. [DOI] [PubMed] [Google Scholar]


