Abstract
How well does the functional MRI (fMRI) signal reflect underlying electrophysiology? Despite the ubiquity of the technique, this question has yet to be adequately answered. Therefore, we have compared cortical maps generated based on the indirect blood oxygenation level-dependent signal of fMRI with maps from microelectrode recording techniques, which directly measure neural activity. Identical somatosensory stimuli were used in both sets of experiments in the same anesthetized macaque monkeys. Our results demonstrate that fMRI can be used to determine the topographic organization of cortical fields with 55% concordance to electrophysiological maps. The variance in the location of fMRI activation was greatest in the plane perpendicular to local vessels. An appreciation of the limitations of fMRI improves our ability to use it effectively to study cortical organization.
Until recently, noninvasive techniques used to image the human brain and its activity were not widely accessible. However, in the past few years, procedures such as functional MRI (fMRI) have become readily available and are used in a wide range of disciplines including Radiology, Psychology, Psychiatry, Neurology, Neurosurgery, and Neuroscience. The investigations undertaken by different groups are diverse and range in scope from understanding complex perceptual and cognitive processes to examining the activity patterns generated from simple sensory stimuli. However, a basic question that has yet to be addressed is: how accurately do changes in the vascular system reflect changes in neural activity (1)?
Despite the ubiquity of the technique and the number of inferences that have been made based on its use, there have been few studies that focus on the relationship between the blood oxygenation level-dependent (BOLD; ref. 2) signal of fMRI and the underlying neural activity that it is assumed to reflect. Typically, fMRI is based on the hemodynamic response to evoked neural activity. The BOLD signal is derived from the oxygenation state of local hemoglobin. Neural activity requires oxygen, which triggers an increase in local oxy-hemoglobin, resulting in an increase in signal intensity in an active region of cortex (3). Thus, the BOLD signal is an indirect indicator of neural activity with unknown accuracy.
Appreciating the link between fMRI and neurophysiology is important not only for the use and interpretation of fMRI, but also when comparing data from humans with the wealth of data gathered using invasive techniques in monkey cortex. The macaque monkey is the most widely studied animal model for human neocortical organization and function. The ability to compare human data directly with an animal model will allow us to extend our understanding of complex human behavior based on detailed neurophysiological and neuroanatomical data from the macaque monkey.
We have, therefore, developed a monkey model appropriate for the study of the relationship between the fMRI BOLD signal and the underlying neural activity. We have examined the BOLD response and the underlying neurophysiology in the same macaque monkeys. While we and others have documented the technical feasibility of performing fMRI in monkeys (4–7), the present study is a comparison of cortical maps generated using both fMRI and electrophysiological methods in the same animals under identical stimulus conditions.
As a first step, we used fMRI in the anesthetized macaque monkey to map the somatosensory areas located in anterior parietal cortex (4). This region includes the primary somatosensory area (SI or 3b) and areas 3a, 1 and 2. We used a simple calibrated reproducible tactile stimulus applied to the hand or the lips and tongue (Fig. 1). Stimuli of 25 psi (1 psi = 6.89 kPa) were delivered at 2 Hz with a somatosensory stimulus generator (BTi, San Diego, CA) by means of four stimulus channels that ended in a plastic bladder clip with a 1-cm diameter.
Figure 1.
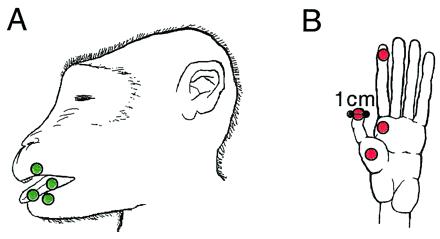
Somatosensory stimuli. For stimulation of the face, plastic diaphragms (1 cm in diameter) were placed on the upper lip, lower lip, and tongue of each of the two monkeys (A). A stimulus of 25 psi was delivered at 2 Hz by means of air-filled tubes that ran from a pneumatic stimulus generator (BTi) to the diaphragms. For stimulation of the hand, the diaphragms were attached to distal D1 and D2, and to P1 and P2 of the left hand (B). The placement of the diaphragms as well as the parameters of the stimulus were identical for the fMRI and electrophysiological mapping experiments.
As predicted from microelectrode recording studies of anterior parietal cortex in human and nonhuman primates (8–14), the representation of the hand was medial and superior to that of the face. This observation has also been made in positron-emission tomography (PET) (15) and fMRI (16–18, 4) studies of human somatosensory cortical organization (Fig. 2). Thus, it is possible to use fMRI to determine the gross mediolateral organization of body part representations in anterior parietal cortex of monkeys and relate these results to patterns observed in humans. Although we have used a relatively simple example to demonstrate the link between the monkey model and human data, this work may be of greatest utility in furthering our understanding of more complex cortical functions.
Figure 2.
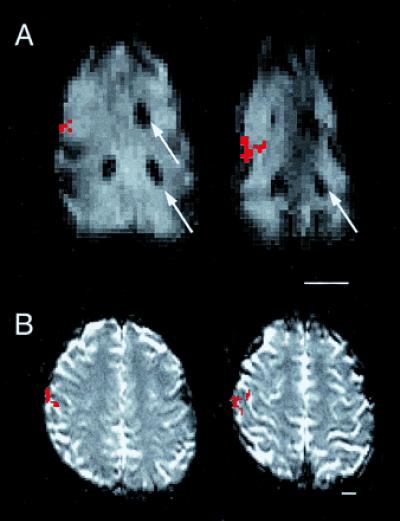
Activity generated in anterior parietal cortex of the anesthetized macaque monkey (A) and the awake human (B) using the same stimulus to stimulate cutaneous receptors on the entire glabrous hand of each species. In both A and B, serial axial EPI MR images are displayed, with the most inferior section on the left and rostral to the top. Active voxels are indicated in red. (A) The activity generated from the applied stimulus was easily related to the gadolinium filled probes (arrows) placed before the commencement of fMRI mapping experiments (see Materials and Methods). The relative location of activation with respect to major sulcal landmarks and activations generated from face stimulation (not shown) is the same in both the anesthetized monkey and the awake human. (Scale bars equal 1.5 cm.)
Materials and Methods
Two macaque monkeys (Macaca mulatta) weighing 10–12 kg were used in both imaging and electrophysiological experiments. Before fMRI mapping, reference probes were placed in the cerebral cortex rostral and caudal to the postcentral gyrus of each monkey to facilitate alignment of the two data sets (Fig. 2). These probes were plastic tubes (1 cm length and 1 mm diameter) filled with a dilute solution of the magnetic contrast agent gadolinium (gadopentetate dimeglumine, Magnevist; Berlex Laboratories, Cedar Knolls, NJ). For probe implantation, monkeys were anesthetized initially with ketamine hydrochloride (10 mg/kg i.m.), and anesthesia was maintained with Isoflurane 1–2%. Respiration rate and body temperature were continuously monitored. Oxygen saturation and heart rate were monitored using an MR compatible pulse oximeter (In Vivo Research, Orlando, FL). The scalp was retracted and the location of the postcentral gyrus was ascertained by the cortical vascular pattern as seen through the skull. Two holes were drilled on either side of the gyrus, the dura was cut, and the probes were placed. The holes were covered with gelfoam and sealed with acrylic, the scalp was sutured, and the animal was allowed to recover. In one animal, probes were placed in both hemispheres. All experimental protocols conformed to National Institutes of Health guidelines and were approved by the Animal Use and Care Administrative Advisory Committee of the University of California, Davis, and the Committee on Animal Research at University of California, San Francisco.
At the beginning of the fMRI experiments, anesthesia was induced with ketamine hydrochloride (10 mg/kg, i.m.) and maintained with 1–1.5% isoflurane by mask. Vital signs were monitored as in the probe placement procedure. Once anesthetized, the animals were intubated, cannulated, and infused with a continuous drip of lactated ringers (10 ml/kg/h). An arterial line was placed to monitor blood gas levels. Animals were paralyzed with Pancuronium (0.1 mg/kg, i.v.) and artificially ventilated. Paralysis was monitored using a train of four electrical pulses delivered with a peripheral nerve stimulator (Digistim II; Neurotechnology, Houston TX) to the right wrist of each monkey. Once preparation was complete, the level of Isoflurane was dropped to 0.5–0.8% and remained constant for at least 15 min before scanning commenced (see below). After scanning was complete, paralysis was reversed with Edrophonium (0.5 mg/kg, i.v.) and Atropine (0.1 mg/kg, i.v.), and the animal was allowed to recover and was returned to its home cage.
Two factors were important for successful acquisition of cortical maps using fMRI in the anesthetized preparation. First, normal blood gas levels were maintained by means of artificial respiration, with the rate based on a PaCO2 level between 35 and 45 mmHg and a pH of 7.35–7.45. The second factor was the anesthetic dose. We performed fMRI scans at various doses of anesthesia from 0.8% Isoflurane to a lesser dose of 0.5%. A similar protocol has been used successfully in anesthetized humans to map the cortical response to tactile stimulation using fMRI (Fig. 3, and ref. 19).
Figure 3.
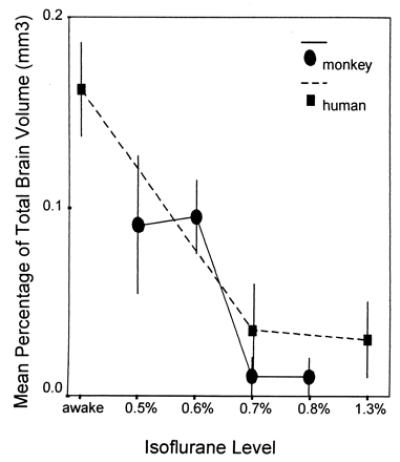
Mean (±SEM) dose-response data for 5 humans (dashed line) and all 28 macaque monkey scans (solid line). General anesthesia reduces the cortical area of activation in response to a somatosensory stimulus. In both species, the mean area of activation, as measured against total brain volume, falls off as Isoflurane levels reach 0.7%. Because there were no statistically significant differences in dose-response, the data from both monkeys were combined. fMRI data from the human are adapted from Antognini et al. (19). Total brain volume data for the monkey and human were taken from Stephan et al. (29).
For data acquisition, a clinical GE Signa 1.5 Tesla scanner (version 5.6) with a standard GE birdcage whole head coil was used with a gradient echo Echo Planar Imaging sequence. Axial multislice gradient-recalled echo planar images were acquired with the following parameters: TR = 2 s, 70 phases, TE = 69, flip angle = 60°, slice thickness = 4 mm with 0.5-mm gap, fov = 40 × 20 cm with a 256 × 128 matrix. Tactile stimuli were presented to the hand or face in the commonly used alternating boxcar “block” design with 20-s intervals of stimulation vs. rest (Fig. 1). During an individual scan, either the face (9 scans) or the hand (19 scans) was stimulated. A total of 28 scans were obtained from 14 separate scanning sessions. The first monkey was scanned 18 times (14 scans of the hand representation and 4 scans of the face representation), whereas the second monkey was scanned 10 times (5 scans of the hand representation and 5 scans of the face representation).
Data were analyzed by correlating the time series signal intensity data from each voxel to a boxcar stimulus reference function (20). To define active voxels, a threshold of r = 0.30 was used with a cluster requirement of at least two contiguous voxels. Using a higher or lower threshold resulted in a slightly smaller or larger cluster of active voxels, respectively, but did not change the location of the center of the volume of activation. For each scan, the location of the centroid was calculated for the three-dimensional volume of active voxels (21). Locations of the centroid of activation were normalized based on the centroid of the entire head. A concordance rate between the fMRI and electrophysiologically defined maps was calculated. The maps were considered concordant if the centroid of the fMRI volume of activation fell within the electrophysiologically defined map.
After cortical mapping using fMRI, the somatosensory cortex was mapped using microelectrode recording techniques. The anesthetic and surgical preparations were identical to those described above for fMRI experiments, with the following exceptions. It was necessary that Isoflurane levels remained at surgical levels (1–2%) throughout the electrophysiological recording procedures. Also, animals were ventilated but not paralyzed. Once the monkeys were anesthetized, the neocortex was exposed using standard procedures. The skin was cut, the temporal muscle retracted, and the skull over the central sulcus, precentral, and postcentral gyri was removed, and the dura was retracted. An acrylic well was built around the opening and filled with dimethylpolysiloxane to maintain cortical temperature and prevent desiccation. A digital image (Optronics Engineering; Zeiss) was taken of the cortex. The central sulcus, the lateral sulcus, the surrounding vasculature, and the previously implanted probes were clearly visible in the image.
Coated tungsten electrodes (5 MΩ) designed to record from neural clusters were advanced into the cortex with a stepping hydraulic microdrive, and recordings were obtained every 500 μm. At most sites, the electrodes were advanced into the caudal or rostral bank of the central sulcus and ran approximately parallel to layer IV. The entrance point of electrode penetrations was marked relative to cortical vasculature on the digital image of the brain (see Fig. 5).
Figure 5.
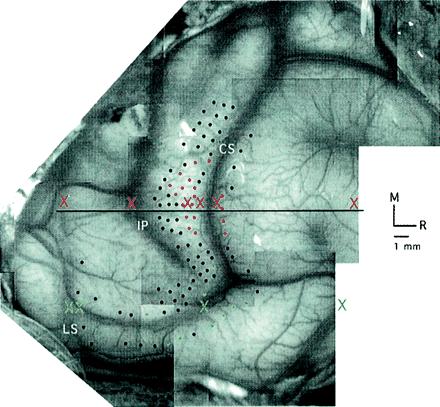
Variability in fMRI centroid location. A digital image of the macaque monkey neocortex is used to illustrate the anterior–posterior (A-P) locations of the centroids of fMRI activation, indicated by X's in red for the fMRI hand representation and green for the fMRI face representation. Notice that the A-P centroid locations correspond roughly to the locations of surface veins. Data are displayed from Isoflurane 0.5–0.6% in the one monkey pictured. Electrode penetrations are indicated by dots. Red dots mark the penetrations in which neurons were driven by controlled stimulation to the hand and green dots mark the penetrations in which neurons were driven by controlled stimulation to the face. “M” refers to medial and “R” indicates rostral.
Two sets of cortical maps were generated for each monkey. First, complete maps of the hand, face, and forelimb were obtained for areas 3a, 3b, 1 and 2 (Fig. 4, black lines). For this map, the animal's body was stimulated in its entirety using fine probes, brushes, pressure, and muscle displacement at each recording site. A second map was then obtained that corresponded to the maps generated using fMRI. For this map, stimuli were identical to those used in the fMRI experiments. If the receptive fields (from map 1) were on any part of the hand or face, the four diaphragms of the stimulator were placed on the body part of interest, and the stimulus, identical to that used in the fMRI experiments, was delivered. Thus, map 2 contained the regions within map 1 that were driven with our controlled stimulus (Fig. 4, solid colors). This second map, derived from identical stimuli used in the fMRI experiments, was used for comparison and data analysis.
Figure 4.
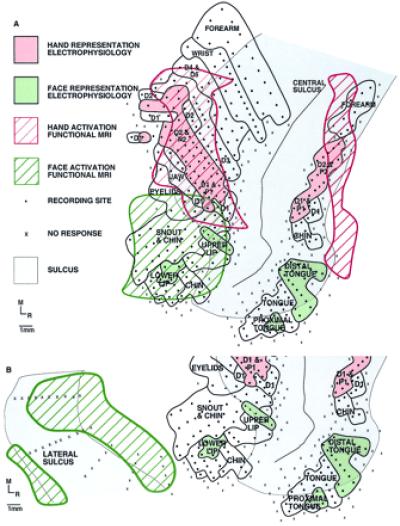
An illustration depicting the correspondence between fMRI activation and electrophysiological maps generated using the identical stimulus (see Fig. 1) in the same monkey. Both maps are shown on a flattened cortex. For the fMRI map, active voxels were located on the lip of the central sulcus, yielding what appears to be two areas of activation on the anterior and posterior bank of the central sulcus. (A) The correspondence between the fMRI signal and the underlying electrophysiology is good. The most notable difference between the maps generated using the two techniques is that the extent of activation is greater using the fMRI method. As shown in B, the maps generated using the two techniques did not always correspond. In the same animal, using the same stimulus, the activation generated for stimulation of the face was, in this case, over 1 cm away from the actual map of the face demonstrated electrophysiologically. (A and B) Dots represent electrode penetrations locations in which neurons responded to somatic stimulation, X's mark electrode penetrations in which no neural response was elicited, and solid black lines denote body part representations within anterior parietal areas.
To aid in data reconstruction, some of the electrode tracks were coated with fluorescent tracers. At the termination of the experiment, the animals were euthanized and the brains were fixed following a standard protocol. The animals were euthanized and perfused transcardially with 0.9% saline, followed by 4% paraformaldehyde in phosphate buffer, and then 4% paraformaldehyde in 10% sucrose phosphate buffer. The brain was then removed from the cranium, photographed, and left to soak in 4% paraformaldehyde and 30% sucrose phosphate buffer for 24 h. The brains were subsequently frozen, cut in a horizontal (axial) plane on a freezing microtome into 80-μm sections, and stained for cytochrome oxidase, Nissl and myelin, and processed for fluorescent microscopy.
Locations and angle of electrode penetrations were recovered from the fluorescent sections. These sections were plotted on an X-Y stage encoder attached to a fluorescent microscope and a personal computer equipped with mdplot optical plotting software (Minnesota Datametrics, St. Paul, MN). fMRI data were then superimposed. The two data sets were aligned based on the locations of the GdDTPA-filled probes and anatomic landmarks, such as the location of the ventricles and corpus callosum, sulcal patterns, and gray and white matter boundaries. Data were then projected to the surface of the cortex, and the cortex was “flattened” (22).
Results
This study yielded several interesting findings. First, the overall concordance rate between the fMRI and electrophysiologically defined maps was 55%. In concordant maps, the centroids of fMRI activation were located within the respective hand and face representations obtained using microelectrode recording techniques (Fig. 4A). However, in 45% of the cases, the centroid of the fMRI map fell outside the electrophysiologically defined maps. In these unmatched cases, the mean distance between map centers (fMRI-electrophysiology) was on the order of 1 cm in the anterior–posterior plane (Table 1). Fig. 4B is an example of an fMRI map of the face that was 1 cm caudal to the electrophysiologically defined face representation. The variability of the location of the centroid of activation was not the same in all dimensions (Table 1, and Fig. 5). The superior–inferior direction has the poorest digital resolution (slice thickness ≈4mm). However, the greatest variability in centroid location was observed in the anterior–posterior plane (mean of 8.3 mm for all mismatched cases), which is perpendicular to the major blood vessels that supply the regions of interest (ROI). The digital resolution in the medial–lateral and superior–inferior planes (1.5 mm) was closer to physiologic resolution (mean distance 1.7 and 1.8 mm, respectively, for all mismatched cases).
Table 1.
Distance between fMRI and electrophysiological maps
| A-P (mm) | M-L (mm) | S-I (mm) | |
|---|---|---|---|
| Total | |||
| Hand | 4.25 (3.4) | 3.0 (2.7) | 2.1 (2.3) |
| Face | 4.8 (6.0) | 1.5 (2.9) | 0.2 (2.1) |
| Mismatched | |||
| Hand | 7.2 (3.1) | 1.4 (1.3) | 3.4 (2.6) |
| Face | 9.5 (4.2) | 2.0 (0.7) | 0.3 (0.3) |
The center of volume was calculated for both the fMRI and electrophysiologically defined maps. Values are the mean distance (±SD) between the fMRI centroids and the respective electrophysiological map center. “Total” indicates the mean distance from all scans (Isoflurane 0.5–0.6% for both monkeys). These values indicate the size of the average discrepancy between maps for fMRI (at 1.5 T) as it is currently implemented. In 45% of these scans, the centroid of fMRI activation was outside the electrophysiologically defined map. “Mismatched” indicates the mean distance (±SD) between the centers of the two maps for cases in which the centroid of fMRI activation was located outside the electrophysiologically defined map (Isoflurane 0.5–0.6% for both monkeys). Notice that the plane of lowest digital resolution (S-I, 4 mm digital resolution) is not the plane of lowest physiologic resolution (A-P, 1.5 mm digital resolution). “A-P” refers to the anterior–posterior plane, “M-L” to the medial–lateral plane, and “S-I” to the superior–inferior plane.
Second, the fMRI-defined cortical maps were larger than the maps based on microelectrode recordings (Fig. 4A). For the lower levels of Isoflurane (0.5% and 0.6%), the mean volume of the fMRI hand and face maps were 53 (SD = 11) mm3 and 89 (SD = 33) mm3, respectively, whereas the volume of the electrophysiological maps was 50 mm3 for the hand and 38 mm3 for the face. This discrepancy between extent of the BOLD signal and neural activity has been described previously in optical imaging experiments (23). Further, there was an inverse relationship between anesthetic level and volume of fMRI activation. Previous work has been done to characterize the effects of anesthesia on the human BOLD response (19), and we have demonstrated similar dose-response results for the macaque monkey (Fig. 3). Thus, because the extent of the fMRI activation decreases with increasing anesthetic level, the size of the fMRI map and thus the discrepancy in the size between the fMRI and electrophysiological maps may be reduced in our anesthetized monkey preparation.
Finally, the dose-response curves indicate that there is a distinct anesthetic window within which the BOLD response can be elicited in both the human (Isoflurane >0.7%; ref. 19) and the macaque monkey (Isoflurane 0.5–0.7%; Fig. 3). Although there is an inverse relationship between anesthetic level and number of activated voxels, the center of activation does not change with the level of anesthetic in humans (19). Further, electrophysiological studies in monkeys indicate that the center of a receptive field of a cortical neuron does not change with anesthetic level (24). Therefore, within the dose range for a given anesthetic, the anesthetized subject is a viable preparation for the use of fMRI.
Discussion
Taken together, the results indicate that fMRI can be used to map the gross topography of the cortex. However, variability is sufficiently large to call into question reliable localization based on a single fMRI measurement. Similar variability has been reported for human fMRI measurements (25–27). Although the “digital” in plane resolution of fMRI is 1–2 mm, our results indicate that physiological resolution, or the accuracy of functional localization, may be decreased by as much as a factor of 10 in the dimension perpendicular to major local vasculature. Because time and financial considerations will necessarily constrain the number of scans performed on any individual, consideration of the vascular pattern in the ROI will allow an investigator to predict the plane of greatest variability and interpret their results accordingly.
The discrepancies between fMRI and electrophysiological methodologies may lie in the fundamental difference in the neurophysiological basis for defining active tissue. The fMRI approach, relying on hemodynamic correlates of electrical activity, is an indirect estimate and is therefore susceptible to localization uncertainty. In fact, the specific anterior–posterior variation observed in the present investigation, which runs in a plane perpendicular to the major local vasculature of the parietal lobe, suggests that large vessel sensitivity may be a contributing factor (Fig. 5).
In performing this study, we have chosen the most commonly used hardware, pulse sequence, experimental design, and analysis techniques, to assess the limitations of fMRI as it is currently implemented. The specifics of different fMRI scan procedures may yield different sensitivity to various levels of the vasculature (from capillaries, through venules, to veins). The use of higher magnetic field strengths (e.g., 4 T) may permit fMRI sensitivity to smaller capillary vessels, rather than the larger, more distant venous structures. However, there is evidence that large vessel artifact may be problematic even at higher field strengths (28). These technological advances will allow for the measurement of the initial negative BOLD signal, which has been shown to be a more reliable means of measuring neural activity (23, 28). However, at this time, high field MRI systems (>2 T) are rare and are not approved for clinical use.
We also used the conventional gradient-recalled variation of the echo planar imaging sequence (GR-EPI) for detection of the BOLD response. In general, this choice was motivated by its wide use and by the improved sensitivity of GR-EPI to small signal changes associated with cortical activation. This sequence has the drawback of considerable sensitivity to venous as well as capillary contributions; alternatives based on spin-echo and asymmetric spin-echo have been proposed to mitigate this shortcoming for human investigations. However, these pulse sequences tend to compromise overall sensitivity.
Although we have shown that the physiological resolution of fMRI is inferior to the digital resolution, or the resolution based on the image matrix, understanding the limitations of the method increases our ability to use it effectively for the study of cortical function. Given the current state of the art (i.e., a 1.5-T magnet), there are several tactics for combating the inherent limitations. Increasing study sample size is the most straightforward way to improve statistical power. Further, the hypotheses to be tested should be chosen with care, given the decreased physiologic resolution of fMRI. For example, using calibrated, reproducible stimuli will reduce additional variability. Combining fMRI with a high resolution MR venogram may assist in data interpretation. The noninvasive nature of this new technique and the advantages it provides in both the clinical and research arena outweigh the problems associated with it. However, the wealth of inferences regarding human cortical organization and function that have been made based on fMRI data make it imperative to appreciate the relationship between the BOLD signal and the underlying electrophysiology.
Acknowledgments
We thank Dan Vigneron for helpful discussion regarding these fMRI experiments and Joseph Antognini for advice about anesthesia. For comments on this manuscript, we thank Kelly Huffman, Ted Jones, Jon Kaas, Tuong Le, and Bruno Olshausen. Niles Bruce and Evelyn Proctor provided technical assistance for fMRI experiments, Paul Ferrari assisted with animal preparation for scanning, and Monica Greene assisted with histological processing of tissue. This work was supported by a National Institutes of Health Grant (RO1 NS35103-02A1) and a Whitehall Foundation Grant (M20-97) (to L.K.); a James S. McDonnell Foundation grant (to L.K. and E.D.); and a UCSF Radiology Pilot Research program award (to T.R. and E.D).
Abbreviations
- fMRI
functional MRI
- BOLD
blood oxygenation level-dependent
- PET
positron-emission tomography
- ROI
regions of interest
Footnotes
This paper was submitted directly (Track II) to the PNAS office.
Article published online before print: Proc. Natl. Acad. Sci. USA, 10.1073/pnas.170205497.
Article and publication date are at www.pnas.org/cgi/doi/10.1073/pnas.170205497
References
- 1.Woolsey T A, Rovainen C M, Wei L, Henegar M M, Liang G, Liu D, Moskalenko Y E. In: Brain Mapping, the Methods. Toga A W, Massiotta J C, editors. Toronto: Academic; 1996. pp. 99–113. [Google Scholar]
- 2.Ogawa S, Lee T M, Kay A R, Tank D W. Proc Natl Acad Sci USA. 1990;87:9868–9872. doi: 10.1073/pnas.87.24.9868. [DOI] [PMC free article] [PubMed] [Google Scholar]
- 3.Fox P T, Raichle M E. Proc Natl Acad Sci USA. 1986;83:1140–1144. doi: 10.1073/pnas.83.4.1140. [DOI] [PMC free article] [PubMed] [Google Scholar]
- 4.Disbrow E A, Roberts T P L, Slutsky D, Krubitzer L A. Brain Res. 1999;829:167–173. doi: 10.1016/s0006-8993(99)01297-4. [DOI] [PubMed] [Google Scholar]
- 5.Dubowitz D J, Chen D Y, Atkinson D J, Grieve K L, Gillikin B, Bradley W G, Jr, Andersen R A. NeuroReport. 1998;9:2213–2218. doi: 10.1097/00001756-199807130-00012. [DOI] [PubMed] [Google Scholar]
- 6.Stefanacci L, Reber P, Costanza J, Wong E, Buxton R, Zola S, Squire L, Albright T. Neuron. 1998;20:1051–1057. doi: 10.1016/s0896-6273(00)80485-7. [DOI] [PubMed] [Google Scholar]
- 7.Logothetis N K, Guggenberger H, Peled S, Pauls J. Nat Neurosci. 1999;2:555–562. doi: 10.1038/9210. [DOI] [PubMed] [Google Scholar]
- 8.Huffman, K. J. & Krubitzer, L. A. (2000) J. Neurosci., in press.
- 9.Kaas J H, Nelson R J, Sur M, Lin C-S, Merzenich M M. Science. 1979;204:521–523. doi: 10.1126/science.107591. [DOI] [PubMed] [Google Scholar]
- 10.Manger P R, Woods T M, Muñoz A, Jones E G. J Neurosci. 1997;17:6338–6351. doi: 10.1523/JNEUROSCI.17-16-06338.1997. [DOI] [PMC free article] [PubMed] [Google Scholar]
- 11.Merzenich M M, Kaas J H, Sur M, Lin C-S. J Comp Neurol. 1978;181:41–74. doi: 10.1002/cne.901810104. [DOI] [PubMed] [Google Scholar]
- 12.Nelson R J, Sur M, Felleman D, Kaas J H. J Comp Neurol. 1980;192:611–643. doi: 10.1002/cne.901920402. [DOI] [PubMed] [Google Scholar]
- 13.Penfield W, Boldrey E. Brain. 1937;60:389–443. [Google Scholar]
- 14.Pons T P, Garraghty P E, Cusick C G, Kaas J H. J Comp Neurol. 1985;241:445–466. doi: 10.1002/cne.902410405. [DOI] [PubMed] [Google Scholar]
- 15.Fox P T, Burton H, Raichle M E. J Neurosurg. 1987;67:34–43. doi: 10.3171/jns.1987.67.1.0034. [DOI] [PubMed] [Google Scholar]
- 16.Hammeke T A, Yetkin F Z, Mueller W M, Morris G L, Haughton V M, Rao S M, Binder J R. Neurosurgery. 1994;35:677–681. doi: 10.1227/00006123-199410000-00014. [DOI] [PubMed] [Google Scholar]
- 17.Yang T T, Gallen C C, Schwartz B J, Bloom F E. Proc Natl Acad Sci USA. 1993;90:3098–3102. doi: 10.1073/pnas.90.7.3098. [DOI] [PMC free article] [PubMed] [Google Scholar]
- 18.Moore C I, Stern C E, Corkin S, Fischl B, Gray A C, Rosen B R, Dale A M. J Neurophysiol. 2000;84:558–569. doi: 10.1152/jn.2000.84.1.558. [DOI] [PubMed] [Google Scholar]
- 19.Antognini J F, Buonocore M, Disbrow E A, Carstens E. Life Sci. 1997;61:349–354. doi: 10.1016/s0024-3205(97)00960-0. [DOI] [PubMed] [Google Scholar]
- 20.Bandettini P A, Jesmanowicz A, Wong E C, Hyde J S. Magn Reson Med. 1993;30:161–173. doi: 10.1002/mrm.1910300204. [DOI] [PubMed] [Google Scholar]
- 21.Strupp J P. Neuroimage. 1996;3S:607. [Google Scholar]
- 22.Van Essen D C, Maunsell J H R. J Comp Neurol. 1980;191:255–281. doi: 10.1002/cne.901910208. [DOI] [PubMed] [Google Scholar]
- 23.Frostig R D, Lieke E E, Ts'o D Y, Grinvald A. Proc Natl Acad Sci USA. 1990;87:6082–6086. doi: 10.1073/pnas.87.16.6082. [DOI] [PMC free article] [PubMed] [Google Scholar]
- 24.Stryker M P, Jenkins W M, Merzenich M M. J Comp Neurol. 1987;258:297–303. doi: 10.1002/cne.902580209. [DOI] [PubMed] [Google Scholar]
- 25.McGonigle D, Howseman A M, Athwal B S, Friston K J, Frackowiak R S J, Holmes A P. Neuroimage. 2000;11:708–734. doi: 10.1006/nimg.2000.0562. [DOI] [PubMed] [Google Scholar]
- 26.Roberts, T. P. L., Disbrow, E. A., Roberts, H. & Rowley. H. (2000) Am. J. Neuroradiol., in press. [PMC free article] [PubMed]
- 27.Yetkin F, McAuliffe T, Cox R, Haughton V. Am J Neuroradiol. 1996;17:95–98. [PMC free article] [PubMed] [Google Scholar]
- 28.Kim D-S, Duong T, Kim S-G. Nat Neurosci. 2000;3:164–169. doi: 10.1038/72109. [DOI] [PubMed] [Google Scholar]
- 29.Stephan H, Frahm H, Baron G. Folia Primatol (Basel) 1981;35:1–29. doi: 10.1159/000155963. [DOI] [PubMed] [Google Scholar]


