

Abstract
Peptides derived from proteolytic processing of the β-amyloid precursor protein (APP), including the amyloid-β peptide (Aβ), play a critical role in the pathogenesis of Alzheimer's dementia. We report that transgenic mice overexpressing APP and Aβ have a profound attenuation in the increase in neocortical blood flow elicited by somatosensory activation. The impairment is highly correlated with brain Aβ concentration and is reproduced in normal mice by topical neocortical application of exogenous Aβ1–40 but not Aβ1–42. Overexpression of M146L mutant presenilin-1 in APP mice enhances the production of Aβ1–42 severalfold, but it does not produce a commensurate attenuation of the hyperemic response. APP and Aβ overexpression do not diminish the intensity of neural activation, as reflected by the increase in somatosensory cortex glucose usage. Thus, Aβ-induced alterations in functional hyperemia produce a potentially deleterious mismatch between substrate delivery and energy demands imposed by neural activity.
Keywords: Alzheimer's disease, β-amyloid, cerebral blood flow, functional activation
The amyloid precursor protein is closely linked to the pathogenesis of Alzheimer's dementia (AD; refs. 1 and 2). Mutations in all three early onset familial AD genes, the amyloid precursor protein (APP), presenilin-1 (PS1), and 2 (PS2), cause elevation of APP-derived Aβ peptides that accumulate in the brain parenchyma and blood vessels (3–5). These observations, collectively, have led to the hypothesis that Aβ peptides are intimately involved in the pathogenesis of AD. Furthermore, transgenic mice overexpressing APP have increased levels of Aβ in brain, and transgenic lines expressing high levels of mutant APP develop some of the pathological and behavioral hallmarks of AD (6).
The mechanisms by which Aβ contributes to neuronal dysfunction and neurodegeneration in AD have not been elucidated. Although most studies have focused on the effects of Aβ on neurons, recent evidence suggests that Aβ has profound effects on cerebral blood vessels as well (7–10). Patients with AD have morphological alterations of the cerebral vasculature and reduced cerebral blood flow (CBF), and mice overexpressing APP have a marked impairment in the response of cerebral blood vessels to exogenous vasoactive agents (9–12). However, the impact that these cerebrovascular alterations have on the regulation of the cerebral circulation remains to be defined. Neural activity is one of the major factors regulating CBF (13). Thus, CBF is closely matched to the energy requirements of the brain (14–17). If a brain region is activated, blood flow to that region increases to facilitate local delivery of nutrients and to remove metabolic waste (13). Here we report that APP and Aβ overexpression impairs the increase in neocortical CBF produced by physiological activation of the somatosensory pathway and causes a potentially-deleterious mismatch between blood flow and cerebral energy consumption.
Methods
Transgenic Mice.
All transgenic lines used in these studies have been described previously (18–20). Human APP695 variants were expressed under control of hamster prion protein sequences (18). Tg6209 is wild-type APP whereas Tg2123 has the “Swedish” K670N, M671L changes; both of these arrays have a 3′-myc epitope tag. Tg2576 mice express Swedish mutant APP on a mixed C57BL/6J–SJL/J background (18, 19), except for three congenic mice expressing the array on a C3H/HeJ background; there was no obvious influence of genetic background differences on cerebrovascular responses or Aβ concentrations in Tg2576 mice. Transgenic line Tg1 expresses M146L mutant PS1 under the control of the same hamster prion protein cosmid insert used for the APP transgenics (20).
Determination of CBF by Laser–Doppler Flowmetry.
Mice were studied at age 2–3 mo. Techniques used for studying CBF by laser–Doppler flowmetry (CBFLDF) were similar to those previously described (9, 10). Mice were anesthetized with urethane (750 mg/kg; i.p.) and chloralose (50 mg/kg; i.p.). The trachea was intubated, and mice were artificially ventilated with an oxygen–nitrogen mixture. One femoral artery was cannulated for recording of arterial pressure and blood sampling. Rectal temperature was maintained at 37°C by using a thermostatically controlled rectal probe connected to a heating lamp. End-tidal CO2 was monitored by a CO2 analyzer (Capstar-100, CWE, Ardmore, PA; refs. 9 and 10). A small craniotomy (2 × 2 mm) was performed to expose the whisker-barrel area of the somatosensory cortex; the dura was removed, and the site was superfused with Ringer solution (37°C; pH: 7.3–7.4; ref. 10). The laser–Doppler probe (Vasamedic, St. Paul. MN; tip diameter 0.8 mm) was mounted on a micromanipulator (Kopf) and positioned 0.5 mm above the pial surface. The right vibrissae were cut to a length of 5–10 mm and stimulated for 1 min by gently stroking them (3–4 Hz) with a cotton-tipped applicator. The CBFLDF changes produced by vibrissal stimulation in somatosensory cortex were mapped and the probe position resulting in the greatest CBFLDF increase was chosen. Vibrissal stimulation produced increases in CBFLDF that reached a stable plateau. CBFLDF increases, expressed as percentage increase, were computed as the ratio of CBFLDF at the level of the plateau and baseline CBFLDF before vibrissal stimulation (21). Two or three vibrissal stimulation trials, separated by 10-min intervals, were averaged for each experimental condition tested. Zero values for CBFLDF were obtained after the heart was stopped by an overdose of halothane at the end of the experiment. Hypercapnia (pCO2 = 50–60 mmHg) was induced by introducing CO2 in the circuit of the ventilator. At the end of the experiments, brains were removed and frozen in liquid nitrogen for subsequent measurement of Aβ.
In some studies, Aβ1–40, Aβ1–42, or Aβ40–1 (Sigma) was superfused on the cranial window at different concentrations (10 nM–10 μM) in C57BL/6J mice. Peptides were freshly solubilized in DMSO and then diluted in normal Ringer. The final DMSO concentration was <0.2%, which had no effect on cerebrovascular responses (unpublished observations). The vibrissae were stimulated after 40 min of Aβ superfusion.
Autoradiographic Determination of CBF or Cerebral Glucose Usage.
CBF was quantified by the 14C-labeled iodoantipyrine (IAP) technique in awake APP mice [Tg2123 male (M)] (22–24). Under halothane anesthesia, the femoral vessels were cannulated and used for arterial pressure monitoring, tracer infusion, and collection of blood samples. Wounds were treated with a 2% lidocaine ointment and sutured. Mice were allowed to recover from anesthesia for 3–4 h and placed in a loosely fitting restraining cylinder with an anterior opening to expose the face and whiskers. The right vibrissae were stroked for 1 min before IAP infusion. Whisker stimulation continued throughout the infusion period. 14C-labeled iodoantipyrine (American Radiolabeled Chemicals, 13–20 μCi/100 g in 0.1 ml; 1Ci = 37 GBq) was infused i.v. at a constant rate for 45 sec by using an infusion pump (Harvard Apparatus, model 940). Contemporaneously timed arterial samples were collected to determine the arterial concentration time course of the tracer. At the end of the infusion, the mouse was decapitated. The brain was rapidly removed and frozen in isopentane cooled to −30°C. Coronal brain sections (20 μm) were cut on a cryostat (Hacker-Bright, model OTF, Fairfield, NJ), mounted on glass slides and apposed to x-ray film together with calibrated 14C standards) (24). The IAP concentration in blood (nCi/g) was determined on 20 μl of blood aliquots by liquid scintillation counting. Ten days later, the film was developed and the OD of regions of interest was determined bilaterally on four adjacent sections by using a computerized image analyzer (MCID system, Imaging Research, St. Catharines, ON, Canada). OD was transformed in 14C concentration (nCi/g) by using the standards on the film (24). CBFIAP (ml/100 g/min) was calculated using the equation described by Kety with the IAP partition coefficient set at 0.8 (24). Physiological parameters of the mice used in CBFIAP experiments were: mean arterial pressure of APP−, 104 ± 5; APP+, 99 ± 8 mmHg; the pCO2 of APP−, 32.5 ± 1.1; APP+, 31.5 ± 1.3 mmHg; the pO2 of APP−, 94 ± 3; APP+, 104 ± 7 mmHg; the pH of APP−, 7.31 ± 0.01; and APP+, 7.30 ± 0.01.
Cerebral glucose usage (CGU) was determined in awake APP mice (Tg2123 M) by a modification of the 14C-labeled 2-deoxyglucose (2-DG) method of Sokoloff (25, 26), as described previously (21). Mice were surgically prepared as described above for IAP. The right vibrissae were stroked for 1 min before 2-DG injection. Vibrissal stimulation continued throughout the 45 min measurement period. 14C-labeled 2-DG (New England Nuclear; 20 μCi/100 g in 1 ml of 0.9% NaCl) was injected i.p., and ≈60 μl of arterial blood was collected 1, 5, 7, 10, 15, 20, 25, 35, and 45 min later. Techniques for determination of tissue 2-DG concentration by quantitative autoradiography were identical to those described above for IAP. Plasma glucose was measured by using a glucose analyzer (Beckman). CGU (μmol/100 g/min) was calculated from the OD of the regions of interest and the arterial time course of 2-DG using the equation developed by Sokoloff et al. (25). Physiological parameters of the mice used in 2-DG experiments were: APP−: mean arterial pressure: APP−, 122 ± 3; APP+, 120 ± 3 mmHg; the pCO2 of APP−, 34.1 ± 2.0; APP+, 32.7 ± 0.6 mmHg; the pO2 of APP−, 103 ± 2; APP+, 102 ± 3 mmHg; the pH of APP−, 7.35 ± 0.01; APP+, 7.36 ± 0.02; the plasma glucose of APP−, 175 ± 9; and APP+, 161 ± 9 mg/dl.
Determination of Aβ.
Aβ measurement by ELISA has been described in detail previously (27). The right hemispheres from the mice used for CBF studies were sonicated in 70% formic acid (150 mg/ml) and centrifuged at 100,000 × g for 1 h. The formic acid extract was neutralized by a 1:20 dilution into 1 M Tris phosphate buffer (pH 8.0) and assayed by ELISA using BAN50 as capture for human transgene-specific Aβ and detection with BA27 for Aβ40 and BC05 for Aβ42. Femtomoles per milliliter were calculated by comparing the sample absorbance to the absorbance of known concentrations of synthetic Aβ1–40 or Aβ1–42 in identical solution as the samples, and these values were corrected with the wet weight of the original homogenate and are finally expressed as pmol/gram wet weight.
Data Analysis.
Data in text and figures are expressed as means ± SE. Two-group comparisons were analyzed by the two-tailed t test for independent samples. Multiple comparisons were evaluated by the analysis of variance and Tukey's test. Probability values of <0.05 were considered statistically significant.
Results
We studied the increase in somatosensory cortex blood flow produced by activation of the vibrissae in lines of transgenic mice with different concentrations of Aβ in brain. Mice were studied at an age, 2–3 mo, when amyloid deposition is not detectable in brain parenchyma or blood vessels (18, 19). In nontransgenic mice, vibrissal stimulation increased CBFLDF in the somatosensory cortex by 30 ± 1% (P < 0.001; analysis of variance). No differences in the magnitude of the hyperemic response were observed in transgene-negative mice from each of the various lines studied (Tg6209, Tg2123, and Tg2576) (P > 0.05 data not shown). Results from Tg2123 M and female (F) mice are presented separately because the transgene array in this line is located on the X chromosome. Due to random X-inactivation, only one-half the somatic cells in female mice will express the transgene; therefore, males express approximately twice the amount of APP as females. In APP mice, the magnitude of the CBFLDF increase was attenuated up to 60%. To determine whether the attenuation in the CBF response to activation was related to Aβ, Aβ1–40 and Aβ1–42 were measured in the brains of the same mice. The magnitude of the attenuation correlated strongly with the brain concentration of Aβ1–40 and Aβ1–42 (Fig. 1). In contrast to functional activation, the increase in CBFLDF produced by hypercapnia was not affected in APP transgenic mice (Table 1). Thus, the attenuation of the hyperemic response produced by somatosensory activation is closely related to the increase in Aβ concentration in brain.
Figure 1.
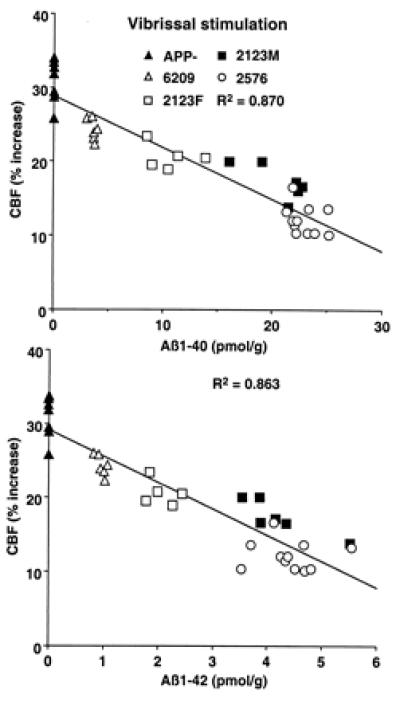
Relationship between Aβ1–40 (A) and Aβ1–42 (B) concentration and the increase in somatosensory CBF produced by whisker stimulation.
Table 1.
Elevation in CBF produced by hypercapnia in APP mice or in C57BL/6J mice with Aβ superfusion
| Mice | Normocapnia
|
Hypercapnia
|
CBF, % increase | n |
|---|---|---|---|---|
| pCO2, mmHg | pCO2, mmHg* | |||
| APP, Tg lines | ||||
| 6209− | 34.0 ± 0.5 | 55.2 ± 1.6 | 68.6 ± 5.2 | 6 |
| 6209+ | 35.3 ± 0.4 | 57.9 ± 0.8 | 69.0 ± 5.6 | 6 |
| 2123F− | 33.0 ± 0.8 | 53.4 ± 0.6 | 68.2 ± 5.1 | 6 |
| 2123F+ | 33.4 ± 0.5 | 55.0 ± 0.5 | 67.3 ± 5.0 | 6 |
| 2123F−/PS1mut+ | 34.2 ± 1.4 | 55.3 ± 0.7 | 69.5 ± 4.1 | 6 |
| 2123F+/PS1mut+ | 35.5 ± 0.8 | 55.2 ± 1.0 | 66.4 ± 3.0 | 6 |
| 2123M− | 35.0 ± 0.2 | 54.0 ± 1.3 | 71.4 ± 4.4 | 6 |
| 2123M+ | 33.2 ± 0.4 | 53.3 ± 1.7 | 68.2 ± 6.8 | 6 |
| C57BL/6J with Aβ superfusion | ||||
| Aβ1-40 | 6 | |||
| Ringer | 34.7 ± 0.4 | 54.5 ± 0.8 | 66.8 ± 1.6 | |
| 5 μM Aβ | 35.7 ± 0.7 | 55.4 ± 0.8 | 77.5 ± 3.2 | |
| Aβ1-42 | 6 | |||
| Ringer | 34.5 ± 0.7 | 54.9 ± 1.2 | 64.4 ± 2.3 | |
| 5 μM Aβ | 35.7 ± 1.0 | 54.9 ± 0.9 | 73.2 ± 2.1 | |
| Aβ40-1 | 6 | |||
| Ringer | 33.1 ± 0.4 | 54.8 ± 0.7 | 63.4 ± 3.6 | |
| 5 μM Aβ | 35.7 ± 0.7 | 55.7 ± 0.6 | 75.0 ± 4.0 |
Mean ± SE, *, P < 0.05 from normocapnia (t test); no differences in mean arterial pressure and pO2, were found between normocapnia and hypercapnia (P < 0.05, ANOVA).
Because CBFLDF provides relative rather than absolute measurements, we also measured CBF by the quantitative IAP technique (CBFIAP). In addition, to rule out confounding effects of anesthesia, IAP experiments were performed on awake mice. In APP+ mice (Tg2123 M), CBFIAP was reduced in the nonactivated somatosensory cortex (−32 ± 6%) and thalamus (−28 ± 7%,), compared to APP− littermates (Fig. 2; P < 0.01). However, in the nonactivated trigeminal nucleus, CBFIAP did not differ between APP− and APP+ mice (Fig. 2; P > 0.05). The increase in CBFIAP produced by vibrissal stimulation in somatosensory cortex was smaller in APP+ mice (17 ± 3%) than in APP− mice (28 ± 3%; P < 0.05 from APP+) (Fig. 2). In thalamus and trigeminal nucleus, however, the CBFIAP increase did not differ between APP+ and APP− mice (Fig. 2; P > 0.05).
Figure 2.
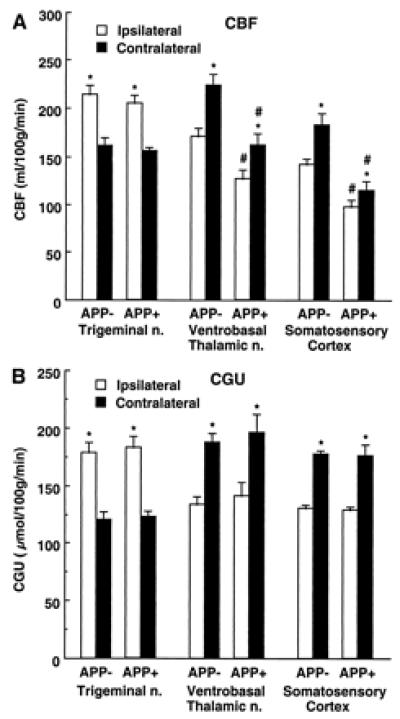
Effect of whisker stimulation on CBF (A) and CGU (B) in somatosensory pathways in APP+ (CBF, n = 5; CGU, n = 6) and APP− (CBF, n = 7; CGU, n = 6) mice (line Tg2123 M). *, P < 0.01 (t test) from contralateral; # P < 0.05 from APP−.
To rule out the possibility that the attenuation in functional hyperemia was a consequence of reduced neural activation, we studied the effects of vibrissal stimulation on CGU in APP mice (Tg2123 M). CGU provides an accurate index of neural activity (28). Resting CGU did not differ between APP+ and APP− littermates in somatosensory areas (P > 0.05; Fig. 2) and in other brain regions as well (P > 0.05; data not shown). Vibrissal stimulation increased CGU in the ipsilateral trigeminal nucleus and in the contralateral thalamus and somatosensory cortex (Fig. 2). The magnitude of the increases in CGU did not differ in APP− and APP+ mice (P > 0.05) (Fig. 2). Therefore, the reduction in the hyperemic response produced by somatosensory activation in APP mice is not associated with an attenuation of the intensity of the neural activity evoked by the stimulation.
To determine whether the impairment in functional hyperemia is related to Aβ1–40 or Aβ1–42, we studied mice overexpressing both APP and mutated presenilin 1 (Tg2123 F × TgPS1mut). Overexpression of PS1mut in APP mice elevates brain levels of Aβ1–42 (20, 29, 30). We reasoned that, if the cerebrovascular dysfunction is mediated by Aβ1–42, then the attenuation of the CBFLDF response to whisker stimulation should be substantially greater in APP+/PS1mut+ mice than in APP+ littermates. As illustrated in Fig. 3, PS1mut overexpression in APP mice (Tg2123 F) increased Aβ1–42 by 236% above that of APP+/PS1mut− mice, whereas Aβ1–40 levels were increased by 70%. However, despite the marked increase in Aβ1–42, the attenuation of the CBFLDF response to whisker stimulation in APP+/PS1mut+ mice was enhanced only by 14% (Fig. 3). Overexpression of PS1mut alone, did not affect cerebrovascular response to vibrissal stimulation (data not shown). As illustrated in Fig. 4, the points representing APP+/PS1mut+ mice fall within or close to the 95% confidence interval of the regression line expressing the relationship between Aβ1–40 and CBFLDF. In contrast, in the regression line expressing the relationship between Aβ1–42 and CBFLDF, the points representing APP+/PS1mut+ mice fall outside the 95% confidence interval (Fig. 4). This analysis suggests that the elevation in Aβ1–42 in APP+/PS1mut+ mice is out of proportion to the magnitude of the attenuation of the CBF response. It is unlikely that the lack of correspondence between Aβ1–42 elevation and attenuation in CBF response is a consequence of the fact that the response is already maximally attenuated. This is because in Tg2123 M the reduction in the CBF response is greater than that observed in APP+/PS1mut+ mice (Fig. 1). PS1mut overexpression in APP mice did not alter the increase in CBFLDF produced by hypercapnia (Table 1).
Figure 3.
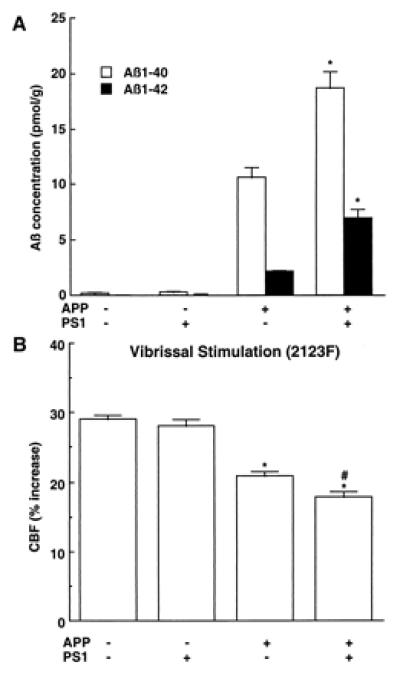
Effect of PS1mut overexpression in APP mice (2123F) on brain concentration of Aβ (A) and on the increase in CBF produced by whisker stimulation (B). (A) *, P < 0.01 from APP+/PS1mut−; n = 6/group. (B) *, P < 0.01 from APP−; # P < 0.01 from APP+ (analysis of variance); n = 6/group.
Figure 4.
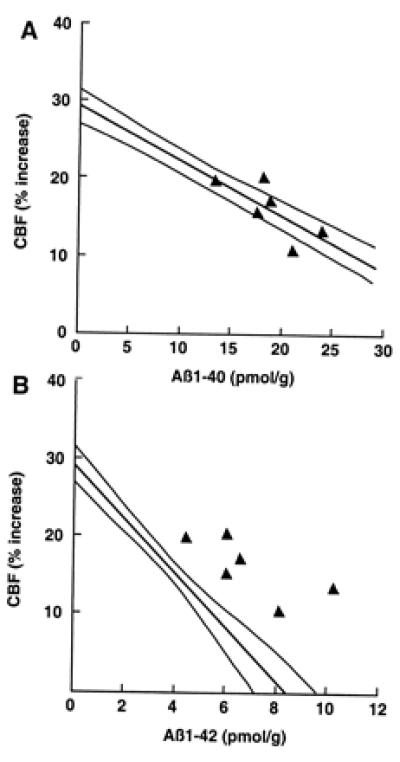
Effect of PS1mut overexpression on the correlation between brain Aβ concentration and attenuation of the increase in CBF produced by somatosensory activation. (A) The attenuation in CBF observed in APP+/PS1mut+ mice was plotted as a function of Aβ1–40 concentration. Notice that the points lie in or near the 95% confidence interval of the regression line obtained in APP mice (see Fig. 1A). (B) The attenuation in CBF observed in APP+/PS1mut+ mice was plotted as a function of Aβ1–42. Notice that the points fall outside the 95% confidence interval of the regression line obtained in APP mice (see Fig. 1B).
The data presented above indicate that Aβ1–40 is largely responsible for the attenuation in functional hyperemia observed in APP mice. To provide additional evidence in support of this hypothesis, we studied the cerebrovascular effects of exogenous Aβ applied topically to the neocortex of normal mice (C57BL/6J). Aβ1–40 produced concentration-dependent attenuations of resting CBF (−28% at 5 μM) and of the increase in CBFLDF produced by whisker stimulation (−42% at 5 μM) (Fig. 5). In contrast, superfusion with the reverse peptide Aβ40–1 or with Aβ1–42 failed to affect resting CBFLDF or the response to whisker activation (Fig. 5). Aβ1–40, 40–1, or 1–42 did not influence the increase in CBF produced by hypercapnia (Table 1). The lack of effectiveness of Aβ1–42 was not related to the fact that the peptide was dissolved in DMSO because Aβ1–42 (5 μM) dissolved in Ringer did not attenuate resting CBF (Ringer: 17.2 ± 1.4; Aβ1–42: 17.1 ± 1.4 perfusion units; P > 0.05) and the increase in CBFLDF produced by somatosensory activation (Ringer: 27 ± 1%; Aβ1–42: 27 ± 1%; P > 0.05). In mice under the same conditions of anesthesia as those used for CBFLDF studies, Aβ1–40 did not attenuate CGU at the site of superfusion (superfusion 48 ± 4 μmol/100 g/min; contralateral: 49 ± 5; n = 5).
Figure 5.
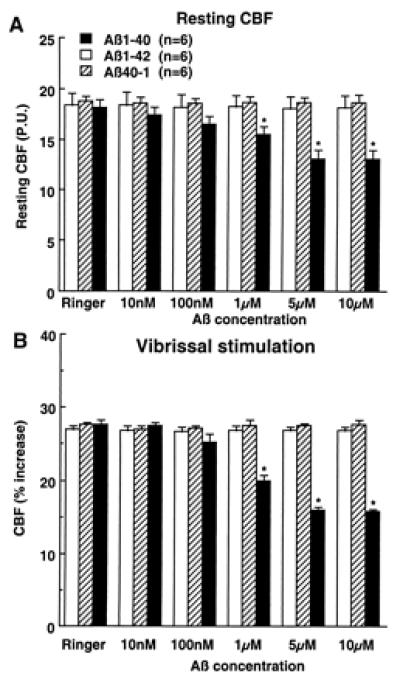
Effect of topical superfusion with Aβ peptides on resting CBF (A) and on the increase in CBF produced by vibrissal stimulation (B). *, P < 0.01 from Ringer, Aβ1–42, and Aβ40–1. P.U., perfusion units.
Discussion
We have demonstrated that mice overexpressing APP exhibit a profound defect in the CBF response to functional activation produced by somatosensory stimuli. The attenuation correlates strongly with the amount of brain Aβ and is not associated with a reduction in the degree of neural activity, as reflected by the increase in glucose usage that accompanies vibrissal stimulation. The attenuation in functional hyperemia could not be attributed to a global reduction in vascular reactivity because the increase in CBF produced by another vasodilating stimulus, hypercapnia, is preserved in APP mice. Furthermore, APP mice were studied at an age in which there is no deposition of Aβ in the brain and blood vessels, or neuronal loss (18, 19). Therefore, it is unlikely that the reduction in the flow response is a consequence of neuronal dysfunction resulting from amyloid plaques or neurodegeneration. These findings provide evidence that APP and Aβ overexpression alter the balance between energy demands and blood supply in the working brain.
We found that CBF in nonactivated areas is reduced in APP mice. This suggests that resting CBF is decreased in APP mice. In the somatosensory regions examined, the reduction in CBF was present in cortex and thalamus but not in the trigeminal nucleus. CGU was similar in APP transgene positive and negative littermates suggesting that the reduction in CBF was not secondary to changes in CGU. These observations, in concert with our finding that topical superfusion of Aβ1–40 reduces local CBF without altering CGU, support the hypothesis that Aβ1–40 has direct vascular effects.
Two lines of evidence suggest that Aβ1–40, rather than Aβ1–42, is responsible for the impairment in functional hyperemia. First, despite a large increase in brain Aβ1–42 in APP+/PS1mut+ mice, the hyperemic response was attenuated only slightly more than that of APP+/PS1mut− mice. This small attenuation could be attributed entirely to the associated increase in Aβ1–40. Second, superfusion with Aβ1–40, but not Aβ1–42, reproduced the impairment in functional hyperemia in normal mice. The reverse peptide Aβ40–1 was devoid of vascular actions, attesting to the specificity of the effect of Aβ1–40. In addition, studies in the isolated rat aorta have demonstrated that Aβ1–40 is more vasoactive than Aβ1–42 (8). The state of aggregation or “aging” of the peptide may influence the biological effects of Aβ1–42 (2, 31, 32). In the present study Aβ1–42 was not allowed to aggregate because it was applied to the brain immediately after being dissolved. Therefore, the possibility that Aβ1–42 in a more advanced state of aggregation influences cerebrovascular reactivity cannot be ruled out. The fact that exogenous Aβ reproduces the attenuation in functional hyperemia induced by APP overexpression indicates that Aβ, and not APP, is responsible for these cerebrovascular alterations.
Transgenic mice overexpressing APP also have alterations in the vasodilatation produced by pharmacological agents applied to cerebral blood vessels (9). Furthermore, Aβ has been reported to alter vascular reactivity in isolated arteries of the rat (7, 8). However, previous studies did not provide any insight into the physiological implications of the vascular alterations. In the present study we found that Aβ, either in the brain of APP mice or topically applied to the neocortex of normal mice, impairs the augmentation of blood flow elicited by increased functional activity, one of the most critical functions of the cerebral circulation.
CBF is tightly coupled to the activity, hence energy demands, of the brain. Thus, in the resting brain, regions with high activity levels, such as vestibular complex and inferior colliculus, have high blood flow rates, whereas regions with low activity, e.g., white matter tracts, have low blood flow (13, 15, 33). Similarly, if the activity of a brain region increases, for example in the parietal cortex during somatosensory stimulation, flow to that region also increases (13, 15, 33). The increase in CBF is thought to enhance the delivery of oxygen and substrates to the active areas, and to facilitate the removal of potentially-harmful byproducts of cerebral metabolism (13, 16). If there is a discrepancy between energy supply and demands, critical cellular functions become impaired and, if the mismatch is persistent or severe, cellular damage occurs (34, 35). In APP mice, the CBF response to somatosensory activation is reduced, whereas the increase in energy demands, as reflected by a rise in somatosensory cortex glucose use, is still present. Therefore, in APP mice there is an imbalance between the delivery of nutrients through blood flow and the energy requirements imposed by the activation. The observation that the activation-induced increase in CGU is not altered in APP mice, suggests that the flow-metabolism mismatch does not impair neural activity. However, it is conceivable that, over a longer period, chronic energy deprivation during activation results in brain dysfunction. Therefore, the results raise the possibility that Aβ, in addition to its well-described neurotoxic effects, contributes to neuronal dysfunction also through its vascular actions. However, it remains to be established whether the vascular effects of Aβ play a role in the behavioral abnormalities that develop in APP mice (18, 19, 36).
Aβ1–40 constitutes the vast majority of total Aβ secreted by cells, whereas Aβ1–42 represents approximately 10% (2). However, Aβ1–42 is more neurotoxic than Aβ1–40 (see ref. 1 for a review). Aβ1–42 is thought to activate a cytotoxic cascade characterized by microglial activation, cytokine production, inflammation and, ultimately, cellular injury (1, 2). The finding that Aβ1–40 is more vasoactive than Aβ1–42 suggests that the mechanisms of the deleterious effects of these peptides might be pathogenically distinct. Whereas Aβ1–42 deposition in brain tissue may initiate the cytotoxic inflammatory cascade associated with AD, Aβ1–40 could exert some of its pathogenic effects by interfering with the blood supply to the brain. An interesting prediction from these studies is that Alzheimer-like pathology arising from Swedish mutant APP or trisomy 21, with elevation of both Aβ1–40 and Aβ1–42, might have more severe cerebrovascular dysfunction than AD resulting from other mutant APPs or mutations in PS1/PS2 that selectively elevate Aβ1–42. Irrespective of the relative roles of Aβ peptides in the mechanisms of AD, the present results provide evidence that the cerebral vascular alterations induced by Aβ alter the fine balance between energy demands, substrate delivery, and waste removal in the active brain. Such alteration, over long periods of time, may contribute to ongoing neuronal dysfunction, even before formation of amyloid plaques and related cytotoxicity.
Acknowledgments
This research was supported by grants from the National Institutes of Health (NS37853 and NS38252 to C.I.; NS33249 to K.H.A.; AG10681 to G.A.C.; and PO1AG1545301A1 to K.H.A., S.Y., and G.A.C.) and the Fraternal Order of Eagles (G.A.C.). C.I. is the recipient of a Javits Award from the National Institutes of Health/National Institute of Neurological Disorders and Stroke.
Abbreviations
- AD
Alzheimer's dementia
- APP
amyloid precursor protein
- Aβ
amyloid-β-peptide
- PS1 and PS2
presenilin-1 and -2
- CBF
cerebral blood flow
- IAP
iodoantipyrine
- LDF
laser–Doppler flowmetry
- CGU
cerebral glucose usage
- 2-DG
2-deoxyglucose
- M
male
- F
female
Footnotes
This paper was submitted directly (Track II) to the PNAS office.
References
- 1.Mattson M P. Physiol Rev. 1997;77:1081–1132. doi: 10.1152/physrev.1997.77.4.1081. [DOI] [PubMed] [Google Scholar]
- 2.Selkoe D J. Nature (London) 1999;399:A23–A31. doi: 10.1038/399a023. [DOI] [PubMed] [Google Scholar]
- 3.Levy-Lahad E, Bird T D. Ann Neurol. 1996;40:829–840. doi: 10.1002/ana.410400604. [DOI] [PubMed] [Google Scholar]
- 4.Dickson D W. J Neuropathol Exp Neurol. 1997;56:321–339. doi: 10.1097/00005072-199704000-00001. [DOI] [PubMed] [Google Scholar]
- 5.Vinters H V, Wang Z Z, Secor D L. Brain Pathol. 1996;6:179–195. doi: 10.1111/j.1750-3639.1996.tb00799.x. [DOI] [PubMed] [Google Scholar]
- 6.Price D L, Sisodia S S. Annu Rev Neurosci. 1998;21:479–505. doi: 10.1146/annurev.neuro.21.1.479. [DOI] [PubMed] [Google Scholar]
- 7.Thomas T, Thomas G, McLendon C, Sutton T, Mullan M. Nature (London) 1996;380:168–171. doi: 10.1038/380168a0. [DOI] [PubMed] [Google Scholar]
- 8.Crawford F, Suo Z, Fang C, Mullan M. Exp Neurol. 1998;150:159–168. doi: 10.1006/exnr.1997.6743. [DOI] [PubMed] [Google Scholar]
- 9.Iadecola C, Zhang F, Niwa K, Eckman C, Turner S K, Fischer E, Younkin S, Borchelt D R, Hsiao K K, Carlson G A. Nat Neurosci. 1999;2:157–161. doi: 10.1038/5715. [DOI] [PubMed] [Google Scholar]
- 10.Zhang F, Eckman C, Younkin S, Hsiao K K, Iadecola C. J Neurosci. 1997;17:7655–7661. doi: 10.1523/JNEUROSCI.17-20-07655.1997. [DOI] [PMC free article] [PubMed] [Google Scholar]
- 11.Kalaria R N. Pharmacol Ther. 1996;72:193–214. doi: 10.1016/s0163-7258(96)00116-7. [DOI] [PubMed] [Google Scholar]
- 12.Friedland R P. In: Aging of the Brain: Cellular and Molecular Aspects of Brain Aging and Alzheimer's Disease. Nagatsu T, Hayashi O, editors. Tokyo: Karger; 1990. pp. 147–159. [Google Scholar]
- 13.Edvinsson L, MacKenzie E T, McCulloch J. Cerebral Blood Flow and Metabolism. New York: Raven; 1993. pp. 92–110. [Google Scholar]
- 14.Iadecola C. Trends Neurosci. 1993;16:206–214. doi: 10.1016/0166-2236(93)90156-g. [DOI] [PubMed] [Google Scholar]
- 15.Sokoloff L. In: Basic Neurochemistry. Segal G, Agranoff B, Albers R W, Molinoff P, editors. New York: Raven; 1989. pp. 565–590. [Google Scholar]
- 16.Woolsey T A, Rovainen C M, Cox S B, Henegar M H, Liang G E, Liu D, Moskalenko Y E, Sui J, Wei L. Cereb Cortex. 1996;6:647–660. doi: 10.1093/cercor/6.5.647. [DOI] [PubMed] [Google Scholar]
- 17.Faraci F M, Heistad D D. Physiol Rev. 1998;78:53–97. doi: 10.1152/physrev.1998.78.1.53. [DOI] [PubMed] [Google Scholar]
- 18.Hsiao K K, Borchelt D R, Olson K, Johannsdottir R, Kitt C, Yunis W, Xu S, Eckman C, Younkin S, Price D, et al. Neuron. 1995;15:1203–1218. doi: 10.1016/0896-6273(95)90107-8. [DOI] [PubMed] [Google Scholar]
- 19.Hsiao K, Chapman P, Nilsen S, Eckman C, Harigaya Y, Younkin S, Yang F, Cole G. Science. 1996;274:99–102. doi: 10.1126/science.274.5284.99. [DOI] [PubMed] [Google Scholar]
- 20.Citron M, Westaway D, Xia W, Carlson G, Diehl T, Levesque G, Johnson W K, Lee M, Seubert P, Davis A, et al. Nat Med. 1997;3:67–72. doi: 10.1038/nm0197-67. [DOI] [PubMed] [Google Scholar]
- 21.Niwa K, Araki E, Morham S G, Ross M E, Iadecola C. J Neurosci. 2000;20:763–770. doi: 10.1523/JNEUROSCI.20-02-00763.2000. [DOI] [PMC free article] [PubMed] [Google Scholar]
- 22.Sakurada O, Kennedy C, Jehle J, Brown J, Carbin G, Sokoloff L. Am J Physiol. 1978;234:H59–H66. doi: 10.1152/ajpheart.1978.234.1.H59. [DOI] [PubMed] [Google Scholar]
- 23.Jay T M, Lucignani G, Crane A M, Jehle J, Sokoloff L. J Cereb Blood Flow Metab. 1988;8:121–129. doi: 10.1038/jcbfm.1988.16. [DOI] [PubMed] [Google Scholar]
- 24.Iadecola C, Xu X. Am J Physiol. 1994;266:R518–R525. doi: 10.1152/ajpregu.1994.266.2.R518. [DOI] [PubMed] [Google Scholar]
- 25.Sokoloff L, Reivich M, Kennedy C, Des Rosiers M, Patlak G, Pettigrew K, Sakurada O, Shinohara M. J Neurochem. 1977;28:897–916. doi: 10.1111/j.1471-4159.1977.tb10649.x. [DOI] [PubMed] [Google Scholar]
- 26.Meibach R C, Glick S D, Ross D A, Cox R D, Maayani S. Brain Res. 1980;195:167–76. doi: 10.1016/0006-8993(80)90874-4. [DOI] [PubMed] [Google Scholar]
- 27.Suzuki N, Cheung T T, Cai X D, Odaka A, Otvos L J, Eckman C, Golde T E, Younkin S G. Science. 1994;264:1336–1340. doi: 10.1126/science.8191290. [DOI] [PubMed] [Google Scholar]
- 28.Yarowsky P, Kadekaro M, Sokoloff L. Proc Natl Acad Sci USA. 1983;80:4179–4183. doi: 10.1073/pnas.80.13.4179. [DOI] [PMC free article] [PubMed] [Google Scholar]
- 29.Duff K, Eckman C, Zehr C, Yu X, Prada C M, Perez-tur J, Hutton M, Buee L, Harigaya Y, Yager D, et al. Nature (London) 1996;383:710–713. doi: 10.1038/383710a0. [DOI] [PubMed] [Google Scholar]
- 30.Holcomb L, Gordon M N, McGowan E, Yu X, Benkovic S, Jantzen P, Wright K, Saad I, Mueller R, Morgan D, et al. Nat Med. 1998;4:97–100. doi: 10.1038/nm0198-097. [DOI] [PubMed] [Google Scholar]
- 31.Pike C J, A J, W-W, Kosmoski J, Cribbs D H, Glabe C G, Cotman C W. J Neurochem. 1995;64:253–265. doi: 10.1046/j.1471-4159.1995.64010253.x. [DOI] [PubMed] [Google Scholar]
- 32.Pike C J, Walencewicz A J, Glabe C G, Cotman C W. Brain Res. 1991;563:311–314. doi: 10.1016/0006-8993(91)91553-d. [DOI] [PubMed] [Google Scholar]
- 33.Reivich M. Res Publ Assoc Res Nerv Ment Dis. 1974;53:125–140. [PubMed] [Google Scholar]
- 34.Astrup J, Siesjö B K, Symon L. Stroke. 1981;6:723–725. doi: 10.1161/01.str.12.6.723. [DOI] [PubMed] [Google Scholar]
- 35.Hossmann K-A. Ann Neurol. 1994;36:557–565. doi: 10.1002/ana.410360404. [DOI] [PubMed] [Google Scholar]
- 36.Chapman P F, White G L, Jones M W, Cooper-Blacketer D, Marshall V J, Irizarry M, Younkin L, Good M A, Bliss T V, Hyman B T, et al. Nat Neurosci. 1999;2:271–276. doi: 10.1038/6374. [DOI] [PubMed] [Google Scholar]