

Abstract
Environmental change plays a large role in the emergence of infectious disease. The construction of a new road in a previously roadless area of northern coastal Ecuador provides a valuable natural experiment to examine how changes in the social and natural environment, mediated by road construction, affect the epidemiology of diarrheal diseases. Twenty-one villages were randomly selected to capture the full distribution of village population size and distance from a main road (remoteness), and these were compared with the major population center of the region, Borbón, that lies on the road. Estimates of enteric pathogen infection rates were obtained from case-control studies at the village level. Higher rates of infection were found in nonremote vs. remote villages [pathogenic Escherichia coli: odds ratio (OR) = 8.4, confidence interval (CI) 1.6, 43.5; rotavirus: OR = 4.0, CI 1.3, 12.1; and Giardia: OR = 1.9, CI 1.3, 2.7]. Higher rates of all-cause diarrhea were found in Borbón compared with the 21 villages (RR = 2.0, CI 1.5, 2.8), as well as when comparing nonremote and remote villages (OR = 2.7, CI 1.5, 4.8). Social network data collected in parallel offered a causal link between remoteness and disease. The significant and consistent trends across viral, bacterial, and protozoan pathogens suggest the importance of considering a broad range of pathogens with differing epidemiological patterns when assessing the environmental impact of new roads. This study provides insight into the initial health impacts that roads have on communities and into the social and environmental processes that create these impacts.
Keywords: community study, developing country, diarrheal disease, environment, humans
The more public health scientists learn about infectious disease processes, the more they can implicate environmental changes in the recent emergence or reemergence of infectious diseases (1–3). Given the increasing number of emerging pathogens recently identified, there is an urgent need to understand how environmental change influences disease burden. Such changes are potentially more visible in places where they have been caused by human activity, such as construction of dams, pipelines, and roads. Anthropogenic environmental changes that cause populations to move and settle in new ways can provide the opportunity to observe the relationship between environmental change and disease transmission. Where such environmental changes are unevenly distributed across a region, thereby producing the conditions of a natural experiment, these relationships can be observed easily and systematically. The construction of a new road in a previously roadless area in northern coastal Ecuador provides just such a natural experiment to examine how changes in the social and natural environment, mediated by road construction, affect the epidemiology of diarrheal diseases.
Various studies have examined the impact of road construction on disease incidence (4). For example, the building of the TransAmazon Highway was associated with an increase in malaria (5, 6). These increases in incidence were attributed to the presence of water pools created by road construction practices. More recently, a study in the Peruvian Amazon indicated that mosquito biting rates are significantly higher in areas that have undergone deforestation and development associated with road development (7). Analogously, a study in India measured a higher prevalence of dengue vectors along major highways than elsewhere (8). Studies in Uganda suggest that the main road linking Kenya to Kampala has higher proportions of HIV-positive women working in bars and HIV-positive truck drivers than does the surrounding area (9). In general, transportation changes mobility and circulation of humans, which can affect the incidence of sexually transmitted diseases (10), as well as health-care-seeking behavior (11, 12). As opposed to sexually transmitted diseases, fecal–oral pathogens can survive outside of the human host and therefore will behave differently under environmental changes. Some studies have suggested that remote villages separated by large distances are less able to sustain transmission of certain fecal–oral pathogens, such as amoebas and rotavirus (13–15). The impact that environmental changes from road construction have on these diarrheal diseases remains largely unexplored and unknown, despite the fact that diarrheal diseases remain a major cause of mortality among infants and children under 5 years of age (16).
In 1996 the Ecuadorian government began a road construction project to link the southern Colombian border with the Ecuadorian coast. A two-lane asphalt highway was completed in 2001, spanning 100 km across the southern end of the Chocó rainforest near the Pacific Ocean. Secondary roads continue to be built, linking additional villages to the paved road (Fig. 1). These roads provide a faster and cheaper mode of transportation compared with rivers. The extent to which roads influence communities should be measured by their proximity in time and distance to a given village (e.g., remoteness) and not merely by their presence or absence.
Fig. 1.

Map of study region. The 21 villages are categorized by river basin (Santiago, Cayapas, Onzole, Bajo Borbón, and road) and by remoteness (close, medium, and far).
To examine the impact of remoteness on diarrheal disease we implemented a hierarchical design that collects data by village to obtain information about the region, and by individual to obtain information about potential confounding factors that may bias the analysis. Roads influence disease transmission through a variety of mechanisms. For example, road proximity can increase in- and out-migration rates causing multiple demographic changes in the age, racial, and socioeconomic profile. These rapid and complex changes can reduce social connectedness within a community, which may in turn reduce a community's ability to maintain good sanitation and hygiene conditions. Road proximity can also affect short-term travel patterns, thereby increasing the potential for the introduction of new pathogen strains into communities.
In addition to diarrheal symptoms, three specific marker pathogens (Escherichia coli, rotavirus, and Giardia) were followed, each with a distinct epidemiology. Both pathogenic E. coli and rotavirus are responsible for a large proportion of diarrhea mortality and severe morbidity throughout the developing world, whereas Giardia, also a major cause of diarrhea, is more pervasive, resulting in higher infection rates (17). Taken together, these three pathogens represent the primary pathways (food, water, and person-to-person) for transmission of diarrhea.
Results
Table 1 presents community characteristics, with two methods for characterizing location: remoteness of a community relative to the town Borbón and river basin in which a community resides. The least remote community has a remoteness value of 0.012, and the most remote village has a remoteness value of 0.198. Close villages were defined as those with a remoteness value of <0.03; medium villages were defined as those with a remoteness value between 0.03 and 0.13; and remote villages were defined as those with a remoteness value >0.13. These classifications are also represented in the regional map (Fig. 1). Village population size ranged from 28 to 731, and the random sample of 200 houses in Borbón resulted in 864 individuals, or ≈20% of the population.
Table 1.
Community characteristics
| Village | Population size | Remoteness metric | Remoteness category | River basin |
|---|---|---|---|---|
| 1 | 284 | 0.012 | Close | Road |
| 2 | 731 | 0.015 | Close | Road |
| 3 | 78 | 0.022 | Close | Cayapas |
| 4 | 482 | 0.027 | Close | Road |
| 5 | 156 | 0.040 | Medium | Santiago |
| 6 | 55 | 0.040 | Medium | Bajo Borbón |
| 7 | 138 | 0.040 | Medium | Bajo Borbón |
| 8 | 72 | 0.049 | Medium | Road |
| 9 | 90 | 0.049 | Medium | Santiago |
| 10 | 60 | 0.061 | Medium | Onzole |
| 11 | 86 | 0.080 | Medium | Onzole |
| 12 | 110 | 0.113 | Medium | Cayapas |
| 13 | 135 | 0.122 | Medium | Santiago |
| 14 | 83 | 0.140 | Far | Onzole |
| 15 | 300 | 0.152 | Far | Santiago |
| 16 | 228 | 0.155 | Far | Santiago |
| 17 | 79 | 0.158 | Far | Cayapas |
| 18 | 268 | 0.165 | Far | Cayapas |
| 19 | 28 | 0.173 | Far | Onzole |
| 20 | 443 | 0.190 | Far | Onzole |
| 21 | 130 | 0.198 | Far | Cayapas |
| Borbón | 864 | 0 |
Remoteness is a measure of the time and cost of travel to Borbón. Roads provide cheaper and faster access to Borbón, and therefore remoteness is a measure of the proximity to the road. Note that the population of Borbón is the sample size enrolled in the study, rather than the size of the entire population (≈5,000).
A total of 298 cases of diarrhea were identified in the communities during the three case-control cycles, and 44 cases were identified in Borbón during the one case-control cycle (Table 2). In addition, a total of 845 and 125 controls were sampled from the communities and Borbón, respectively. Crude prevalence estimates are shown in Table 3 for diarrhea and infection by both case status and remoteness category. The crude prevalence estimates for diarrhea [RR = 2.0, 95% confidence interval (CI) 1.5, 2.8] and pathogenic E. coli (RR = 16.0, 95% CI 13.2, 19.2) were significantly higher in Borbón compared with those in other communities (Table 4). These large differences between infection prevalence in Borbón vs. the community are seen in both cases and controls (Table 3). We found no evidence that crude prevalence estimates for rotavirus and Giardia varied between Borbón and the other 21 communities.
Table 2.
Number of cases and controls by remoteness
| Remoteness category | No. of villages | Population | No. of collection days | No. of cases | No. of controls |
|---|---|---|---|---|---|
| Remote | 8 | 1,669 | 45 | 112 | 317 |
| Medium | 9 | 895 | 45 | 91 | 248 |
| Close | 4 | 1,592 | 45 | 95 | 280 |
| Community* | 21 | 4,156 | 45 | 298 | 845 |
| Borbón | 1 | 867 | 15 | 44 | 125 |
For communities other than Borbón, figures are the sum from three 15-day case-control studies across all 21 study villages between August 2003 and February 2006. Borbón figures are from one 15-day case-control study in July 2005.
*Total from all 21 villages (sum of remote, medium, and close villages).
Table 3.
Crude infection prevalence by case status and remoteness (prevalence per 100 persons)
| Remoteness category | Diarrhea prevalence, cases/100 | Overall infection prevalence, infections/100 |
Asymptomatic infection prevalence, infections/100 |
Symptomatic infection prevalence, infections/100 |
||||||
|---|---|---|---|---|---|---|---|---|---|---|
| E. coli | Rotavirus | Giardia | E. coli | Rotavirus | Giardia | E. coli | Rotavirus | Giardia | ||
| Remote | 2.6 | 1.0 | 2.7 | 16.7 | 0.6 | 2.2 | 15.8 | 0.4 | 0.6 | 0.9 |
| Medium | 4.6 | 3.1 | 3.6 | 16.6 | 2.3 | 2.7 | 15.2 | 0.5 | 0.9 | 1.5 |
| Close | 2.2 | 3.9 | 6.7 | 23.2 | 3.0 | 6.2 | 22.4 | 0.1 | 0.5 | 0.8 |
| Community | 2.8 | 2.4 | 4.5 | 19.4 | 1.9 | 4 | 18.4 | 0.3 | 0.6 | 0.9 |
| Borbón | 5.6 | 22.5 | 3.6 | 19.5 | 20.7 | 2.3 | 17.6 | 1.7 | 1.2 | 1.9 |
For communities other than Borbón estimates are based on the average of three 15-day case-control studies across all 21-study villages. Borbón estimates are based on one 15-day case-control study. Overall infection prevalence is based on a weighted average of infection in cases and controls. Prevalence estimates are based on a 15-day period prevalence.
Table 4.
Comparison of infection prevalence in communities vs. Borbón
| Community, cases/100 | Borbón, cases/100 | Relative risk (95% CI) | |
|---|---|---|---|
| E. coli | 1.6 | 22.5 | 16.0 (13.2, 19.2) |
| Rotavirus | 4.5 | 3.6 | 0.8 (0.6, 1.2) |
| Giardia | 19.4 | 19.5 | 1.0 (0.9, 1.2) |
| Diarrhea | 2.8 | 5.6 | 2.0 (1.5, 2.8) |
For communities other than Borbón estimates are based on the average of three 15-day case-control studies across all 21 study villages. Borbón estimates are based on one 15-day case-control study. Pathogen prevalence is based on infection (a weighted average of cases and controls). Relative risk is the prevalence risk ratio (the risk of illness or infection in Borbón relative to the communities).
Adjusting for age of individuals, community population size, and sanitation level, the prevalence of infection was significantly higher in villages closer to or along a road compared with those communities far from the road for pathogenic E. coli [odds ratio (OR) = 3.9, 95% CI 1.1, 13.6], rotavirus (OR = 4.1, 95% CI 2.0, 8.4), Giardia (OR = 1.6, 95% CI 1.0, 2.4); the same was true for all-cause diarrhea (OR = 1.8, 95% CI 1.2, 2.6) (Table 5). Precipitation was not included in the final model because its P value was >0.2. These overall infection trends were largely driven by the controls, as evident from the crude prevalence estimates in Table 3 that are stratified by case status. Although the crude diarrhea prevalence values show no trend as a function of remoteness, the adjusted risk estimates comparing both remote and medium as well as remote and close were significant, after adjusting for the population size and sanitation level of each community (Table 5).
Table 5.
Infection as a function of remoteness
| OR (95% CI) |
||||
|---|---|---|---|---|
| E. coli | Rotavirus | Giardia | Diarrhea | |
| Remote | 1.00 | 1.00 | 1.00 | 1.00 |
| Medium | 3.0 (0.8, 11.9) | 1.3 (0.5, 3.2) | 1.2 (0.7, 2.0) | 1.8 (1.1, 3.0) |
| Close | 3.9 (1.1, 13.6) | 4.1 (2.0, 8.4) | 1.6 (1.0, 2.4) | 1.8 (1.2, 2.6) |
| Continuous | 8.4 (1.6, 43.5) | 4.0 (1.3, 12.1) | 1.9 (1.3, 2.7) | 2.7 (1.5, 4.8) |
OR of infection/disease for individuals in communities that are classified as close or medium from Borbón as compared with those communities that are classified as far (remote). The continuous measure is the OR comparing the farthest with the closest using a continuous measure of remoteness. Estimates were adjusted for age of individual, population size of village, and community-level sanitation.
To test for a trend, remoteness was modeled as a continuous variable. The relative risk of infection associated with a decrease in remoteness from the farthest to the closest village was significant for all infections: pathogenic E. coli (OR = 8.4, 95% CI 1.6, 43.5), rotavirus (OR = 4.0, 95% CI 1.3, 12.1), and Giardia (OR = 1.9, 95% CI 1.3, 2.7). For all-cause diarrhea the relative risk was also significant (OR = 2.7, 95% CI 1.5, 4.8) (Table 5).
Discussion
We observed strong trends in infection rates and all-cause diarrhea in villages across a gradient of remoteness for our marker pathogens even after adjusting for population size, sanitation, and precipitation. This result suggests that villages farther from the road have lower infection rates than villages closer to the road. This relationship between infection and road proximity is also seen in Borbón, the only community directly connected to both the primary road and all of the major rivers that serve the region. We observed significantly higher rates of E. coli and all-cause diarrhea in Borbón than in the other 21 study communities. These health differences have policy significance given that both pathogenic E. coli and rotavirus are major causes of mortality and severe morbidity in children.
These data were collected across three river basins during three visits to each town over 2 years, minimizing the chance that unmeasured localized events either temporally or spatially confounded the risk estimates. We found no statistical relationship between diarrhea or infection rates and time period or river basin. Any unmeasured confounding would have had to continue over the 2-year study period or had to occur across the three river basins.
Explaining the causes of the trends discussed here requires understanding the ecological and social impacts of roads. One common purpose (and consequence) of a new road is increased logging. Deforestation causes major changes in watershed characteristics and local climate, both of which can affect the transmission of enteric pathogens (18). Perhaps more important than ecological processes, social processes facilitated by roads such as migration, creation of new communities, and increased density of existing communities can affect pathogen transmission. Changes in community social structures often create or are accompanied by inadequate infrastructure, which affects hygiene and sanitation levels, and in turn the likelihood of transmission of enteric pathogens. Roads can also increase flows of consumer goods such as processed food, material goods, and medicines and may also provide communities with increased access to health care, health facilities, and health information.
By determining the transmission potential of the causal factors associated with new roads, we can better interpret the observed trends in infection rates across our study region. The propensity of a pathogen to persist within a community is characterized by the reproductive number Ro, defined as the average number of infections caused by an infectious individual in a completely susceptible population (19). For directly transmitted diseases, Ro is a function of (i) contact rate among others within or outside the community, (ii) infectivity (the probability of infection given a contact), and (iii) duration of the infectious period. For enteric pathogens that can persist in the environment, Ro is also a function of a pathogen's viability outside the human host and its ability to move to a new susceptible one. The consistent and strong trends observed in these data across viral, bacterial, and protozoan pathogens suggest that Ro for many enteric pathogens is lower for remote villages compared with nonremote villages; i.e., these remote communities are less able to sustain transmission of pathogens.
The trends in infection rates that we observed are partially explained by the effect of social connectedness on the risk of transmission of many pathogens. Fig. 2 shows a causal diagram that illustrates how demographic changes, measured by rates of in- and out-migration for a community, and contact outside of village, measured by short-term travel of people in and out of a community, might increase levels of infection or disease for fecal–oral pathogens. Localized migration facilitated by roads can lead to a community whose residents have few social connections, which is one measure of social capital (20). Previous studies have shown that communities with more social capital tend to be successful in creating adequate water and sanitation infrastructure because they tend to know one another, are accustomed to working together, and share social norms (21–23). On the other causal pathway, road proximity can increase the contact that individuals within a village have with those outside the village, increasing the rate of introduction of pathogens.
Fig. 2.

Causal diagram linking proximity of the road to increases in infection and diarrheal disease
Our study villages show some evidence of these hypothesized relationships among demographic characteristics, social connectedness, and movement of people. Village data suggest that connectedness, as measured by the average number of individuals a given person spends time with (social network degree), is positively associated with remoteness (Fig. 3B). Additionally, villages closer to the road have increased movement of people (Fig. 3A), which provides opportunities for pathogen incursion. The slope of the line reflects the strength of the relationship: twice as many connections exist in the most remote village compared with the least remote. Likewise, 28% of the remote villagers said they had left the village in the last week, compared with 48% of the least remote villagers.
Fig. 3.

Relationship between social factors and remoteness. (A) Movement outside of community, measured by the percentage leaving the village during the past week (linear fit R2 = 0.25, P ≤ 0.05). (B) The social connectedness within a community, as measured by the number of villagers a given individual spent time with during the past week (linear fit R2 = 0.50, P ≤ 0.05).
Pathogen-specific outcomes provide additional insight into the relationship between remoteness and transmission. Observed trends were strongest for E. coli, followed by rotavirus and then Giardia. This differential can be partially explained by the biological and environmental factors that govern transmission dynamics and level of Ro; e.g., pathogen infectivity, as measured by infectious inoculum, shedding rates, and environmental persistence, as measured by the ability of the pathogen to remain viable in the environment, all directly affect Ro. Infectivity data suggest that Giardia, with a low ID50 (the inoculum at which 50% of exposed subjects are infected) and long shedding duration, and rotavirus, with a low ID50 and high shedding rates, are more infectious (24–26) than diarrhea-causing E. coli (26–31). Diarrheagenic E. coli species tend to persist in the environmental for shorter periods of time than either Giardia or rotavirus (24, 32–36).
The above observations on both infectivity and environmental persistence suggest that Giardia is able to maintain transmission within the more remote villages despite limited outside social contact and higher levels of social connectedness. Likewise, E. coli would be less able to maintain transmission, and rotavirus would lie somewhere in between. The significant difference in E. coli infection rates between Borbón and the other communities and the lack of difference in Giardia infection rates are consistent with this hypothesis.
The significant and consistent trends across viral, bacterial, and protozoan pathogens suggest the importance of considering a broad range of health outcomes when assessing environmental impact. Each of our marker pathogens has a different epidemiology that is affected by environmental changes in different ways. A stratified analysis that looks across pathogen types, and not just at a broader disease category like diarrhea, allows for a more sensitive measure of change and can elucidate more specific interventions to alleviate these environmental impacts. We propose this design as a general model that can be used to examine anthropogenic environmental determinants of health in other places.
A number of issues require further examination. In this regional analysis we compare remote and nonremote villages at a given point in time. Investigating changes in incidence compared with changes in remoteness over time may provide additional causal information about how road development affects disease, because the time scale of these social changes may take years or decades, and the details are complex and poorly understood. In addition, molecular analysis of pathogens could elucidate transmission patterns across the landscape, and data on human migration patterns might provide information on causal linkages between roads and diarrheal disease. To substantiate the causal diagram shown in Fig. 2, better measures of social capital and its relation to water and sanitation are needed. Gathering information on other health outcomes such as nutrition and vectorborne and sexually transmitted disease would also provide the opportunity to broaden our examination of causal linkages between road development and disease, because these are likely to vary for different etiologies.
Environmental effects are often both geographically widespread and temporally extended and therefore can be difficult to correlate with disease outcomes. The ability to observe change requires a study design and analysis that involve data collection within a systems-level framework. The natural experiment created by road construction in this region, combined with the regional design, allows these relationships to be studied. When associations between exposure and outcome are placed in the broader context of processes in which they occur (Fig. 2), one can examine the causal linkages between environmental change and disease at a systems level.
When international agencies like the World Bank make decisions about whether to invest or how best to proceed in large-scale infrastructure projects, their impact assessments have begun to pay attention to variables associated with environmental, social, and health factors (37). Although the World Bank now includes human health as a component of the environmental impact of road construction (38), few studies of the health effects of roads exist, particularly with respect to infectious disease transmission (see www.who.int/hia/examples/en). This analysis provides insight into the interactions between roads, the social and environmental processes that they affect, and the resulting impacts on the health of human communities. These complex causal pathways suggest that efforts to mitigate the negative effects of roads should consider a larger range of their short- and long-term health implications.
Materials and Methods
Study Population and Selection Process.
The study area is located in the northern Ecuadorian province of Esmeraldas in the canton Eloy Alfaro, which comprises ≈150 villages. Villages are located along three rivers, the Río Cayapas, Río Santiago, and Río Onzole, all draining toward the town Borbón, the main population center of the region. Borbón, with ≈5,000 inhabitants, is distinct from the other communities along the river. It has a higher population density but nonetheless maintains an underdeveloped infrastructure for its size, with untreated sewage, rudimentary solid waste management systems, and minimal water and sanitation services that vary in quality between households. The communities outside Borbón, on the other hand, are smaller in size and density. Their water is primarily obtained from rivers and consumed untreated, although rainwater is used intermittently, and a few communities have wells or receive piped water from surface sources. Sanitation facilities are of varying quality, although they generally would be classified as unimproved by World Health Organization criteria; flush toilets are uncommon. The region is primarily populated by Afro-Ecuadorians, with a smaller proportion represented by Chachis, an indigenous group that mostly resides in more remote villages. There are an increasing number of mestizos (people of mixed origin) moving into villages close to or on the road. More details on the region can be accessed elsewhere (39–43).
The construction of the road from Borbón westward to the coast was completed in 1996. The portion of the road connecting Borbón eastward to the upper reaches of the Andes was completed in 2003. Secondary and tertiary dirt roads off of this two-lane asphalt highway are continually being built, mostly for logging. At the time the data were collected, both the primary and secondary roads reached 15% of the 150 villages in the canton.
All villages in the region were categorized based on their geographic location relative to Borbón. A sample of 21 villages was selected by using block randomization to ensure that villages throughout the study region were represented. At the beginning of the study, four of the 21 study villages were connected to the road. All households within each village were recruited. In Borbón, a random sample of 200 households (of ≈1,000) was selected for inclusion in the study. Consent was obtained at both the village and household level. Institutional review board committees at the University of California (Berkeley), Trinity College, and Universidad San Francisco de Quito approved all protocols.
Study Design.
Between July 2003 and May 2005 each enrolled village was visited three times on a rotating basis. Each visit lasted 15 days, during which all cases of diarrhea were identified by visiting each household every morning. For each occurrence of diarrhea two controls were randomly sampled from the same community and one control was sampled from the case household. One 15-day case-control study was conducted in Borbón in July 2005.
Cases were defined as an individual who had three or more loose stools in a 24-h period. Controls were defined as someone with no signs of diarrhea in the past 6 days.
Microbiologic Analyses.
Every morning during the 15-day period field staff members visited each household to find cases of diarrhea and collect stool samples from cases and controls. The samples were tested for rotavirus, pathogenic E. coli, and Giardia. All stools were stored on ice and processed within 48 h. In the field an EIA kit was used to identify rotavirus (RIDA Quick Rotavirus; R-Biopharm, Darmstadt, Germany). An aliquot of stool was preserved in liquid nitrogen and tested for Giardia in Quito with an ELISA kit (RIDASCREEN Giardia; R-Biopharm). For bacterial analysis, stool was plated directly onto MacConkey and XLD agar. All lactose-negative isolates were analyzed for urease and oxidase, and with API 20 E (bioMèrieux, Marey l'Etoile, France) to speciate the bacterial isolates. Lactose-negative isolates that were identified as either Shigella or E. coli, along with five randomly chosen lactose-positive isolates, were further analyzed by PCR. Pathotype-specific primers were used to diagnose the following: enterotoxigenic E. coli (ETEC), enteropathogenic E. coli (EPEC), enteroinvasive E. coli (EIEC), and Shigella spp., as reported previously (44). The primers amplified the bfp gene of EPEC, the LT and STa genes of enterotoxigenic E. coli, and the ipaH gene of EIEC and Shigella spp. The specific procedure is discussed elsewhere (44). Both a positive and negative control were used in each gel run. A positive control for each pathotype was provided by Lee Riley (University of California, Berkeley). A K12 E. coli strain was used for the negative control. In the following analysis Shigella and E. coli cases were grouped together.
Demographic and Socioeconomic Survey.
To determine individuals' movements and social interactions, we administered demographic and sociometric surveys to all study participants. The surveys included questions regarding travel to and from the community, as well as social contacts outside the individual's household during the previous week. The degree of social connectedness for each individual was defined as the number of names provided to the interviewer in response to the question, “who did you spend time with in your community, other than household members, during the past week?” plus the number of times that individual was nominated by others within the community (45, 46). The surveys were developed after extensive anthropological observations to obtain regionally appropriate phrasing of questions. They were translated and back-translated to ensure accuracy. Interviewers were trained together to ensure uniformity. All data were entered into Access (Microsoft, Redmond, WA). Standard quality control procedures were conducted, including examining the data for logical errors and double entry of 10% of the surveys. The surveys were administered once to each study participant, with an average of 82% coverage per village. To cover all study villages, half of the surveys were administered in the summer of 2003 and half in the summer of 2004.
Statistical Analysis.
For each village, travel time and total cost of travel to Borbón were recorded by field staff members. For each village i, rank of remoteness, Ri, was then calculated by summing normalized values of time, Ti, and cost, Ci. Specifically,
 |
Because the metric is the result of two values standardized to a [0,1] scale, the possible range of Ri is from 0 (the town Borbón itself) to 2 (the theoretical farthest community from Borbón). Villages were classified into three groups based on their remoteness metric: close, medium, and far from Borbón.
Community prevalence of infection for each village was calculated by aggregating data from all three case-control cycles and weighting cases and controls appropriately; i.e., we assumed that all cases were identified during the 15-day surveys and that the controls were a random sample of those without diarrhea. Specifically, the population prevalence of pathogen i in community j was estimated as follows:
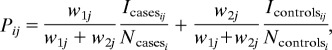 |
where Icasesij and Icontrolsij are the number of individuals in which pathogen i was isolated in the cases and controls, respectively, Ncasesi and Ncontrolsi are the number of cases and controls, respectively, w1 = the inverse of the proportion of cases tested for the particular pathogen (this weight is equal to one when diarrhea is the outcome variable), and w2 = (total population − no. of cases identified)/(no. of controls).
To estimate the change in risk of infection/disease by remoteness we used a logistic regression model, parameterizing remoteness in two different ways: (i) as a continuous variable (distance between the closest village, which is adjacent to Borbón, to the farthest among the study villages) and (ii) as a pair of categorical indicator variables (“close” and “medium,” with “far” considered baseline). Models included one individual-level variable (age of participant at time of case control visit) as well as the following community-level variables: sanitation level (percentage of individuals who stated that they used improved sanitation, i.e., latrines or septic tanks), population size, and average 30-day rainfall (using data from the 15 days before and 15 days during the case-control study). For all analyses, we derived the statistical inference using robust estimates of the standard errors from a generalized estimating equation approach (47). This approach accounts for residual correlation of the outcomes of individuals within the same villages and provides inference that is not sensitive to model misspecification. The relatively low prevalence of diarrhea in this population permitted us to estimate relative risk with the prevalence odds ratio from our logistic model (48). All analysis was conducted by using STATA version 8 (Stata, College Station, TX).
Acknowledgments
We thank the Ecologia, Desarrollo, Salud, y Sociedad (EcoDESS) project field team for their invaluable contribution collecting the data. This study was supported by National Institute of Allergy and Infectious Diseases Grant R01-AI050038.
Abbreviations
- CI
confidence interval
- OR
odds ratio.
Footnotes
The authors declare no conflict of interest.
References
- 1.Morse SS. Emerg Infect Dis. 1995;1:7–15. doi: 10.3201/eid0101.950102. [DOI] [PMC free article] [PubMed] [Google Scholar]
- 2.Patz JA, Graczyk TK, Geller N, Vittor AY. Int J Parasitol. 2000;30:1395–1405. doi: 10.1016/s0020-7519(00)00141-7. [DOI] [PubMed] [Google Scholar]
- 3.Colwell RR, Epstein PR, Gubler D, Maynard N, McMichael AJ, Patz JA, Sack RB, Shope R. Science. 1998;279:968–969. doi: 10.1126/science.279.5353.963g. [DOI] [PubMed] [Google Scholar]
- 4.Birley MH. The Health Impact Assessment of Development Projects. London: HMSO; 1995. [Google Scholar]
- 5.Coimbra CEA. Hum Org. 1988;47:254–260. [Google Scholar]
- 6.Ault SK. In: Demography and Vector-Borne Diseases. Service MW, editor. Boca Raton, FL: CDC; 1989. pp. 283–301. [Google Scholar]
- 7.Vittor AY, Gilman RH, Tielsch J, Glass G, Shields T, Lozano WS, Pinedo-Cancino V, Patz JA. Am J Trop Med Hyg. 2006;74:3–11. [PubMed] [Google Scholar]
- 8.Dutta P, Khan SA, Sharma CK, Doloi P, Hazarika NC, Mahanta J. Southeast Asian J Trop Med Public Health. 1998;29:173–176. [PubMed] [Google Scholar]
- 9.Carswell JW. AIDS. 1987;1:223–227. [PubMed] [Google Scholar]
- 10.Panos Institute. AIDS and the Third World. London: Panos Institute; 1988. [Google Scholar]
- 11.Airey T. Transport Rev. 1991;11:273–290. [Google Scholar]
- 12.Airey T. Soc Sci Med. 1992;34:1135–1146. doi: 10.1016/0277-9536(92)90287-z. [DOI] [PubMed] [Google Scholar]
- 13.Black FL. Science. 1975;187:515–518. doi: 10.1126/science.163483. [DOI] [PubMed] [Google Scholar]
- 14.Gilman RH, Davis C, Gan E, Bolton M. Am J Trop Med Hyg. 1976;25:663–666. doi: 10.4269/ajtmh.1976.25.663. [DOI] [PubMed] [Google Scholar]
- 15.Gunnlaugsson G, Smedman L, da Silva MC, Grandien M, Zetterstrom R. Acta Paediatr Scand. 1989;78:62–66. doi: 10.1111/j.1651-2227.1989.tb10888.x. [DOI] [PubMed] [Google Scholar]
- 16.World Health Organization and United Nations Children's Fund. Geneva: WHO/UNICEF; 2004. p. 36. [Google Scholar]
- 17.Blaser MJ, Smith PD, Greenberg HB, Rivdin JI, Guerrant RL. Infections of the Gastrointestinal Tract. 2nd Ed. Philadelphia: Lippincott Williams & Wilkins; 2002. [Google Scholar]
- 18.Curriero FC, Patz JA, Rose JB, Lele S. Am J Public Health. 2001;91:1194–1199. doi: 10.2105/ajph.91.8.1194. [DOI] [PMC free article] [PubMed] [Google Scholar]
- 19.Anderson RM, May R. Infectious Diseases of Humans: Dynamics and Control. New York: Oxford Univ Press; 1991. [Google Scholar]
- 20.Bebbington A, Perreault T. Econ Geogr. 1999;75:395–418. [Google Scholar]
- 21.Isham J, Kahkonen . The Institutional Determinents of the Impact of Community-Based Water Services: Evidence from Sri Lanka and India. Washington, DC: World Bank; 1998. [Google Scholar]
- 22.Watson G, Jagannathan V, Gelting R, Beteta H. In: User Organizations for Sustainable Water Services. Subramanian A, Jagannathan V, Meinzen-Dick R, editors. Washington, DC: World Bank; 1997. Technical Paper no. 354. [Google Scholar]
- 23.Grootaert C, van Bastelaer T, editors. Understanding and Measuring Social Capital: A Multidisciplinary Tool for Practitioners. Washington, DC: World Bank; 2002. [Google Scholar]
- 24.Carter MJ. J Appl Microbiol. 2005;98:1354–1380. doi: 10.1111/j.1365-2672.2005.02635.x. [DOI] [PubMed] [Google Scholar]
- 25.Regli S, Rose JB, Haas CN, Gerba CP. J Am Water Work Assn. 1991;83:76–84. [Google Scholar]
- 26.Teunis PFM, van der Heijden OG, van der Giessen JWB, Havelaar AH. The Dose–Response Relation in Human Volunteers for Gastrointestinal Pathogens. Bilthoven, The Netherlands: National Institute of Public Health and the Environment; 1986. [Google Scholar]
- 27.DuPont HL, Formal SB, Hornick RB, Snyder MJ, Libonati JP, Sheahan DG, LaBrec EH, Kalas JP. N Engl J Med. 1971;285:1–9. doi: 10.1056/NEJM197107012850101. [DOI] [PubMed] [Google Scholar]
- 28.DuPont HL, Levine MM, Hornick RB, Formal SB. J Infect Dis. 1989;159:1126–1128. doi: 10.1093/infdis/159.6.1126. [DOI] [PubMed] [Google Scholar]
- 29.Feachem RG. Sanitation and Disease: Health Aspects of Excreta and Wastewater Management. Chichester, UK: Wiley; 1983. [Google Scholar]
- 30.Haas CN, Rose JB, Gerba CP. Quantitative Microbial Risk Assessment. New York: Wiley; 1999. [Google Scholar]
- 31.Karch H, Russmann H, Schmidt H, Schwarzkopf A, Heesemann J. J Clin Microbiol. 1995;33:1602–1605. doi: 10.1128/jcm.33.6.1602-1605.1995. [DOI] [PMC free article] [PubMed] [Google Scholar]
- 32.deRegnier DP, Cole L, Schupp DG, Erlandsen SL. Appl Environ Microbiol. 1989;55:1223–1229. doi: 10.1128/aem.55.5.1223-1229.1989. [DOI] [PMC free article] [PubMed] [Google Scholar]
- 33.Estes MK. In: Fundamental Virology. Fields BN, Knipe DM, editors. New York: Raven; 1991. pp. 619–644. [Google Scholar]
- 34.Enriquez CE, Hurst CJ, Gerba CP. Water Res. 1995;29:2548–2553. [Google Scholar]
- 35.McFeters GA, Bissonnette GK, Jezeski JJ, Thomson CA, Stuart DG. Appl Microbiol. 1974;27:823–829. doi: 10.1128/am.27.5.823-829.1974. [DOI] [PMC free article] [PubMed] [Google Scholar]
- 36.Raphael RA, Sattar SA, Springthorpe VS. Can J Microbiol. 1985;31:124–128. doi: 10.1139/m85-024. [DOI] [PubMed] [Google Scholar]
- 37.World Bank. Health Aspects of Environmental Impact Assessment: Environmental Assessment Sourcebook Update 18. Washington, DC: World Bank; 1997. [Google Scholar]
- 38.Tsunakawa K, Hoban C, editors. Roads and the Environment: A Handbook. Washington, DC: World Bank; 1997. Technical Paper no. 376. [Google Scholar]
- 39.Whitten NE. Black Frontiersmen: A South American Case. Cambridge, MA: Schenkman; 1974. [Google Scholar]
- 40.Whitten NE. Class, Kinship, and Power in an Ecuadorian Town: The Negroes of San Lorenzo. Stanford, CA: Stanford Univ Press; 1965. [Google Scholar]
- 41.Sierra R. Environ Conserv. 1999;26:136–145. [Google Scholar]
- 42.Sierra R, Stallings J. Hum Ecol. 1998;26:135–161. [Google Scholar]
- 43.Rival L. Oxford Dev Stud. 2003;31:479–501. [Google Scholar]
- 44.Tornieporth NG, John J, Salgado K, de Jesus P, Latham E, Melo MC, Gunzburg ST, Riley LW. J Clin Microbiol. 1995;33:1371–1374. doi: 10.1128/jcm.33.5.1371-1374.1995. [DOI] [PMC free article] [PubMed] [Google Scholar]
- 45.Bell DC. Social Networks. 1999;21:1–21. [Google Scholar]
- 46.Scott J. Social Network Analysis: A Handbook. London: SAGE; 2000. [Google Scholar]
- 47.Zeger SL, Liang KY, Albert PS. Biometrics. 1988;44:1049–1060. [PubMed] [Google Scholar]
- 48.Jewell NP. Statistics for Epidemiology. Boca Raton, FL: Chapman and Hall/CRC; 2004. [Google Scholar]