Abstract
We use polarization-resolved mid-infrared pump-probe spectroscopy to study the effect of urea on the structure and dynamics of water. Surprisingly, we find that, even at high concentrations of urea (8 M), the orientational dynamics of most water molecules are the same as in pure liquid water, showing that urea has a negligible effect on the hydrogen-bond dynamics of these molecules. However, a small fraction of the water molecules (approximately one water molecule per urea molecule) turns out to be strongly immobilized by urea, displaying orientational dynamics that are more than six times slower than in bulk water. A likely explanation is that these water molecules are tightly associated with urea, forming specific urea–water complexes. We discuss these results in light of the protein denaturing ability of aqueous urea.
Keywords: hydrogen bonding, infrared pump-probe spectroscopy, orientational dynamics, protein denaturation
Solutions of urea in water display a number of interesting properties: hydrocarbons dissolve more readily in them than in pure water, and concentrated solutions can be used to denature proteins in a reversible way. The desire to understand these properties has triggered a great deal of research regarding the structure of aqueous solutions of urea (1–13). An important question that is encountered throughout the literature is to what extent the hydrogen-bond network of water is perturbed by the incorporation of a urea molecule, as one of the models explaining protein denaturation by urea is built on the assumption that urea strongly alters the hydrogen-bond structure of water (14). The urea–water system has been studied by using a variety of experimental and theoretical techniques, all of which shed light on a different aspect of the system. Linear infrared and Raman spectroscopies can provide structural information about the hydrogen-bond network, but they depend on simulations to unravel the effect of intermolecular interactions on spectral band shapes (15). Neutron diffraction experiments produce atom–atom radial distribution functions, and, as such, form more direct methods to obtain structural information (7). A different class of experimental techniques probes the hydrogen-bond network by observing the dynamics of water molecules. A stiffening of the network is revealed by the slowing down of the water dynamics, whereas faster dynamics are indicative of the weakening of the network. Among these methods are dielectric relaxation (5), NMR (6), and optical Kerr effect (OKE) spectroscopy (8). Dielectric relaxation and OKE provide dynamical information down to the picosecond time scale but probe the response of the solution as a whole, making it difficult to separate the water response from the urea response. NMR experiments selectively probe the dynamics of water, but determine a time-averaged response, so that water molecules in the urea solvation shell cannot be distinguished from molecules in the bulk. As a result, it is not yet clear to what extent the hydrogen-bond structure of water is changed by the addition of urea.
Here, we report on the use of mid-infrared pump-probe spectroscopy (16–18) to study the effect of urea on the hydrogen-bond network of water. This technique selectively probes the dynamics of water molecules on a subpicosecond time scale. On this time scale there is no exchange between water molecules inside the urea solvation shell and the bulk, and the method therefore has the potential to distinguish between these two water species.
Results
We used the orientational mobility of HDO molecules dissolved in H2O (8%) to probe the local rigidity of the hydrogen-bond network of urea–water mixtures of different proportions. The orientational mobility of HDO was measured through polarization resolved pump-probe spectroscopy of the OD-stretching vibration. In this experiment an intense mid-infrared pulse excites the OD vibrations of a significant fraction of the HDO molecules. The pump-induced absorption changes are monitored with probe pulses that are polarized parallel and perpendicular to the pump pulse. These two signals can be combined to yield the isotropic signal Δαiso(t) that is independent of orientational processes, and the anisotropy R(t) that is independent of vibrational relaxation and only reflects reorientation (see Materials and Methods).
The ND-stretching vibration of urea (ND is formed from NH by isotopic exchange with isotopically labeled water) absorbs in the same wavelength region as the OD-stretch vibration. Its contribution to the pump-probe signal at delays >1 ps, however, is negligible because of a number of factors: the ND vibration is present at a lower concentration than the OD vibration, its cross-section (which enters quadratically in the pump-probe signal) is approximately twice as small, and, most importantly, its lifetime is much shorter than that of the OD vibration (≈0.7 vs. 1.8 ps).
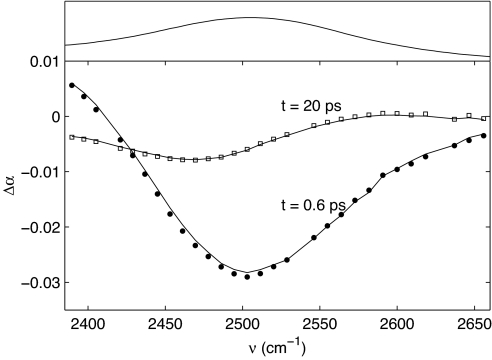
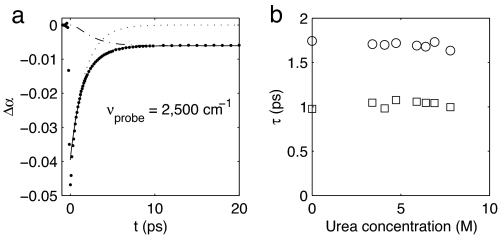
Fig. 1 shows transient spectra of the OD-stretching vibration of HDO in a 3.4 M solution of urea. The transient spectra are plotted for a pump-probe delay of 0.6 and 20 ps. At 0.6 ps the bleaching of the fundamental transition is observed ≈2,500 cm−1. For frequencies <2,410 cm−1 there is an induced absorption because of the absorption of the excited state. At 20 ps vibrational relaxation is complete; nevertheless, a nonzero transmission change is observed that shows no further decay over the experimentally accessible time range (500 ps). This transmission change results from the absorption and thermalization of the pump energy, which causes a rise in temperature and a consequent blueshift of the OD-stretch absorption band. This long time signal, which is indicative of heating, grows in during the relaxation of the OD vibration, and previous studies have demonstrated that it is important to correct the raw data for it before computing the anisotropy (17, 18). As it has been shown in these studies that the ingrowth of the heating is delayed with respect to vibrational relaxation, we use a two-step relaxation model to describe the ingrowing heating signal (18). The OD-stretch vibration first relaxes to an intermediate state, and the subsequent decay of this state leads to the thermalization of the pump energy. A fit of the relaxation model to the data for the 3.4 M solution (solid lines in Fig. 1) yields a lifetime of the OD vibration of 1.8 ± 0.1 ps and of the intermediate state of 1.0 ± 0.1 ps. In Fig. 2a we have represented the data from Fig. 1 as a delay scan at 2,500 cm−1. The fit allows us to separate the two contributions to the signal: the decaying bleach of the OD vibration (Fig. 2a, dotted line) and the ingrowing heating signal (Fig. 2a, dashed line). We used the same model to analyze the transient spectra of the other urea solutions. Fig. 2b shows that the two time constants do not vary with the urea concentration, indicating that urea has a negligible effect on the vibrational relaxation of water.
Fig. 1.
Transient spectra of HDO in a 3.4 M solution of urea in water. The spectra are plotted for a pump-probe delay of 0.6 and 20 ps. The solid lines represent fits to the two-step relaxation model described in the text. The top portion shows the linear infrared spectrum.
Fig. 2.
Delay scan and relaxation time constants. (a) Delay scan at 2,500 cm−1 of the transient spectrum of HDO in a 3.4 M solution of urea in water. The solid line is the fit to the relaxation model. The fit consists of two contributions: the bleaching of the OD vibration (dotted line) and the ingrowing heating signal (dashed line). (b) Lifetimes of the OD vibration (○) and the intermediate state (□) as a function of the urea concentration.
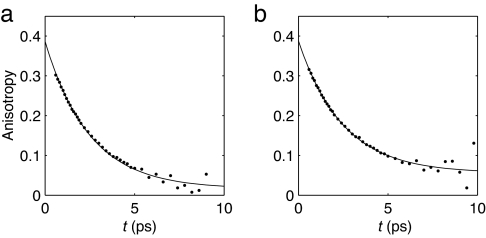
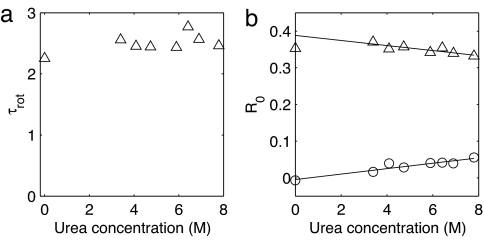
The parallel and perpendicular pump-probe signals were corrected for the ingrowing heating, and the corrected signals were used to compute the anisotropy. Fig. 3 shows the resulting anisotropies at the maximum of the bleach for two urea concentrations. No significant dependence of the anisotropy on the probe wavelength was observed. The two curves can be well described by monoexponential decays with a nonzero end level. This finding points to the presence of a fast and a slow process in the reorientation of the water molecules. The decay time constant of the fast process is plotted as a function of urea concentration in Fig. 4a. This time constant does not vary significantly with concentration and has a value of ≈2.5 ps. The slow component has a time constant that is >15 ps. Information about the origin of these two components can be obtained from the concentration dependence of their amplitudes. To extract the amplitudes of the two components we have simultaneously fit all anisotropy curves to biexponentials. These biexponentials had the same two decay time constants for all anisotropy curves, and only the relative amplitudes of the components were allowed to vary. This procedure yielded the fits that are shown as solid lines in Fig. 3. The two time constants had values of 2.5 ± 0.1 ps and >15 ps. In Fig. 4b the relative amplitudes of the two components are shown. The fraction of the slow component increases linearly with urea concentration.
Fig. 3.
Anisotropy decay at the maximum of the bleach (2,500 cm−1) for a 3.4 M solution (a) and a 7.8 M solution (b) of urea in water.
Fig. 4.
Time constants and amplitudes for the orientational dynamics. (a) Reorientation time (fast component, ▵) as a function of urea concentration. (b) Amplitudes of the slow component (○) and the fast component (▵) in the reorientation of HDO as a function of urea concentration. The solid lines are linear fits.
These results indicate that water in a urea–water mixture forms a two-component system. The majority of the water molecules reorient with a time constant of 2.5 ps, which is similar to the value found in previous pump-probe studies (2.5–2.7 ps) (18, 19) and NMR experiments (≈2 ps) (20, 21) on bulk water. Apparently these water molecules show bulk-like dynamics and are not affected by the urea molecules. A small fraction of the water molecules, however, display remarkably slower orientational dynamics and are strongly immobilized by the addition of urea. This fraction grows linearly with the urea concentration.
Discussion
Previous work on the urea–water system has produced results that remain inconclusive as to the exact effect of urea on the orientational dynamics of water. Dielectric relaxation on 1 and 2 M solutions of urea has indicated a slight slowing down of the water dynamics (5). However, the origin of the effect has remained unclear as the data could be reproduced by both a model that assumes a spread in the reorientation times of water and one that assumes a bimodal distribution, corresponding to bulk and solvation shell water molecules. Two molecular dynamics studies have reported reorientation times for the urea–water system. Idrissi et al. (22) have simulated the dynamics of water at high urea mole fractions (≈11 M) and report an increase in the reorientation time of water by an order of magnitude. Astrand et al. (9), on the other hand, have simulated 2 M solutions and have found a slight increase in the reorientation times of only the solvation shell water molecules. Finally, NMR experiments (6) reveal no significant effect of urea on the orientational dynamics of water up to concentrations of 10 M.
Here we have used HDO as a fast and local probe of the water dynamics, and we find unambiguous proof for the existence of two types of water molecules: bulk-like water molecules and strongly immobilized water molecules. The fact that the majority of the water molecules are unaffected by the presence of urea, even at a concentration of 8 M, is surprising. At such a high concentration all water molecules are essentially part of the solvation shell of a urea molecule, which consists of five to seven water molecules, as is known from molecular dynamics simulations (11). Given the fact that this number is slightly higher than the average number of water molecules available per urea molecule (between four and five), some water molecules may even be part of two solvation shells. If we now focus on the structure of the hydrogen-bond network in this solution, it becomes clear that it must consist roughly of water molecules that are hydrogen-bonded to one urea molecule and three water molecules. A priori one would expect this type of binding to result in a severe distortion of the tetrahedral structure of bulk water. The reorientation time of 2.5 ps, however, indicates that the water structure around urea is, in essence, undistorted. A possible explanation for this lack of distortion can be found in the way urea fits in the hydrogen-bond network of liquid water (7). Urea has the right size to substitute for a water dimer in the hydrogen-bond network. Apparently, the molecule can reform the six hydrogen bonds that existed between the water dimer and the neighboring water molecules, so that no significant network rearrangements are needed to solvate urea.
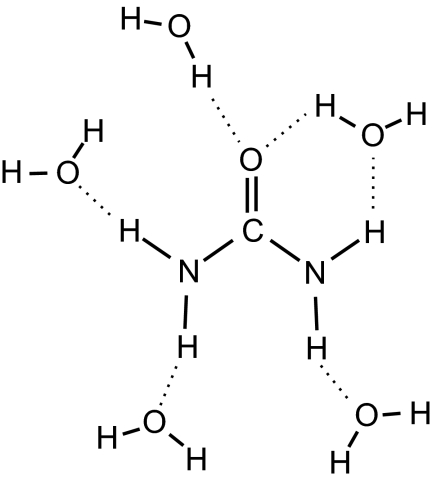
Our pump-probe measurements provide strong evidence that a small fraction of the water molecules is strongly immobilized by urea. From the mole fractions of urea and water we estimate that about one water hydroxyl group per urea molecule is immobilized (τrot > 15 ps). It is likely that these molecules are strongly associated with urea and form specific urea–water complexes. Quantum chemical calculations (23) demonstrate that a water molecule has exactly the right size to engage in two simultaneous hydrogen bonds with urea: one hydrogen bond is donated to the carbonyl oxygen of urea, and another hydrogen bond is accepted from the cis-hydrogen. Such a doubly hydrogen-bonded water molecule is expected to reside in the hydration shell of urea for a relatively long time and is thus likely to cause the slow component observed in the anisotropy. Fig. 5 shows a solvation structure of urea as it arises from our experiments.
Fig. 5.
Solvation structure of the urea molecule from our experiments. One of the water molecules in the solvation shell shares two hydrogen bonds with urea.
Finally, we would like to discuss the possible role of urea in protein denaturation. The explanations for protein denaturation that are found in the literature follow two distinct viewpoints, which can be traced back to two models from the 1960s. The first viewpoint (14) assumes that urea acts on a protein indirectly, by modifying the hydrogen-bond structure of water and thus perturbing water-mediated hydrophobic interactions. The second viewpoint (24–26) is based on a direct mechanism in which urea cooperates with water in the solvation of amino acid residues. In this model the weakening of hydrophobic interactions occurs because urea is more effective than water in solvating hydrophobic residues. As our experiments show that urea has a negligible effect on the hydrogen-bond structure of water, we can rule out the first (i.e., the indirect) mechanism as an explanation for protein denaturation by aqueous urea, and we are left with the hypothesis that urea is effective in solvating the hydrophobic residues of a protein (15).
In conclusion, we have presented measurements of the orientational dynamics of water molecules in mixtures of water and urea. We observed that even high concentrations of urea do not alter the reorientation time of the majority of the water molecules. From this observation we conclude that urea does not change the strength of the hydrogen-bond interactions between water molecules. A small fraction of the water molecules is, however, strongly immobilized by urea. A likely explanation is that these water molecules are engaged in specific urea–water complexes, in which two hydrogen bonds are shared by water and urea.
Materials and Methods
The samples used for our experiments are 8% solutions of HDO in H2O to which up to 8 M of urea had been added. The mid-infrared pump-probe measurements were carried out in a static cell with an optical path length of ≈25 μm.
Our laser system consisted of a commercial Ti:sapphire regenerative amplifier that delivers 800-nm pulses with a duration of 100 fs and an energy of 1 mJ. This light was used to pump an optical parametric amplifier (OPA) based on β-barium borate (BBO). The OPA was tuned to produce idler pulses with a wavelength of 2.0 μm. These pulses were frequency doubled in a second BBO crystal and subsequently difference-frequency mixed with the residual 800-nm light from the OPA, in a KNbO3 crystal. This process yielded mid-infrared pulses that were resonant with the OD-stretch vibration, having a duration of 150 fs, a wavelength of 4 μm, and an energy of a few microjoules.
The mid-infrared light was coupled into a pump-probe setup. A small fraction of the light was split off by a wedged CaF2 window to obtain probe and reference pulses. The transmitted light formed the pump beam, and with a λ/2 plate, its polarization was set to 45° with respect to that of the probe beam. The pump, probe, and reference beams were focused onto the sample by an off-axis parabolic mirror and recollimated by an identical mirror that was placed after the sample. The probe and reference beams were focused onto the entrance slit of a spectrometer, which dispersed the beams onto a 2 × 32 liquid-nitrogen-cooled mercury-cadmium-telluride array. Before entering the spectrometer, the probe beam passed through a polarizer, allowing the selection of either its parallel or perpendicular polarization component with respect to the pump polarization. This selection results in the transient absorptions Δα‖(ω,t) and Δα⊥(ω,t), respectively. These two signals are initially different because of the preferential excitation of HDO molecules that have their OD groups aligned parallel to the pump polarization. As the delay between the pump and probe pulses increases, molecular reorientation causes the molecules to lose memory of their initial orientation, and the difference between the two signals vanishes. The normalized difference between the parallel and perpendicular absorption changes is called the anisotropy,
and the decay of this quantity reflects the molecular reorientation. The isotropic signal,
was constructed in such a way that it was free of reorientational processes and reflects the decay of the excitation by vibrational relaxation.
Acknowledgments
This work is part of the research program of the Stichting voor Fundamenteel Onderzoek der Materie, which is financially supported by the Nederlandse Organisatie voor Wetenschappelijk Onderzoek.
Footnotes
The authors declare no conflict of interest.
This article is a PNAS direct submission.
References
- 1.Beauregard DV, Barret RE. J Chem Phys. 1968;49:5241–5244. [Google Scholar]
- 2.Walrafen GE. J Chem Phys. 1966;44:3726–3727. [Google Scholar]
- 3.Barone G, Rizzo E, Vitigliano V. J Phys Chem. 1970;74:2230–2232. [Google Scholar]
- 4.Finer EG, Franks F, Tait MJ. J Am Chem Soc. 1972;94:4424–4429. [Google Scholar]
- 5.Kaatze U, Gerke H, Pottel R. J Phys Chem. 1986;90:5464–5469. [Google Scholar]
- 6.Shimizu A, Fumino K, Yukiyasu K, Taniguchi Y. J Mol Liq. 2000;85:269–278. [Google Scholar]
- 7.Soper AK, Castner EW, Luzar A. Biophys Chem. 2003;105:649–666. doi: 10.1016/s0301-4622(03)00095-4. [DOI] [PubMed] [Google Scholar]
- 8.Idrissi A, Bartolini P, Ricci M, Righini R. J Chem Phys. 2001;114:6774–6780. [Google Scholar]
- 9.Astrand PO, Wallqvist A, Karlstrom G. J Phys Chem. 1994;98:8224–8233. [Google Scholar]
- 10.Vanzi F, Madan B, Sharp K. J Am Chem Soc. 1998;120:10748–10753. [Google Scholar]
- 11.Kallies B. Phys Chem Chem Phys. 2002;4:86–95. [Google Scholar]
- 12.Ishida T, Rossky PJ, Castner EW. J Phys Chem B. 2004;108:17583–17590. [Google Scholar]
- 13.Idrissi A. Spectrochim Acta A. 2005;61:1–17. doi: 10.1016/j.saa.2004.02.039. [DOI] [PubMed] [Google Scholar]
- 14.Frank HS, Franks F. J Chem Phys. 1968;48:4746–4757. [Google Scholar]
- 15.Sharp KA, Madan B, Manas E, Vanderkooi JM. J Chem Phys. 2001;114:1791–1796. [Google Scholar]
- 16.Loparo JJ, Fecko CJ, Eaves JD, Roberts ST, Tokmakoff A. Phys Rev B. 2004;70:180201. [Google Scholar]
- 17.Steinel T, Asbury JB, Zheng J, Fayer MD. J Phys Chem A. 2004;108:10957–10964. doi: 10.1021/jp046711r. [DOI] [PMC free article] [PubMed] [Google Scholar]
- 18.Rezus YLA, Bakker HJ. J Chem Phys. 2005;123:114502. doi: 10.1063/1.2009729. [DOI] [PubMed] [Google Scholar]
- 19.Piletic IR, Moilanen DE, Spry DB, Levinger NE, Fayer MD. J Phys Chem A. 2006;110:4985–4999. doi: 10.1021/jp061065c. [DOI] [PubMed] [Google Scholar]
- 20.Godralla BC, Zeidler MD. Mol Phys. 1986;59:817–828. [Google Scholar]
- 21.Hardy EH, Zygar A, Zeidler MD, Holz M, Sacher FD. J Chem Phys. 2001;114:3174–3181. [Google Scholar]
- 22.Idrissi A, Sokolic F, Perera A. J Chem Phys. 2000;112:9479–9488. [Google Scholar]
- 23.Lee C, Stahlberg EA, Fitzgerald G. J Phys Chem. 1995;99:17737–17741. [Google Scholar]
- 24.Shellman JA. C R Trav Lab Carlsberg. 1955;29:223–229. [PubMed] [Google Scholar]
- 25.Kreschek GC, Scheraga HA. J Phys Chem. 1965;69:1704–1706. [Google Scholar]
- 26.Stokes RH. Aust J Chem. 1967;20:2087–2100. [Google Scholar]


