Abstract
The dipole potential of a lipid bilayer membrane accounts for its much larger permeability to anions than cations and affects the conformation and function of membrane proteins. The absolute value of the dipole potential has been very difficult to measure, although its value has been estimated to range from 200 to 1,000 mV from ion translocation rates, the surface potential of lipid monolayers, and molecular dynamics calculations. Here, a point charge probe method was used to investigate the dipole potentials of both ester and ether lipid membranes. The interactions between electrons and lipid molecules were recorded by phase-contrast imaging using cryo-EM. The magnitude and the profile of the dipole potential along the bilayer normal were obtained by subtracting the contribution of the atomic potential from the cryo-EM image intensity. The peak dipole potential was estimated to be 510 and 260 mV for diphytanoylphosphatidylcholine and diphytanylphosphatidylcholine, respectively.
Keywords: liposome, phospholipid, atomic potential, electron-phase shift, molecular dynamics
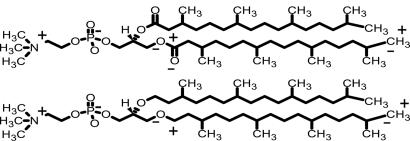
Negatively charged molecules diffuse across phospholipid membranes with great ease when compared with positively charged ones (1). For example, the tetraphenylborate anion (TPB−) has a permeability ≈3 × 10⁷ larger than the identically sized tetraphenylarsonium cation (TPA+) in membranes formed from the neutral lipid phosphatidylcholine (2). A remarkably large positive electrostatic potential in the interior of the membrane accounts for much of this permeability difference. The size of this potential is influenced little by the charge or nature of the polar headgroups, but is thought mainly to arise from the dipole moment of the ester linkage of the hydrocarbon chains (Fig. 1) (3). Beside the translocation rates of ions across lipid membranes, this dipole potential affects the structure and function of membrane-incorporated proteins such as a model amphiphilic peptide (4), gramicidin A (5, 6), and phospholipase A (7). It has also been suggested that the dipole potential may play a role in the function and conformation of proteins in lipid rafts, where the dipole potential is different from surrounding lipids because of associated sterols within the raft structure (8).
Fig. 1.
The chemical structures of ester-DPhPC (Upper) and ether-DPhPC (Lower). The main partial charges contributing to the dipole potential are labeled as + and − on one chain of each lipid.
The absolute value of the dipole potential has been very difficult to measure or predict, and estimates obtained from various methods range from +200 to +1,000 mV (Table 1). One experimental method, the bilayer method, relies on the assumption that the thermodynamic properties of TPA+ and TPB− are identical, except for their charges. In this case the ratio of permeabilities directly yields an estimate of ≈230 mV for the peak dipole potential in a phosphatidylcholine membrane. A relaxation of the assumption of identical properties (9, 10), in particular taking into account the smaller hydration energy of TPB− (11) yields estimates for the dipole potential that are ≈100 mV larger (Table 1, Bilayer + ΔGhydr values).
Table 1.
Phosphatidylcholine (PC) membrane dipole potentials in mV, obtained by various methods
| Method | PC (Ester) | PC (Ether) | Notes |
|---|---|---|---|
| Bilayer | 227 ± 9 (32) | 109 ± 6 (32) | DPPC (16:0 PC) |
| 243 ± 4 (31) | 114 ± 7 (31) | ||
| 228 ± 5 (31) | DPhPC (4ME 16:0 PC) | ||
| Bilayer + ΔGhydr* | 346 (11) | 228 (11) | DPPC (16:0 PC) |
| Monolayer | 449 (43) | 359 (43) | DMPC (14:0 PC) |
| MD simulation | 950 (44) | DMPC (14:0 PC); CHARMM (all-atom) 512 lipids | |
| 1,002 (17) | 567 (17) | DPhPC (4ME 16:0 PC); CHARMM (all-atom) 72 lipids | |
| 600 (45) | DPPC (16:0 PC); AMBER (united-atom) 64 lipids | ||
| 557 (46) | DPPC (16:0 PC); GROMACS 256 lipids | ||
| 500 (47) | DOPC (18:1 PC); GROMOS (united-atom) 128 lipids | ||
| Cryo-EM | 510 (this work) | 260 (this work) | DPhPC (4ME 16:0 PC) |
Citations are indicated by numbers in parentheses. DP, dipalmitoyl; DPh, diphytanoyl; DM, dimrystoyl; ME, methyl.
*ΔGhydr is the correction made to account for the hydration energy difference between TPA+ and TPB−.
In the lipid monolayer method, an “air electrode” is used to measure the potential above a lipid monolayer spread on an air–water interface. The difference between this potential and that of the bare air–water interface is taken to be a measure of the dipole potential, yielding values ≈450 mV. Unfortunately, it is not known what the absolute size of the air–water potential difference is, and whether the subtraction of this potential is justified. Voltage-sensitive dyes have also been used as probes for dipole potentials, indicating changes in the dipole potential as the dopants phloretin and 6-ketocholestanol decrease or increase the dipole potential, respectively (4, 12, 13). Unfortunately, the dyes have not provided measurements of the absolute magnitude of the dipole potential. Considered together, the existing experimental methods leave a very large uncertainty, 100–200 mV in size, in the value of the dipole potential (14).
Molecular dynamics (MD) calculations can predict the size and spatial dependence of the dipole potential. MD simulations have been quite successful in reproducing the structure of lipid bilayers, as measured with x-ray and neutron scattering (15, 16). However, MD predictions of electrostatic details are less reliable, because the models only use point charges and do not allow for the polarization of atoms and bonds in response to electric fields. MD simulations using the all-atom (including explicit hydrogens) CHARMM models yield peak dipole potentials of ≈1,000 mV, whereas the united-atom AMBER and GROMOS models yield peak potentials of 500–600 mV. It is interesting to note that both experiments and MD simulations yield much smaller dipole potentials for phospholipids with an ether linkage than those with a conventional ester linkage (Table 1).
A direct measurement of dipole potentials in a lipid bilayer membrane would use point charge probes instead of large hydrophobic ions or voltage-sensitive dye molecules. During our attempts to develop a quantitative model for the images of liposomes embedded in vitreous ice using cryo-EM, we found that a dipole potential can make a substantial contribution to the images. Thus we propose to record the phase shift of electrons, as they pass through regions with different electrostatic potentials in rapidly frozen phospholipid bilayers, to provide an estimate of the dipole potential.
In the experiments described here we use two lipids that are expected to yield very different dipole potentials (Fig. 1). The branched-chain lipid diphytanoyl phosphatidylcholine (ester-DPhPC) forms robust membranes in artificial systems; it and its ether analogue, diphytanyl phosphatidylcholine (ether-DPhPC) were the objects of a recent MD simulation (17), which we use as a benchmark and structural reference for our study.
In materials science two methods have been used to measure electrostatic potentials from electron-phase shifts in the electron microscope. Electron holography is an interference technique, in which an object electron-wave (which has passed through the sample) is compared with a reference wave (which has passed through vacuum). The interference allows the absolute phase shift of the object wave to be determined with high precision (18–20). However, the required specimen geometry, with a reference path displaced only tens of nanometers from the object-beam path, is not practical for cryo-EM images of membranes. A second method is Fresnel contrast analysis (21) where the positions of interference fringes are analyzed as the microscope focus is varied, yielding precise fits to models of the spatial variation in potential. Unfortunately, the radiation sensitivity of biological molecules precludes the acquisition of defocus series from a single specimen. Instead, we use here single images obtained with the bright-field, phase-contrast imaging that is commonly used for cryo-EM specimens. To provide a quantitative calibration of our images, we rely on structural information from MD simulations.
In cryo-EM, the primary mechanism for image contrast is the phase shift in the electron-wave function (elastic scattering) as it passes through the specimen. The total phase shift is proportional to the integrated electrostatic potential (the projected potential) along the path of the electron. The intensity of the recorded image is expected to vary in proportion to the phase shift when the weak phase object approximation is used for defocused imaging (22). Thus the recorded image intensity is a reflection of the electrostatic potential of the specimen. For isolated, neutral atoms, the electrostatic potential of the specimen is the linear superposition of the shielded coulomb potential of the atoms (the atomic potential). When bonds are formed between atoms, the outer valence electrons rearrange themselves, and additional electrostatic potentials arise from the resulting charge displacements. Zhong et al. (23) have shown that high-resolution cryo-EM data are better described when molecular bonding effects are taken into consideration. However, for the low-resolution data considered here we will assume that the projected potential is simply the superposition of the atomic potential and any additional electrostatic potentials.
Results
We recorded cryo-EM images of highly spherical, osmotically swollen liposomes with diameters of 500–1,000 Å trapped in a layer of vitreous ice of 1,000- to 1,500-Å thickness.
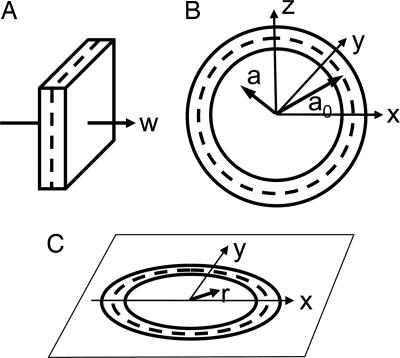
For comparison with experimental images, we started with a model of a planar membrane, computing the projected potential and therefore the elastic scattering profile γ(w) for electron paths parallel to the membrane. We then modeled a spherical vesicle membrane (Fig. 2) by assuming the same scattering profile γ(a − a0) along the radial direction a for a vesicle of nominal radius a0. Finally, to construct the 2D image, we computed the projection along the z axis to obtain the projected scattering profile Γ(r).
Fig. 2.
Coordinate systems for the modeling of vesicle membranes. (A) The scattering profile γ(w) of a planar membrane. (B) A slice of the spherical profile γ(a −a0), where a0 is the nominal vesicle radius. (C) The projected scattering density, described in polar coordinates as Γ(r).
The planar membrane model was based on an MD simulation by Shinoda et al. (17). In their work the membrane consisted of 72 ester-DPhPC molecules in a periodic box that also contained 2,088 water molecules. From a 10-ns simulation of the system at 298 K was obtained the time-averaged density ρi(w) (units of Å−3) of each atom type as a function of the location w along the membrane normal; for example, far from the membrane the density of water molecules was 0.0334 Å−3, which corresponds to a water density of 1.0 g/cm3.
From the atom density we computed the neutral-atom phase shift γn (units of mrad/Å), which we also call the scattering profile, according to:
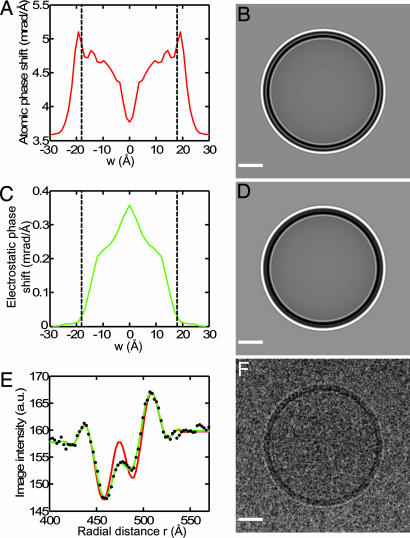
Here Vi is the spatially integrated, shielded coulomb potential for an isolated, neutral atom [Vi = 25, 130, 108, 97, and 267 V·Å3 for hydrogen, carbon, nitrogen, oxygen, and phosphorous, respectively, calculated from published parameters (22)]; and the interaction parameter σe describes the first-order dependence of electron phase on projected potential (0.73 mrad/V·Å for 200 keV electrons) (22). The resulting function (Fig. 3A) shows that an electron passing near the phospholipid headgroups (w = ±20 Å) would experience a phase shift of ≈5 mrad per Å of electron path length. At the center of the bilayer (w = 0) the atomic phase shift is 3.7 mrad/Å, about the same as the value for the water outside of the membrane.
Fig. 3.
Modeling the image of a phospholipid vesicle. (A) Atomic phase-shift profile of an ester-DPhPC bilayer, computed from Eq. 1. Dashed lines indicate the approximate boundary of the headgroup region, at w = ±18 Å. (B) Simulated image of a spherical vesicle of radius 470 Å having the profile of A. (C) Profile of phase shift from electrostatic potential within an ester-DPhPC membrane. The potentials from an MD simulation (17) were scaled to a peak value of 500 mV and converted to electron phase shift. (D) Computed image from the sum of contributions from the atomic potential A and the electrostatic potential C. Note the less-prominent ring in the center of the membrane image. (E) The circularly averaged, experimental image intensity (black dots) is compared with fits by the atomic potential alone (red curve) and the sum of atomic potential and dipole potential (green curve). The latter accounts for the experimental points very well. (F) The experimental image, Gaussian-filtered (half power at 1/24 Å−1) for display. The image was acquired with defocus 2.45 μm, and the fitted B factor was 274 Å2; the same parameters were used in the simulations. (Scale bars: B, D, and F, 200 Å.)
From this model we computed the image of a spherical membrane vesicle, as it would appear in projection in the electron microscope (Fig. 3B). The complicated profile comes from the contrast-transfer function (CTF) of the imaging system. The modeling of the CTF is described in Materials and Methods.
The MD simulation of Shinoda et al. (17) also provides an estimate of the time-averaged electrostatic potential φ throughout the ester-DPhPC bilayer membrane. Fig. 3C shows the expected electron phase shift γφ(w) = σeφ(w), when φ(w) is scaled to have a maximum value of 500 mV. When γφ is added to the atomic phase shift, the simulated image has a less prominent central ring (Fig. 3D) as the peak of dipole potential compensates partially for the central dip in the atomic phase shift. The effect is clearly seen in comparison with an actual cryo-EM image of a DPhPC vesicle. The atomic phase shift alone (Fig. 3E, red curve) deviates strongly from the observed image intensity, whereas the sum of atomic and dipole-potential phase shift describes the observed image intensity well.
For a more informative comparison of models with experimental images, we derived the scattering profile of a slice of membrane directly from the experimental images. This was done through application of the Fourier slice theorem and the Hankel transform (24–26) to the rotationally averaged intensity of an image. The resulting profile can then be compared directly with the scattering profile of a membrane.
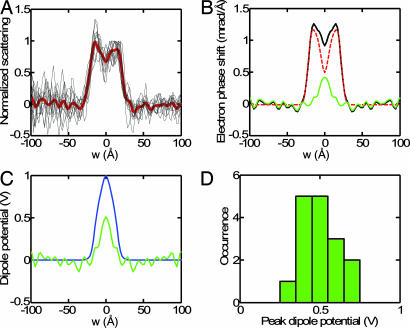
The scattering profiles of ester-DPhPC membranes, computed in this way from 16 images of individual vesicles, are shown in Fig. 4A. Each individual membrane profile shows a consistent thickness of the bilayer membrane and a dip at the bilayer center. The FWHM is 44 Å, close to the steric thickness of a dipalmitoyl phosphatidylcholine (DPPC) membrane, 46 Å (16, 27, 28). The mean profile (red curve in Fig. 4A) shows a higher peak density at negative values of w, corresponding to the inner leaflet of the vesicle membrane. The slightly higher density is expected from the crowding of headgroups in this leaflet because of the membrane curvature. For further analysis, involving comparison with a planar membrane, we made an approximate correction for this effect by symmetrizing the profile.
Fig. 4.
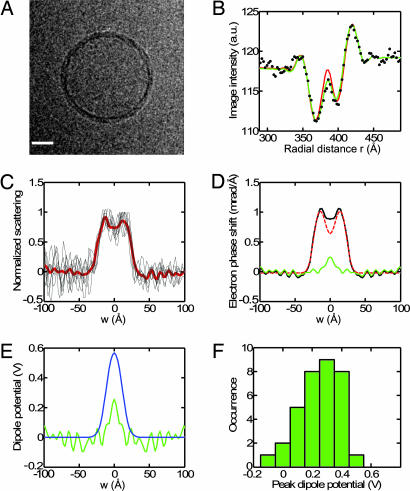
Cross-sectional profiles of ester-DPhPC lipid vesicles. (A) Individual membrane profiles γest(w) are shown aligned and superimposed, with the mean indicated in red. (B) Model fitting. The solid black curve is the averaged and symmetrized membrane profile. It is scaled to match the atomic phase shift from Eq. 1 (red dashed curve), which has been shifted to make the baseline zero and convolved with a Gaussian function of 3-Å width. The green curve is the residual, taken to be the dipole potential phase shift. (C) Comparison of dipole potential profiles from the cryo-EM method (green curve) and MD simulation (blue curve, after convolution with the 3-Å Gaussian). (D) Histogram of peak dipole potentials obtained from fitting models to the image densities from 16 vesicles.
A quantitative analysis of the scattering profile is possible if an absolute calibration can be applied. We assume that the profile arises from the sum of atomic scattering and the effect of the dipole potential, both of which are possibly smeared out because of membrane undulations and vesicle shapes that are not perfectly spherical. From MD simulations of DPPC and DPhPC lipid bilayers (17, 29), it is clear that the dipole potential is confined to the hydrocarbon core and is very small at distances > 18 Å from the membrane center (Fig. 3C). This is because, in the headgroup region, the mobile dipoles of water molecules cancel any large electric fields. In the vicinity of the peak atomic scattering at w ≈ ±20 Å, therefore, there is essentially no contribution from electrostatic potentials. We scaled the experimental profile to match the atomic scattering profile in this region, thus providing an absolute scale. The fit shown in Fig. 4B (red dashed curve) used an atomic scattering profile that was convolved with a Gaussian distribution (3-Å standard deviation) to account for the more gradual slope in the experimental profile, which presumably arose from deviations from ideal spherical geometry of the vesicles.
After subtraction of the contribution caused by the atomic potential, the contribution caused by the dipole potential was obtained; it is shown as the green curve in Fig. 4B and is magnified in Fig. 4C. Compared with the potential computed in the MD simulation, the experimental dipole-potential profile has a similar shape, although large noise fluctuations are present. It is smaller in amplitude, having a peak value of ≈500 mV. The peak dipole potential estimated in this way from 16 vesicle images was 510 ± 70 mV (Fig. 4D). Compared with values obtained from other methods for ester-DPhPC (Table 1), our value is smaller than that in MD simulations, but larger than that in both bilayer and monolayer measurements.
Ether-linked phospholipids form membranes with dipole potentials that are much smaller, only half the size than their ester counterparts, according to bilayer measurements and MD simulations (Table 1). As a test of our approach, we repeated our analysis for vesicles formed from ether-DPhPC (Fig. 5). The computed membrane profiles showed more broadening (smoothing with a Gaussian of 5.5-Å standard deviation was required to fit them) and a smaller central dip (Fig. 5 C and D). A substantial dipole potential term was nevertheless required to fit the profile, with a peak value of 260 ± 130 mV from 34 vesicle images (Fig. 5F).
Fig. 5.
Cross-sectional profiles and dipole potentials in ether-DPhPC vesicles. (A) Cryo-EM image of a 750-Å vesicle, Gaussian filtered (1/24 Å−1) for display. Defocus was estimated at 2.34 μm and B = 234 Å2. (Scale bar: 200 Å.) (B) Circularly averaged, experimental image intensity (dots) is compared with the atomic potential alone (red curve), and atomic potential plus dipole potential (green curve). (C) Membrane profiles γest(w) computed from 34 individual vesicles are shown aligned and superimposed with the mean indicated in red. (D) Model fitting. The solid black curve is the averaged and symmetrized membrane profile. It is scaled to match the atomic phase shift from Eq. 1 (red curve), convolved with a Gaussian function of 5.5-Å width. The green curve is the residual, taken to be the dipole potential phase shift. (E) Comparison of dipole potential profiles from the cryo-EM method (green curve) and MD simulation (blue curve). (F) Histogram of peak dipole potentials, obtained by model fitting to 34 vesicles.
Discussion
The direct measurement of the dipole potential of lipid bilayer membranes has been called an “impossible” experiment (14). To the various experimental techniques that nevertheless have been used to estimate it, we now add the use of cryo-EM imaging. This method has the substantial advantages that it uses electrons as probes, and it can provide information about the spatial profile of the electrostatic potential. The method has drawbacks in that it has low sensitivity (the random error in a measurement from one membrane vesicle is on the order of 100 mV) and, of course, its use rests on a number of assumptions. The first assumption is that the rapidly frozen specimen, imaged at liquid–nitrogen temperature, preserves the electrostatic features of the native structure. It is to be expected that the lipid bilayer structure remains intact during the rapid freezing, which occurs at ≈106 K/s (30) and vitrifies water. However, the cooling might be slow enough to allow some redistribution of water that has penetrated into the membrane, changing the degree of electrostatic shielding provided by the water dipoles.
The second assumption is that we have used a proper model for the phase-contrast imaging process. The refinement of these models is still an area of research. As it is, we have used the traditional first-order model for electron elastic scattering, including an added amplitude-contrast term, but have also investigated variations in the form of the CTF (see Fig. 7 and Supporting Text, which are published as supporting information on the PNAS web site). Third, we neglect radiation damage. Our images are taken under standard “low-dose” conditions, but from cryo-EM studies of viruses and 2D crystals it is known that high-resolution details are lost at these doses. Finally, we have relied heavily on structural data from MD simulations to calibrate our measurements.
As for the magnitude of the peak dipole potential, our estimate for ester-phosphatidylcholine (510 mV) is 280 mV higher than that from bilayer measurement, is not far from the value obtained from a monolayer measurement (440 mV; E. A. Disalvo, personal communication), and is about half the value obtained from the all-atom MD simulations (Table 1). The large discrepancy with the MD result is not entirely surprising, as the MD simulations do not include polarizability of the atomic charges and therefore may underestimate the shielding by induced dipoles in the molecular system. The peak dipole potential of the ether-DPhPC membrane was about half that of the ester lipid, a phenomenon that is seen in both an MD study (17) and bilayer-transport experiments where ester and ether phosphatidylcholine lipids are compared (31, 32).
It is remarkable that a cryo-EM image of a lipid membrane is influenced significantly by electrostatic potentials. We wonder whether cryo-EM may turn out to be a useful tool for the examination of the electrostatics of other biological structures as well.
Materials and Methods
Vesicle Formation.
Ester- and ether-DPhPC (Avanti, Alabaster, AL) were used as received. The lipids were hydrated in Hepes-buffered KCl solution (135 mM KCl/5 mM NaCl/1 mM EDTA/10 mM Hepes, pH 7.4) to a concentration of 4 mg/ml, frozen and thawed 10 times, and extruded through an 80-nm polycarbonate membrane filter (Whatman, Middlesex, UK) using a Lipex extruder (Northern Lipids Inc., Vancouver, Canada) (33). To obtain highly spherical vesicles, we swelled them by repeated osmotic shocks, adding water to the vesicle suspension (11%, 14%, 18%, 24%, and 33% of the original volume) at 1-h intervals at room temperature.
Cryo-EM Imaging.
A holey carbon film was formed by the microcontact printing method (K. G. Klemic and D. A. Chester, personal communication) on the polished “front” side of copper–palladium grids (Ted Pella, Redding, CA). Before use, the grids were glow-discharged in air for 45 s on each side. Six microliters of the swollen vesicle suspension was loaded onto the front side and blotted from the back side for 3–6 s with a slip of filter paper (Whatman). The specimen was rapidly frozen by plunging into liquid ethane and stored in liquid nitrogen. Images of vesicles within the holes in the carbon film were obtained by using a Tecnai F20 electron microscope (FEI, Hillsboro, OR) at 200 keV with 20- or 30-μm objective apertures. The dose for each exposure was ≈20 e/Å2. Images were taken at 45,000 or 50,000 magnification and 2.0- to 3.3-μm defocus and recorded on SO-163 film (Kodak, Rochester, NY). This level of defocus was chosen because in simulations a defocus of 2.5 μm gave the largest sensitivity to variations of electron scattering in the membrane interior. Negatives were scanned with a SCAI film scanner (Zeiss, Thornwood, NY) to an effective pixel size b = 2.4 Å. Estimates of the defocus and other parameters of the CTF were obtained by fits to image power spectra from the carbon surrounding the holes, under the assumption that the amorphous carbon is a random object with constant structure factor magnitudes in the spatial frequency range of 1/30 to 1/10 Å−1.
Models of Image Formation.
Given the assumed scattering density γ(a − a0) of a spherical membrane, the projection onto two dimensions of this density is obtained by integrating along the z direction (Fig. 2). This integral can be written as:
 |
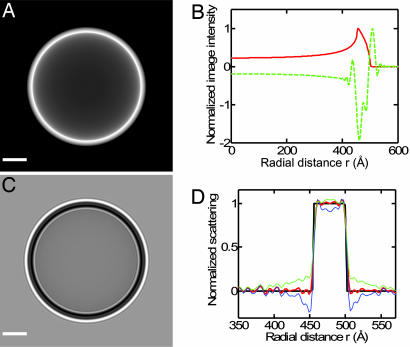
where r is the distance from the center of the projected image. An example of such a projection is shown in Fig. 6A, and its radial dependence Γ(r) is shown as the red curve in Fig. 6B.
Fig. 6.
Tests for the reliability of the profile computation and systematic fitting errors. (A) Projection image of a model vesicle with a rectangular membrane profile. (B) Rotationally averaged image intensity corresponding to A (red curve) and C (green dashed curve). (C) Simulated image, obtained from A assuming the contrast transfer function (Eq. 5) with a defocus Δz = 2.4 μm and B = 300 Å2. (D) Comparison between the original (black line) and reconstructed (red line) membrane profile after inverse filtering and Hankel transform. This reconstruction from noiseless data matches the original profile well. Blue and green curves show the effects of changing the value of the CTF parameter Q in the simulation, but not in the reconstruction, by +0.05 and −0.03, respectively. (Scale bar: A and C, 200 Å.)
In the transmission electron microscope, phase contrast is obtained by focusing the objective lens on a plane at a distance Δz above the specimen. At this plane the additional phase shift χ of scattered electron waves varies with the spatial frequency according to:
where λ is the wavelength of the imaging electrons and s is the 2D spatial-frequency variable. (Here we ignore higher-order dependences on s, in view of the limited resolution of our data with |S| ≤ 1/9 Å). The recorded image intensity shows small variations about a constant value I0. In the weak-phase approximation these variations are proportional to the structure factor f(s) [the Fourier transform of the scattering density Γ(r)] according to:
where m is an unknown scaling factor, and c(s) is the CTF typically (34) expressed as:
The sin(χ) term represents the image contrast arising from electron phase shifts Γ(r) in the specimen. There is also a small amplitude-contrast contribution to the image, modeled as being proportional to Γ(r), which is represented by the cosine term. The values of the parameters Δz, B, and Q were obtained from fitting image power spectra as described above. We estimate the fitting uncertainty of Δz and B to be ±50 nm and ±50 Å2, respectively, similar to the uncertainty observed by others (35–37). Fitted values of Q clustered around the value 0.075, which we used for all images; reported values of Q lie in the range of 0.05 to 0.10 (36, 38, 39).
Computing the Membrane Profile.
Extraction of the membrane profile along the bilayer normal is the inverse (24, 26, 40) of the projection operation of Eq. 2 and made use of the Fourier slice theorem. Starting with N × N-pixel images (typically N = 600), each selected to contain a particularly round vesicle, a correction for the CTF was applied in the form of an approximate inverse filter. The transfer function H(s) of this filter was chosen to remove the worst image distortions because of the CTF but was truncated to avoid amplification of noise at high frequencies (41) and in the vicinity of the zeros of c(s),
The highest spatial frequencies that were amplified by this filter were in the range 1/9 to 1/11 Å−1. Its effect is similar to that of a Wiener filter, but has the advantage that it is an exact inverse filter at low frequencies (below the first zero of the CTF), which is important in preserving the shape of the membrane profile. It has the disadvantage that the noise at its output is not minimized.
After each image was filtered, the vesicle center was determined with subpixel accuracy through fitting with a model image. The circular average of the intensity was then computed, like that shown in Fig. 3E, and Fourier-transformed to yield the 1D, experimental structure factor f(s). Here s takes integer values corresponding to spatial frequency units of 1/Nb. The profile of a slice through the spherical vesicle was then obtained by the Hankel transform (42),
 |
where J0 is a Bessel function of the first kind and a is the radius in the spherical coordinate system (Fig. 2) in units of the pixel size b. For comparison with theoretical profiles, ξ was shifted and scaled to bring the baseline value to zero and the maximum value to unity. The estimated profile of a planar membrane was then obtained as γest(w) = ξ(w + a0) with the nominal vesicle radius a0 chosen to place the central dip of γest at w = 0, which yielded the curves shown in Figs. 4A and 5C.
A major concern was whether the combination of the CTF of the electron microscope and the inverse filter of Eq. 6 results in artifacts in computing the membrane profile. Fig. 6 shows a test of this processing. A 3D vesicle model was built with a rectangular pulse as the membrane profile. Its projection image before and after modification by the CTF is shown in Fig. 6 A and C; the rotationally averaged intensity profile is shown in Fig. 6B. The image of Fig. 6C was processed in the same way as the cryo-EM data, and the computed membrane profile ξ(a) is seen to agree well with the original profile (Fig. 6D), showing the quality of the reconstruction.
With this model system we also tested variations in the parameters and form of the CTF. The correct value of Q leads to a flat scattering profile in the “solvent” outside the simulated membrane, whereas errors produce an overshoot or undershoot of density, as demonstrated by the green and blue curves in Fig. 6D. The flatness of the water density in Figs. 4B and 5D increases our confidence in the value of Q that was used in the image analysis. Other tests, described in Supporting Text, suggest that other uncertainties in the CTF yield errors that at most are comparable to the random uncertainty in the fitted peak dipole potential, which was ≈70 mV.
Supplementary Material
Acknowledgments
We thank Dr. Wataru Shinoda (Research Institute for Computational Sciences, Ibaraki, Japan) for providing the atom densities and potentials from his MD simulations of ester- and ether-DPhPC membranes; Dr. Jonathan Sachs for helpful discussions; and Drs. David Chester, Thomas Woolf, Stephen White, and Edgardo A. Disalvo. This work was supported by National Institutes of Health Grant NS21501 (to F.J.S.).
Abbreviations
- MD
molecular dynamics
- ester-DPhPC
diphytanoylphosphatidylcholine
- ether-DPhPC
diphytanylphosphatidylcholine
- DPPC
dipalmitoylphosphatidylcholine
- CTF
contrast-transfer function
Footnotes
The authors declare no conflict of interest.
References
- 1.Liberman EA, Topaly VP. Biofizika. 1969;14:452–461. [PubMed] [Google Scholar]
- 2.Pickar AD, Benz R. J Membr Biol. 1978;44:353. [Google Scholar]
- 3.Brockman H. Chem Phys Lipids. 1994;73:57–79. doi: 10.1016/0009-3084(94)90174-0. [DOI] [PubMed] [Google Scholar]
- 4.Cladera J, O'Shea P. Biophys. 1998;74:2434–2442. doi: 10.1016/S0006-3495(98)77951-2. [DOI] [PMC free article] [PubMed] [Google Scholar]
- 5.Rokitskaya TI, Antonenko YN, Kotova EA. Biophys J. 1997;73:850–854. doi: 10.1016/S0006-3495(97)78117-7. [DOI] [PMC free article] [PubMed] [Google Scholar]
- 6.Thompson N, Thompson G, Cole CD, Cotten M, Cross TA, Busath DD. Biophys J. 2001;81:1245–1254. doi: 10.1016/S0006-3495(01)75782-7. [DOI] [PMC free article] [PubMed] [Google Scholar]
- 7.Maggio B. J Lipid Res. 1999;40:930–939. [PubMed] [Google Scholar]
- 8.O'Shea P. Philos Trans R Soc London A. 2005;363:575–588. doi: 10.1098/rsta.2004.1509. [DOI] [PubMed] [Google Scholar]
- 9.Stangret J, Kamienska-Piotrowicz E. J Chem Soc-Faraday Trans. 1997;93:3463–3466. [Google Scholar]
- 10.Coetzee JF, Sharpe WR. J Phys Chem. 1971;75:3141–3146. [Google Scholar]
- 11.Schamberger J, Clarke RJ. Biophys J. 2002;82:3081–3088. doi: 10.1016/S0006-3495(02)75649-X. [DOI] [PMC free article] [PubMed] [Google Scholar]
- 12.Klymchenko AS, Duportail G, Mely Y, Demchenko AP. Proc Natl Acad Sci USA. 2003;100:11219–11224. doi: 10.1073/pnas.1934603100. [DOI] [PMC free article] [PubMed] [Google Scholar]
- 13.Clarke RJ. Biochim Biophys Acta. 1997;1327:269–278. doi: 10.1016/s0005-2736(97)00075-8. [DOI] [PubMed] [Google Scholar]
- 14.Clarke RJ. Adv Colloid Interface Sci. 2001;89:263–281. doi: 10.1016/s0001-8686(00)00061-0. [DOI] [PubMed] [Google Scholar]
- 15.Pasenkiewicz-Gierula M, Murzyn K, Rog T, Czaplewski C. Acta Biochim Pol. 2000;47:601–611. [PubMed] [Google Scholar]
- 16.Petrache HI, Tu KC, Nagle JF. Biophys J. 1999;76:2479–2487. doi: 10.1016/S0006-3495(99)77403-5. [DOI] [PMC free article] [PubMed] [Google Scholar]
- 17.Shinoda K, Shinoda W, Baba T, Mikami M. J Chem Phys. 2004;121:9648–9654. doi: 10.1063/1.1806791. [DOI] [PubMed] [Google Scholar]
- 18.Lehmann M, Lichte H. Microsc Microanal. 2002;8:447–466. doi: 10.1017/S1431927602029938. [DOI] [PubMed] [Google Scholar]
- 19.Aoyama K, Ru Q. J Microsc (Oxford) 1996;182:177–185. doi: 10.1046/j.1365-2818.1996.133413.x. [DOI] [PubMed] [Google Scholar]
- 20.Fink HW, Schmid H, Ermantraut E, Schulz T. J Opt Soc Am A. 1997;14:2168–2172. [Google Scholar]
- 21.Dunin-Borkowski RE. Ultramicroscopy. 2000;83:193–216. doi: 10.1016/s0304-3991(00)00015-2. [DOI] [PubMed] [Google Scholar]
- 22.Kirkland EJ. Advancd Computing in Electron Microscopy. New York: Plenum; 1998. [Google Scholar]
- 23.Zhong SJ, Dadarlat VM, Glaeser RM, Head-Gordon T, Downing KH. Acta Crystallogr A. 2002;58:162–170. doi: 10.1107/s0108767301020256. [DOI] [PubMed] [Google Scholar]
- 24.Stallmeyer MJB, Aizawa S-I, Macnab RM, DeRosier DJ. J Mol Biol. 1989;205:519–528. doi: 10.1016/0022-2836(89)90223-4. [DOI] [PubMed] [Google Scholar]
- 25.Sosinsky GE, Francis NR, Stallmeyer MJB, DeRosier DJ. J Mol Biol. 1992;223:171–184. doi: 10.1016/0022-2836(92)90724-x. [DOI] [PubMed] [Google Scholar]
- 26.Francis NR, Sosinsky GE, Thomas D, DeRosier DJ. J Mol Biol. 1994;235:1261. doi: 10.1006/jmbi.1994.1079. [DOI] [PubMed] [Google Scholar]
- 27.Nagle JF, Tristram-Nagle S. Biochim Biophys Acta. 2000;1469:159–195. doi: 10.1016/s0304-4157(00)00016-2. [DOI] [PMC free article] [PubMed] [Google Scholar]
- 28.Buldt G, Gally HU, Seelig J, Zaccai G. J Mol Biol. 1979;134:673–691. doi: 10.1016/0022-2836(79)90479-0. [DOI] [PubMed] [Google Scholar]
- 29.Chiu SW, Jakobsson E, Scott HL. J Chem Phys. 2001;114:5435–5443. [Google Scholar]
- 30.Dubochet J, Adrian M, Chang JJ, Homo JC, Lepault J, McDowall AW, Schultz P. Q Rev Biophys. 1988;21:129–228. doi: 10.1017/s0033583500004297. [DOI] [PubMed] [Google Scholar]
- 31.Peterson U, Mannock DA, Lewis R, Pohl P, McElhaney RN, Pohl EE. Chem Phys Lipids. 2002;117:19–27. doi: 10.1016/s0009-3084(02)00013-0. [DOI] [PubMed] [Google Scholar]
- 32.Gawrisch K, Ruston D, Zimmerberg J, Parsegian VA, Rand RP, Fuller N. Biophys J. 1992;61:1213–1223. doi: 10.1016/S0006-3495(92)81931-8. [DOI] [PMC free article] [PubMed] [Google Scholar]
- 33.Mayer LD, Hope MJ, Cullis PR. Biochim Biophys Acta. 1986;858:161–168. doi: 10.1016/0005-2736(86)90302-0. [DOI] [PubMed] [Google Scholar]
- 34.Frank J. Three-Dimensional Electron Microscopy of Macromolecular Assemblies. New York: Oxford Univ Press; 2006. [Google Scholar]
- 35.Zhou ZH, Hardt S, Wang B, Sherman MB, Jakana J, Chiu W. J Struct Biol. 1996;116:216–222. doi: 10.1006/jsbi.1996.0033. [DOI] [PubMed] [Google Scholar]
- 36.Sander B, Golas MM, Stark H. J Struct Biol. 2003;142:392–401. doi: 10.1016/s1047-8477(03)00072-8. [DOI] [PubMed] [Google Scholar]
- 37.Mindell JA, Grigorieff N. J Struct Biol. 2003;142:334–347. doi: 10.1016/s1047-8477(03)00069-8. [DOI] [PubMed] [Google Scholar]
- 38.Toyoshima C, Unwin N. Ultramicroscopy. 1988;25:279–291. doi: 10.1016/0304-3991(88)90003-4. [DOI] [PubMed] [Google Scholar]
- 39.Zhu J, Penczek PA, Schroder R, Frank J. J Struct Biol. 1997;118:197–219. doi: 10.1006/jsbi.1997.3845. [DOI] [PubMed] [Google Scholar]
- 40.Steven AC, Hainfeld JF, Trus BL, Steinert PM, Wall JS. Proc Natl Acad Sci USA. 1984;81:6363–6367. doi: 10.1073/pnas.81.20.6363. [DOI] [PMC free article] [PubMed] [Google Scholar]
- 41.Stark H, Orlova EV, RinkeAppel J, Junke N, Mueller F, Rodnina M, Wintermeyer W, Brimacombe R, vanHeel M. Cell. 1997;88:19–28. doi: 10.1016/s0092-8674(00)81854-1. [DOI] [PubMed] [Google Scholar]
- 42.Bracewell RN. The Fourier Transform and Its Applications. Boston: McGraw–Hill; 2000. [Google Scholar]
- 43.Lairion F, Disalvo EA. Langmuir. 2004;20:9151–9155. doi: 10.1021/la049515k. [DOI] [PubMed] [Google Scholar]
- 44.Sachs JN, Crozier PS, Woolf TB. J Chem Phys. 2004;121:10847–10851. doi: 10.1063/1.1826056. [DOI] [PubMed] [Google Scholar]
- 45.Smondyrev AM, Berkowitz ML. J Comput Chem. 1999;20:531–545. [Google Scholar]
- 46.Villarreal MA, Diaz SB, Disalvo EA, Montich GG. Langmuir. 2004;20:7844–7851. doi: 10.1021/la049485l. [DOI] [PubMed] [Google Scholar]
- 47.Mashl RJ, Scott HL, Subramaniam S, Jakobsson E. Biophys J. 2001;81:3005–3015. doi: 10.1016/S0006-3495(01)75941-3. [DOI] [PMC free article] [PubMed] [Google Scholar]
Associated Data
This section collects any data citations, data availability statements, or supplementary materials included in this article.


