

Abstract
We previously described a primate-specific gene family, POTE, that is expressed in many cancers but in a limited number of normal organs. The 13 POTE genes are dispersed among eight different chromosomes and evolved by duplications and remodeling of the human genome from an ancestral gene, ANKRD26. Based on sequence similarity, the POTE gene family members can be divided into three groups. By genome database searches, we identified an actin retroposon insertion at the carboxyl terminus of one of the ancestral POTE paralogs. By Northern blot analysis, we identified the expected 7.5-kb POTE–actin chimeric transcript in a breast cancer cell line. The protein encoded by the POTE–actin transcript is predicted to be 120 kDa in size. Using anti-POTE mAbs that recognize the amino-terminal portion of the POTE protein, we detected the 120-kDa POTE–actin fusion protein in breast cancer cell lines known to express the fusion transcript. These data demonstrate that insertion of a retroposon produced an altered functional POTE gene. This example indicates that new functional human genes can evolve by insertion of retroposons.
Keywords: ANKRD26, cancer, primate, retroposon, testis
The POTE family of genes encodes proteins with three distinct domains. These are an amino-terminal cysteine-rich domain, a central domain with ankyrin repeats, and a carboxyl-terminal domain containing spectrin-like helices (1, 2). In humans, the POTE gene family is composed of 13 closely related paralogs dispersed among eight chromosomes. The POTE genes are found only in primates, and many paralogs have been identified in various primate genomes (1, 3). The presence of many different POTE genes on different chromosomes suggests that POTE genes could have evolved from an ancestor gene so that each paralog can function in response to different physiological demands. POTE orthologs are not present in other species, although an ancestral gene has been identified in rodents (3). RNA analysis has shown that members of the POTE family have expression restricted to a few normal tissues (prostate, testis, ovary, and placenta). In contrast, several POTE family members are expressed in breast cancer and many other cancers (4). Also, two paralogs are expressed in human embryonic stem cells (T.K.B. and I.P., unpublished data).
The mechanism by which novel gene functions evolve during speciation is of fundamental interest. Several such mechanisms have been suggested, including gene duplication, retroposition, and exon shuffling (5). Retro-elements, which include long interspersed elements (LINEs), short interspersed elements, and LTR retrotransposons, comprise 15–20% of the genome and can provide promoters, alternative exons, or poly(A) signals to potentially influence the transcription of affected genes and neighboring genomic loci (6–10). Their insertion may have played an important role in the speciation of hominoids by providing new regulatory modules capable of changing gene expression networks.
Analysis of genome sequence databases indicates that the POTE gene entered the primate genome before the divergence of the New World monkeys (NWMs) and the Old World monkeys (OWMs). This analysis also shows that a β-actin cDNA was inserted at the carboxyl terminus of one of the ancestral POTE paralogs before the divergence of the OWMs and apes and is now present in several POTE paralogs. This insertion has led to the formation of a new chimeric protein that contains both POTE and actin modules in the same protein. It is apparent that there has been a strong selection pressure to keep the chimeric POTE–actin ORF intact during primate evolution.
Results
Extended Genomic Organization of POTE Genes.
Previously, we reported that there were 13 POTE paralogs in the human genome, which could be divided into three groups based on sequence similarities (3). We also identified cDNA clones derived from five paralogs (2). Interestingly, one of the clones transcribed from a paralog on chromosome 2 (GenBank accession no. AY462871) exhibited an ORF without a stop codon, raising the possibility of the existence of longer transcripts. In the Human Genome Browser (http://genome.ucsc.edu), we have noticed several high-throughput expressed sequence tags and mRNAs that encompass POTE exons and an extended 3′ flanking region of the POTE gene, for example, BC063888 and BX649118. We, therefore, suspected that the actual transcripts of POTE genes might be longer than previously reported. In addition, close inspection of the POTE genomic loci revealed that all of the POTE transcripts might be fused with a LINE element, possibly providing the end of the transcripts (Fig. 1A).
Fig. 1.

Extended genomic organization of POTE genes. (A) Genomic organization of POTE paralogs are depicted. Domain organization and exon numbers are given at the top. Primer binding sites (arrows) and query sequences for the database search (probe 1 and probe 2) are marked at the bottom. Plain boxes indicate exons derived from the ancestral gene ANKRD26. The actin inserts and LINE elements are represented by stippled and hatched boxes, respectively. The ORFs are color-coded: orange, cysteine-rich domains (CRDs); blue, ankyrin repeats (ANKs); green, helices; and red, actin. (B) Actin insert and surrounding sequences are presented. The putative target site duplication (TSD) is marked. Dashes and dots indicate gaps and omitted bases, respectively.
Members of the POTE gene group 3 (see Fig. 1A) have an unusual structure, because there is an insertion of an actin retrogene within exon 11 of all members of this group. The actin insert is derived from a fully processed β-actin transcript and surrounded by putative target site duplications, a hallmark of a retroposition event (Fig. 1B) (11). Examination of the DNA sequence at the POTE–actin junction of these genes reveals an ORF extending from exon 11 of POTE into actin (Fig. 1A). This ORF is present in three members of group 3, POTE-2α, POTE-2β, and POTE-2γ. In the other POTE paralogs of group 3 (POTE-2δ, POTE-14α, POTE-14β and POTE-22), there is a stop codon before the actin module caused by a small deletion in a preceding exon causing a frameshift and premature termination.
Evolution of POTE Genes.
Because all of the POTE genes have exon 11 and a LINE element in their 3′ UTR sequence, we used the POTE exon 11-LINE fusion as a marker of the POTE gene formation in the primate lineage (probe 1 in Fig. 1A). To estimate the time of POTE gene emergence, we performed an extensive analysis of all available primate genome sequences by using the POTE exon 11-LINE junction sequence as a query. The POTE–LINE fusion sequences were detected in apes (chimpanzee, orangutan, and gibbon), OWMs (macaque and baboon), and NWMs (marmoset) (Fig. 2) (12). The fact that a POTE gene is found in marmosets indicates that the POTE gene ancestor had emerged before the divergence of NWMs and OWMs. The marmoset sequence is most similar to POTE-8 (group 1), which is likely to be the most ancient member of POTE genes (3). However, the sequence similarities among members of three groups are greater than that between the marmoset sequence and any POTE gene. Therefore, we deduce that the marmoset sequence might be a direct descendent of the ancestor of all POTE genes. The events that produced the three POTE gene groups must have occurred before the OWM–ape split but after the OWM–NWM split.
Fig. 2.

Evolution of POTE genes. A tentative evolutionary history of POTE genes is summarized. A check mark indicates that a POTE gene fragment mostly similar to the corresponding probe sequence was observed in the given species (chimpanzee, Pan troglodytes; orangutan, Pongo pygmaeus; white-cheeked gibbon, Nomascus leucogenys; rhesus macaque, Macaca mulatta; Hamadryas baboon, Papio hamadryas; and white-tufted-ear marmoset, Callithrix jacchus). It is likely that the sole POTE gene fragment detected in marmoset (indicated by an asterisk) is ancestral to all of the POTE genes in OWMs and apes. The tree and estimated divergence times are given at the left (12).
We also searched the primate genome sequence data by using the POTE–actin fusion sequence derived from human POTE-2γ gene as a query (probe 2 in Figs. 1A and 2). The fusion sequence was found in all species that contain a POTE-2γ homolog or a member of group 3 detected by probe 1 (Fig. 2). This observation and the fact that the POTE–actin fusion is found only in group 3 members indicate that the retroposition of actin occurred in the ancestor of group 3 before the divergence of OWMs and apes. By using the ancestral POTE ORF inferred from the ANKRD26 gene (3) or from a consensus sequence of all POTE genes, the actin sequence can be fused seamlessly to generate a single ORF, indicating that the ancestral POTE–actin fusion gene must have encoded a POTE–actin fusion protein. Subsequent rounds of duplication must have resulted in propagation of POTE–actin fusion genes in the human genome, some of which suffered nucleotide deletions that resulted in frameshifts and premature terminations. The actin retrogene in all group 3 POTE genes retains the original ORF without any deleterious mutation, indicating that the actin retrogene has been under purifying selection pressure since it was introduced in the ancestral genome of OWMs and apes. It also implies that the frameshift mutations that have led to premature terminations in some members of group 3 occurred very recently. The 4-bp deletion in exon 5 of POTE-2δ was not detected in the chimpanzee genome sequence (March 2006 freeze), suggesting that the deletion might be human-specific. However, the 5-bp deletion in exon 10 of POTE-14α, POTE-14β, and POTE-22 was found in the chimpanzee genome, indicating that this deletion occurred before the human–chimp split.
Detection of RNA Containing POTE and Actin Sequences.
To determine whether the actin cDNA that is inserted into the 3′ end of the POTE-2α, POTE-2β, and POTE-2γ genes is transcribed into mRNA, we used several breast cancer cell lines, because we had previously shown that POTE-2α and POTE-2γ were expressed in breast cancer (4). To do this, we used a RT-PCR analysis with a primer pair in which one primer was located at a conserved sequence in POTE-2α, POTE-2β, and POTE-2γ (exon 10) and the other in the actin insert of exon 11 (primers PA01 and PA07 shown in Fig. 1A). As a source of mRNA, we used mRNA from four different breast cancer cell lines (MCF-7, HTB-19, HTB-20, and HTB-30) that express POTE-2α, POTE-2β, and/or POTE-2γ (Table 1). POTE is not expressed in the normal breast cell line MCF-10A, consistent with lack of POTE expression in normal breast (4). However, when the MCF-10A cell line is transformed individually or together with the ErbB2 or c-Ha-Ras oncogenes to deregulate the transcription, POTE-2α becomes highly expressed (Table 1).
Table 1.
Relative expression of POTE paralogs in breast cancer cell line
| Cell line | POTE paralog expression (%) |
No. of clones sequenced |
|---|---|---|
| MCF-7 | 2γ (100) | 15 |
| HTB-19 | 2γ (100) | 8 |
| HTB-20 | 2α (75) | 8 |
| 2γ (12.5) | ||
| 2β (12.5) | ||
| HTB-30 | 2γ (95) | 19 |
| 22 (5) | ||
| MCF-10A | No expression | |
| MCF-10A + ErbB2 | 2α (100) | 11 |
| MCF-10A + c-Ha-Ras | 2α (100) | 8 |
| MCF-10A + ErbB2 + c-Ha-Ras | 2α (100) | 11 |
Total RNAs from different cell lines were isolated by using TRIzol reagent. First-strand cDNA was synthesized by using first-strand c-DNA synthesis kit and random hexamer primer. Primers T444 and T445 were used to amplify a region of sequence that is similar to each POTE paralog with a sequence difference of 1–6%. By cloning the resulting PCR fragment into a TA vector and sequencing the insert, we identified which paralogs were expressed in each sample. The profile of POTE paralog expression is shown, and the number of sequenced clones is indicated.
A RT-PCR analysis in Fig. 3 shows that the POTE–actin fusion mRNAs was detected as the expected size of DNA fragments in the four breast cancer cell lines and not in POTE-negative MCF-10A cells. This band was sequenced and shown to contain sequences from POTE and actin. These results indicate that a hybrid transcript is present in all four breast cancer cell lines.
Fig. 3.

RT-PCR analysis of POTE–actin fusion mRNA in human breast cancer cell lines. Total RNAs were isolated from different cell lines, and first-strand cDNAs were made by reverse transcriptase reaction. PCR on cDNA from breast cancer cell lines was performed with primers specific for POTE–actin fusion transcript (PA01 and PA07 shown in Fig. 1). The breast cancer cell lines MCF-7, HTB-30, HTB-19, and HTB-20 produce a specific 650-bp product. Primer specific for β-actin transcript was used to validate the integrity of the RNA samples.
Cloning of POTE-2-Actin cDNA.
To determine the size of the POTE mRNA present in the breast cancer cell lines, a Northern blot analysis was performed with mRNA from the MCF-10A-Ras/ErbB2 cells that had the highest POTE expression level of the cell lines examined (Fig. 4). By using a probe from the 3′ end of the mRNA that is located in a noncoding region down stream from actin (location shown in Fig. 1A), a specific band ≈7.5 kb in size was observed. This mRNA is large enough to encode a POTE–actin fusion transcript. Furthermore, the band is approximately the same size as POTE transcripts detected in prostate and testis, normal tissues that express many POTE paralogs (1). No band was detected in POTE-negative MCF-10A cells.
Fig. 4.
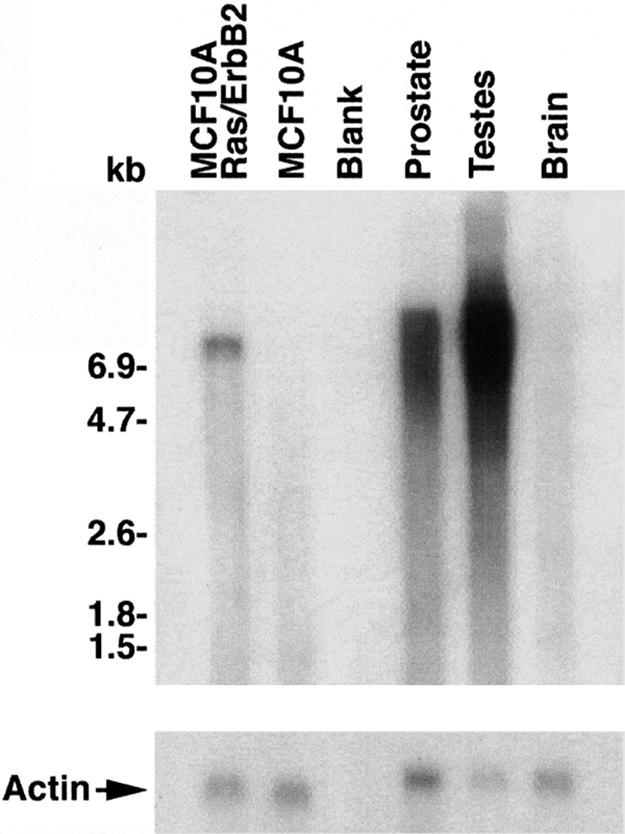
Analysis of POTE–actin fusion transcript in a breast cancer cell line. Northern blot analysis showing expression and transcript sizes of POTE–actin fusion transcript in different samples. Approximately 2.5 μg of mRNAs from different samples was run on agarose gel and transferred to a nylon membrane. The 1.2-kb probe was generated by PCR and labeled with 32P by using the random priming extension method. Membrane was incubated for 2 h in hybridization buffer followed by addition of denatured probe and incubation for an additional 12 h. Membrane then was washed and subjected to autoradiography. A specific band of ≈7.5 kb in size was detected in the MCF-10A-Ras/ErbB2 lane, but in prostate and in testis the signal is somewhat diffuse over 6.5 kb to 9.0 kb in size, and there are no detectable bands in MCF-10A and in brain.
To clone the full-length POTE–actin transcript, we prepared RACE-ready cDNA from MCF-10A-Ras/ErbB2 cells and performed both 5′ and 3′ RACE-PCR. After analyzing the RACE-PCR products, specific primers were made to clone the full-length transcript. The cDNA sequence indicates it encodes a protein of 1,075 aa with a predicted molecular mass of 121.4 kDa. The DNA sequence established that this cDNA encoded a POTE-2α–actin fusion protein.
Detection of POTE–Actin Fusion Protein in Breast Cancer Cell Lines by Specific Antibodies.
To determine which POTE proteins are present in different cancers and tissues, we have prepared mAbs that specifically react with various POTE paralogs (unpublished data). We used two of these mAbs to detect the POTE–actin fusion protein. Protein extracts were prepared from cell lines, then immunoprecipitation (IP) was performed with one mAb, HP8, and a Western blot analysis was performed with a different mAb, PG5. As shown in Fig. 5, a specific band of 120 kDa, the expected size for the POTE–actin fusion protein, was detected in protein extracts from the four breast cancer cell lines. No band was detected in that region in Raji, KB, or 293T cells that do not contain POTE transcripts. To demonstrate the performance of this anti-POTE IP-Western blot method, we transfected 293T cells with a POTE-2 isoform that does not contain actin sequences and detected the expected 40-kDa band (293T + 2γC lane in Fig. 5). This POTE isoform also was detected in HTB-19 and HTB-30 cells. As positive controls for Western blot analysis, cell lysates prepared from 293T cells transfected with each POTE-encoding plasmid were loaded directly in the first three lanes without IP. The PG5 antibody specifically detected all three POTE paralogs: POTE-22, POTE-2γC, and POTE-2α–actin. We also attempted to determine whether anti-actin antibodies reacted with the fusion protein but were unsuccessful (data not shown). This failure is probably because of the relatively low affinity of these antibodies or nonreactivity attributable to changes in the amino acid sequence of actin (see below).
Fig. 5.
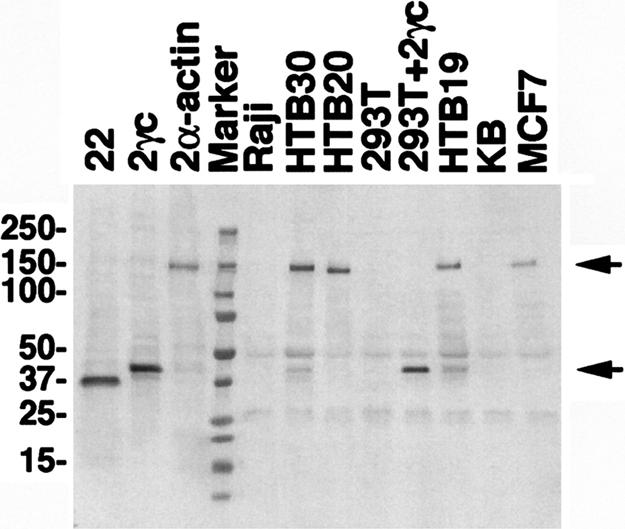
Detection of POTE–actin fusion protein in a breast cancer cell line. Cell lysates from different cell lines were subjected to IP by using HP8 antibodies. Immunoprecipitates were resolved in a 4–20% PAGE gel, transferred into a PVDF membrane and immunoblotted with PG5 antibody. A specific band of 140 kDa in size (upper arrow) was detected in MCF-7, HTB-19, HTB-20, HTB-30, and POTE-2α–actin-transfected 293T (positive control) lysates. No specific band was detected in KB, Raji, or 293T cell extracts. A smaller protein of 42 kDa in size (lower arrow) was detected in HTB-19 and in HTB-30, representing POTE protein without actin fusion. As positive controls for Western blot analysis, cell lysates prepared from 293T cells transfected with each POTE-encoding plasmid were loaded in the first three lanes without IP.
Cellular Location of POTE–Actin Fusion Protein.
We previously showed that POTE is located on the inner aspect of the plasma membrane (2). To determine the location of the POTE–actin fusion protein, we inserted the POTE–actin cDNA into an expression plasmid and used it to transfect the MCF-7 breast cancer cell line. MCF-7 cells contain very low POTE mRNA levels, and the intrinsic POTE cannot be detected in these cells by immunofluorescence. The confocal images in Fig. 6 show that the fusion protein is located at the plasma membrane in transfected cells and colocalizes with actin filaments that are present just beneath the cell membrane. No signal was detected in untransfected cells (data not shown).
Fig. 6.

Localization of POTE–actin protein in transfected cells. MCF-7 cells were transfected with pcDNA3–POTE–actin plasmid, and, after 48 h, the cells were stained with the anti-POTE antibody PG5 and analyzed by confocal microscopy. Green represents POTE staining, and red represents F-actin staining. Nuclei (blue staining) were stained with 4,6-diamidino-2-phenylindole (DAPI).
Discussion
We show here that several members of the POTE gene family contain an actin retroposon that was inserted at the carboxyl terminus of one of the ancestral POTE paralogs before the divergence of the OWM and apes and is now present in several POTE paralogs. The human POTE genes are descendents of an ancestral POTE gene, which was formed by a genomic duplication of a part of the ANKRD26 gene. A series of gene duplications combined with internal exon deletions or duplications produced three groups of POTE genes (3). Retroposition of an actin module into a primitive group 3 gene then created a novel chimeric gene. Analysis of the putative first POTE–actin fusion transcript based on either the ANKRD26 gene or a multiple alignment of all human POTE genes indicates that this early gene fusion would have encoded a POTE–actin fusion protein. Furthermore, retention of an intact actin ORF in all POTE–actin fusion genes in the human genome suggests that the actin module of the fusion protein has been kept functionally active since it was first inserted during OWM evolution.
We used the DIVERGE part of the GCG program package (Wisconsin Package Version 10.2; Accelrys, San Diego, CA) to calculate the synonymous (Ks) and nonsynonymous (Ka) nucleotide substitution rates between human β-actin gene and the actin part of the POTE genes. Some of the results are shown in Table 2. It shows that the Ka values between β-actin and the actin part of POTE genes are between 4% and 5%, which are comparable to the Ka value of 4% between nonactin parts of group 3 POTE genes 2γ and 14 and somewhat smaller than 6% or 7% between nonactin parts of group 2 genes 15 and 21 and the group 3 gene 2γ (1). This finding implies that the actin part of the gene is under similar purifying evolutionary pressure as the rest of the POTE gene. On the other hand, the Ks values between the β-actin gene and the actin part of the POTE genes are much larger than the Ks values of either between the actin parts (Table 2) or between the nonactin parts (1) of different POTE genes. It has been observed (13, 14) that retrogenes derived from high-GC content parental genes but inserted into a low-GC content genomic region tend to show an increased rate of silent site substitutions, which make the GC content of the retrogene more similar to that in the new location. The GC content of the human and rhesus macaque authentic β-actin coding regions is 59%, whereas that of the consensus POTE parts range 42–43%. The actin ORFs of the POTE genes show reduced GC content of 57–58%, suggesting that they are still in the process of adaptation to the local GC content.
Table 2.
The Ka (upper right triangle) and Ks (lower left triangle) substitutions per 100 sites for β-actin and the actin-part of three representative group 3 POTE genes
| β-Actin | 14α | 2γ | 2δ | |
|---|---|---|---|---|
| β-Actin | — | 4.7 | 4.4 | 4.1 |
| 14α | 19.0 | — | 2.6 | 3.6 |
| 2γ | 16.5 | 6.9 | — | 2.3 |
| 2δ | 19.2 | 8.7 | 5.3 | — |
Vinckenbosch et al. (15) observed that evolutionary selection generally acted to suppress active transcription of retrogenes that are located inside another gene. Nevertheless, they identified >100 such retrogenes in the human genome that appear to be actively transcribed and functional. These are inserted into an intron or a UTR of the host gene, some of which produce chimeric ORFs made of exons from both the host and the retrogene, as shown in the cases of the jingwei gene in the fruit fly (16) and the TRIMCyp gene in the owl monkey (17). Retroposition of a protein coding gene has also been found to result in the formation of a novel functional RNA (18). New genes can also arise by mechanisms such as retroposition of a cDNA, cointegration of a retro-element, exon shuffling, and creation of a new splice site (19). The POTE–actin fusion gene is distinct from these mechanisms because the actin retrocopy was directly inserted into a coding exon of the POTE gene to generate a fused coding region derived from original ORFs.
Introduction of premature stop codons into some of the POTE–actin genes apparently occurred after redundant copies were propagated. The actin-part of these genes (POTE-14α, POTE-14β, and POTE-22) appears intact and can code for an actin protein, were it not for the frameshift mutation upstream of actin. The Ka values between the actin-parts of these genes and those of other genes in group 3 (Table 2 and data not shown) are similar. These observations indicate that the frameshift mutation was introduced quite recently and that the POTE genes are still possibly in the process of active evolution. It is interesting that the POTE protein already contains spectrin-like domains, which are predicted to interact with actin. The fusion of actin with POTE apparently provides an additional way for POTE proteins to interact with the cytoskeleton.
Materials and Methods
Cell Lines and Culture Conditions.
MCF-7, HTB-19, HTB-20, HTB-30, and 293T cell lines were maintained as recommended by ATCC (Manassas, VA). Cell lines MCF-10A, MCF-10A-Ras, MCF-10A-ErbB2, and MCF-10A-Ras/ErbB2 were obtained from David Salomon (National Cancer Institute, National Institutes of Health, Bethesda, MD) and maintained accordingly (20).
Primers.
The primers used in this study were synthesized by the Lofstrand Laboratory (Gaithersburg, MD), and the sequences of the primers used were as follows: T444, 5′-CAA TGC CAG GAA GAT GAA TGT GCG-3′; T445, 5′-TCT CTG GCC GTC TGT CCA GAT AGA T-3′; PA01, 5′-GAA CAA AAT GAT ACT CAG AAG CA-3′; and PA07, 5′-TGT TGA AGG TCT CAA ACA TGA TC-3′.
Computer Analysis of Genomic Databases.
Systematic search of the growing primate genome sequence information in the National Center for Biotechnology Information (NCBI) (Bethesda, MD) sequence database enabled us to estimate the time of POTE gene emergence and the retroposition of a β-actin transcript. First, we prepared three query sequences each ≈400-bp-long (probe 1 in Fig. 1A), encompassing POTE exon 11 and the LINE element. These sequences were selected from the representative members of the three POTE gene groups (3): group 1, POTE-8; group 2, POTE-21; and group 3, POTE-2γ. In addition, a query sequence for detection of the actin retroposition was prepared from POTE-2γ (probe 2 in Fig. 1A). There, four query sequences were used to detect the POTE gene and actin retroposition in primate genome sequences by using the NCBI BLAST server (http://ncbi.nih.gov/BLAST). If the entire query sequence aligned to a genomic sequence in a given species with >80% sequence identity, we concluded that the species possessed a POTE gene. Sequence databases used in this study include genome assemblies, GenBank (nr, htgs, chromosome, and wgs) databases, and whole-genome shotgun traces in the NCBI Trace database. Whole-genome shotgun traces were assembled into contigs with the CAP3 program (21).
Northern Blot Analysis.
Total RNAs were isolated from different cell lines by using the RNA miniprep kit from Stratagene (La Jolla, CA) followed by isolation of the mRNA by using the Oligotex mRNA midi kit from Qiagen (Alameda, CA). Approximately 2.5 μg of mRNAs from different samples was run on agarose gel and transferred to a nylon membrane. The 1.2-kb probe was generated by PCR and labeled with 32P by using the random priming extension method. Membranes were incubated for 2 h in hybridization buffer followed by addition of denatured probe and incubation for an additional 12 h. Membranes were washed two times for 15 min each in 2× SSC/0.1% SDS, at room temperature and then washed two times for 20 min each in 0.1× SSC/0.1% SDS at 60°C. The membranes then were subjected to autoradiography.
Expression Analysis of POTE–Actin Fusion Transcript by RT-PCR.
Total RNAs from different cell lines were isolated by using TRIzol reagents (Invitrogen, Carlsbad, CA). First-strand cDNAs were synthesized from the isolated RNA by using a first-strand cDNA synthesis kit following the manufacturer's instructions (Amersham, Piscataway, NJ). PCR on cDNA from breast cancer cell lines was performed with primers specific for POTE–actin fusion transcript (PA01 and PA07 shown in Fig. 1A).
Cloning of the POTE–Actin Fusion cDNA.
RACE ready cDNAs were prepared from MCF-10A-Ras/ErbB2 RNA by using a SMART RACE cDNA amplification kit (Clontech, Palo Alto, CA) and was used to performed 5′ and 3′ RACE reaction. Gene-specific primers T444 and PA01 were used for the 3′ RACE reaction, and primer T445 was used for 5′ RACE reaction. Several individual clones from the RACE product were isolated and sequenced to establish the correct POTE–actin transcript sequence. Finally, the full-length cDNA encoding POTE–actin ORF was amplified from MCF-10A-Ras/ErbB2 cDNA by PCR, and Taq-amplified PCR products were cloned with the Topo TA cloning kit (Invitrogen) and sequenced.
IP and Western Blot Analysis.
Cells were grown in log phase, washed with PBS, and harvested with a cell scraper. After centrifugation, cell pellets were lysed with RIPA buffer (50 mM Tris·HCl, pH 7.5/150 mM NaCl/5 mM EDTA/1% Nonidet P-40/1% deoxycolate/0.1% SDS/1 mM PMSF/1 μg/ml leupeptin/1 μg/ml aprotinin) on ice. After centrifugation, the protein concentration of the supernatants was determined by Coomassie Plus Protein Assay Reagent (Pierce, Rockford, IL). For IP, 4-mg proteins of each cell lysate were incubated with 10 μg of HP8 anti-POTE mAb (T.I., S.N., and I.P., unpublished data) at 4°C for 2 h and then 10 μl of protein G-Sepharose beads were added and incubated for 1 h at 4°C. After washing, the proteins bound on the beads were dissolved in SDS/PAGE sample buffer and separated on a 4–20% gradient SDS/PAGE gel under reducing condition. After transfer to a PVDF membrane (0.2 μm; Immuno-Blot; Bio-Rad, Richmond, CA), the POTE proteins on the membrane were detected by incubation with 0.5 μg/ml of PG5 anti-POTE mAb (T.I., S.N., and I.P., unpublished data) followed by alkaline phosphatase-labeled goat anti-mouse IgG2b (Invitrogen) (final 1/3,000 dilution) and 5-bromo-4-chloro-3-indolyl phosphate/p-nitroblue tetrazolium chloride substrate. As a control for IP, 3 μg of POTE-2γC/293T lysate was added to 4 mg of 293T lysates, and the IP was performed as described. For the controls in Western blot analysis, 3 μg of 293T cell lysates transfected with plasmids encoding each POTE paralog was run on the gel without IP.
Immunofluorescence Analysis.
MCF-7 cells grown on a cover glass were washed with PBS and fixed with 4% paraformaldehyde for 30 min. After permeabilization with 0.5% Triton X-100 for 10 min, the samples then were blocked with 3% BSA for 30 min. Samples then were stained by primary antibody (anti-PG5, 0.5 μg/ml) for 2 h in PBS/BSA, followed by Alexa Fluor-conjugated secondary antibody staining for 1 h. Filamentous actin was stained by TRITC-labeled phalloidin (Sigma, St. Louis, MO) with the secondary antibody incubation. Cells were washed four times with PBS after secondary antibody staining and then mounted on glass slides by using mounting medium with DAPI (Vector Laboratories, Burlingame, CA). Images were obtained by using the Zeiss (Thornwood, NY) LSM 510 confocal microscope.
Acknowledgments
We thank Ms. Chin-Hsien Tai for the Ks/Ka calculation. This work was supported by the Intramural Research Program of the National Institutes of Health, National Cancer Institute, Center for Cancer Research.
Abbreviations
- LINEs
long interspersed elements
- NWM
New World monkey
- OWM
Old World monkey
- IP
immunoprecipitation
- Ks
synonymous
- Ka
nonsynonymous
Footnotes
The authors declare no conflict of interest.
References
- 1.Bera TK, Zimonjic DB, Popescu NC, Sathyanarayana BK, Kumar V, Lee B, Pastan I. Proc Natl Acad Sci USA. 2002;99:16975–16980. doi: 10.1073/pnas.262655399. [DOI] [PMC free article] [PubMed] [Google Scholar]
- 2.Bera TK, Huynh N, Maeda H, Sathyanarayana BK, Lee B, Pastan I. Gene. 2004;337:45–53. doi: 10.1016/j.gene.2004.05.009. [DOI] [PubMed] [Google Scholar]
- 3.Hahn Y, Bera TK, Pastan IH, Lee B. Gene. 2006;366:238–245. doi: 10.1016/j.gene.2005.07.045. [DOI] [PubMed] [Google Scholar]
- 4.Bera TK, Saint-Fleur A, Lee Y, Kydd A, Hahn Y, Popescu NC, Zimonjic DB, Lee BK, Pastan I. Cancer Res. 2006;66:52–56. doi: 10.1158/0008-5472.CAN-05-3014. [DOI] [PubMed] [Google Scholar]
- 5.Long M, Betrán E, Thornton K, Wang W. Nat Rev Genet. 2003;4:865–875. doi: 10.1038/nrg1204. [DOI] [PubMed] [Google Scholar]
- 6.Ball M, McLellan A, Collins B, Coadwell J, Stewart F, Moore T. Gene. 2004;325:103–113. doi: 10.1016/j.gene.2003.10.001. [DOI] [PubMed] [Google Scholar]
- 7.Muotri AR, Chu VT, Marchetto MC, Deng W, Moran JV, Gage FH. Nature. 2005;435:903–910. doi: 10.1038/nature03663. [DOI] [PubMed] [Google Scholar]
- 8.Nigumann P, Redik K, Matlik K, Speek M. Genomics. 2002;79:628–634. doi: 10.1006/geno.2002.6758. [DOI] [PubMed] [Google Scholar]
- 9.Plant KE, Routledge SJ, Proudfoot NJ. Mol Cell Biol. 2001;21:6507–6514. doi: 10.1128/MCB.21.19.6507-6514.2001. [DOI] [PMC free article] [PubMed] [Google Scholar]
- 10.Wheelan SJ, Aizawa Y, Han JS, Boeke JD. Genome Res. 2005;15:1073–1078. doi: 10.1101/gr.3688905. [DOI] [PMC free article] [PubMed] [Google Scholar]
- 11.Kazazian HH., Jr Science. 2004;303:1626–1632. doi: 10.1126/science.1089670. [DOI] [PubMed] [Google Scholar]
- 12.Woods CG, Bond J, Enard W. Am J Hum Genet. 2005;76:717–728. doi: 10.1086/429930. [DOI] [PMC free article] [PubMed] [Google Scholar]
- 13.Marques AC, Dupanloup I, Vinckenbosch N, Reymond A, Kaessmann H. PLOS Biol. 2005;3:1970–1979. doi: 10.1371/journal.pbio.0030357. [DOI] [PMC free article] [PubMed] [Google Scholar]
- 14.Bustamante CD, Nielsen R, Hartl DL. Mol Biol Evol. 2002;19:110–117. doi: 10.1093/oxfordjournals.molbev.a003975. [DOI] [PubMed] [Google Scholar]
- 15.Vinckenbosch N, Dupanloup I, Kaessmann H. Proc Natl Acad Sci USA. 2006;103:3220–3225. doi: 10.1073/pnas.0511307103. [DOI] [PMC free article] [PubMed] [Google Scholar]
- 16.Long M, Langley CH. Science. 1993;260:91–95. doi: 10.1126/science.7682012. [DOI] [PubMed] [Google Scholar]
- 17.Sayah DM, Sokolskaja E, Berthoux L, Luban J. Nature. 2004;430:569–573. doi: 10.1038/nature02777. [DOI] [PubMed] [Google Scholar]
- 18.Wang W, Brunet FG, Nevo E, Long M. Proc Natl Acad Sci USA. 2002;99:4448–4453. doi: 10.1073/pnas.072066399. [DOI] [PMC free article] [PubMed] [Google Scholar]
- 19.Courseaux A, Nahon J-L. Science. 2001;291:1293–1297. doi: 10.1126/science.1057284. [DOI] [PubMed] [Google Scholar]
- 20.Ciardiello F, Gottardis M, Basolo F, Pepe S, Normanno N, Dickson R, Bianco A, Salomon D. Mol Carcinogen. 1992;6:43–52. doi: 10.1002/mc.2940060108. [DOI] [PubMed] [Google Scholar]
- 21.Huang X, Madan A. Genome Res. 1999;9:868–977. doi: 10.1101/gr.9.9.868. [DOI] [PMC free article] [PubMed] [Google Scholar]